

The Dose-Response Associations of Sugar-Sweetened Beverage Intake with the Risk of Stroke, Depression, Cancer, and Cause-Specific Mortality: A Systematic Review and Meta-Analysis of Prospective Studies
- PMID: 35215425
- PMCID: PMC8875574
- DOI: 10.3390/nu14040777
The Dose-Response Associations of Sugar-Sweetened Beverage Intake with the Risk of Stroke, Depression, Cancer, and Cause-Specific Mortality: A Systematic Review and Meta-Analysis of Prospective Studies
Abstract
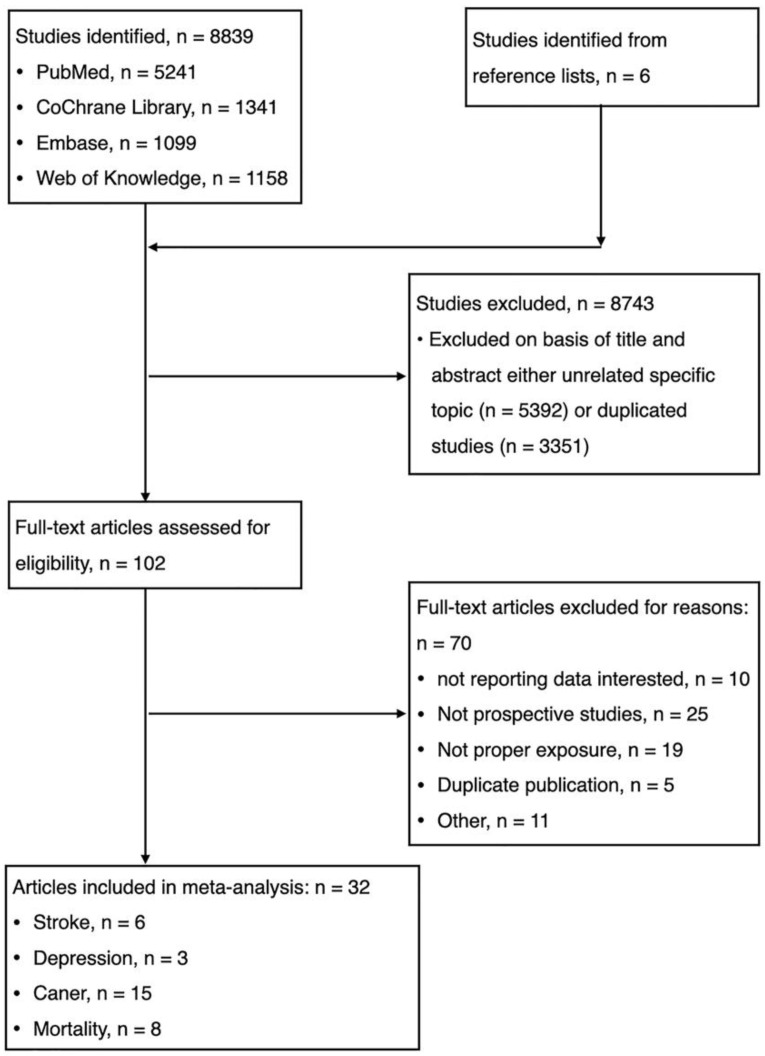
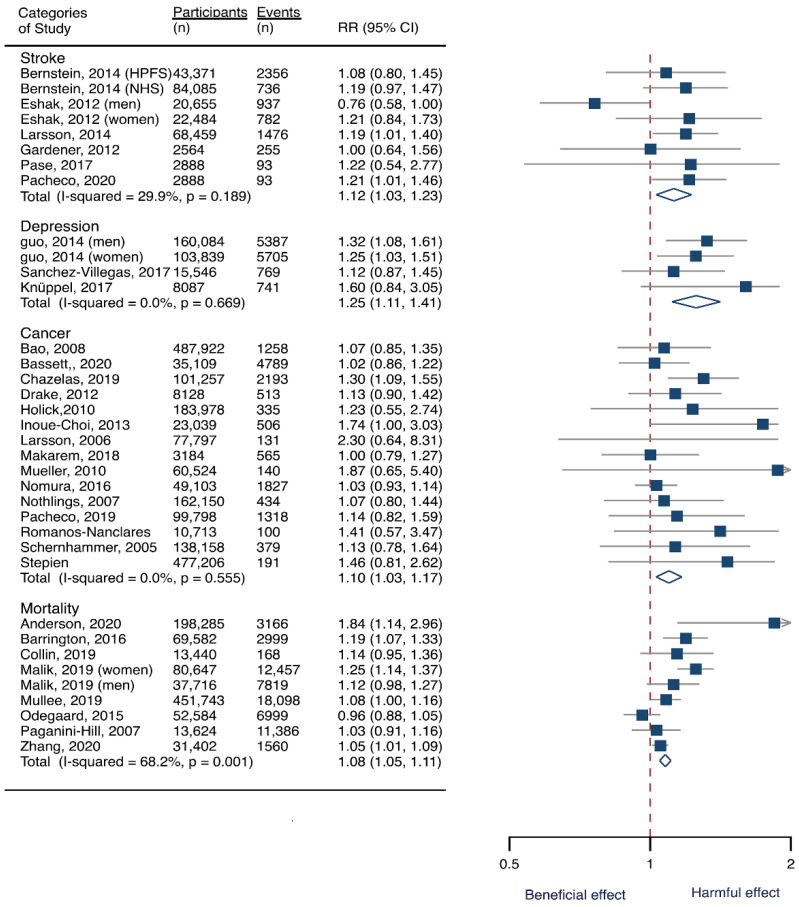
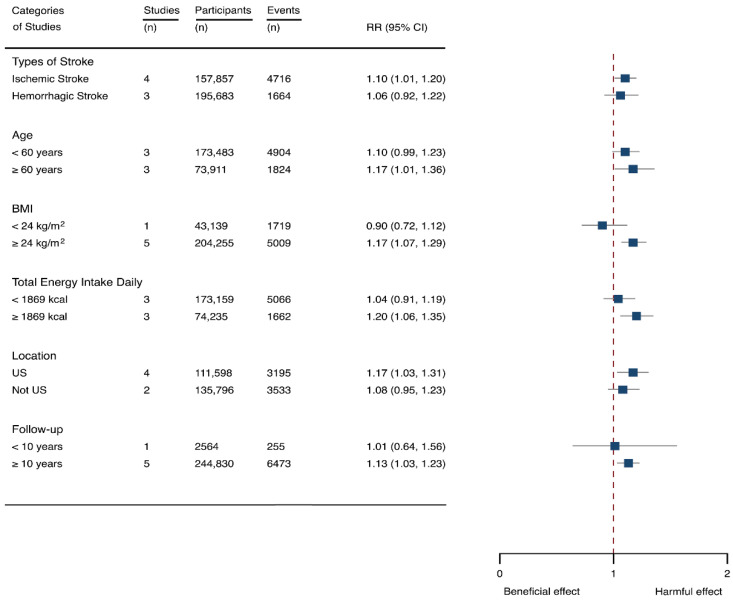
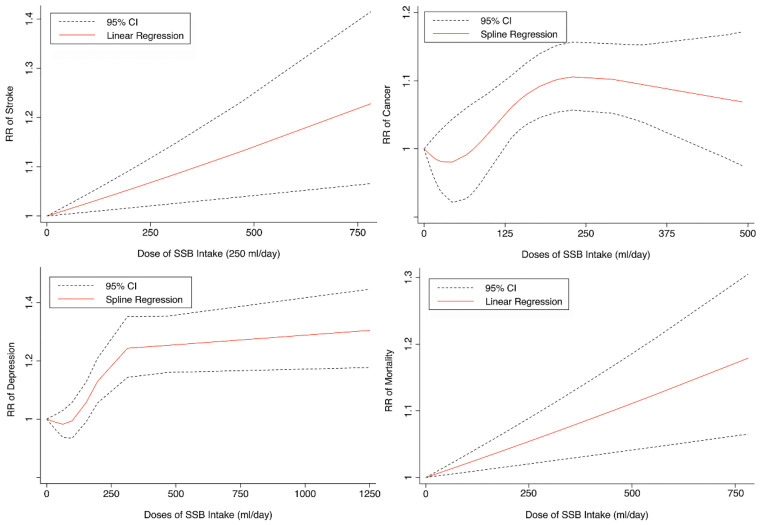
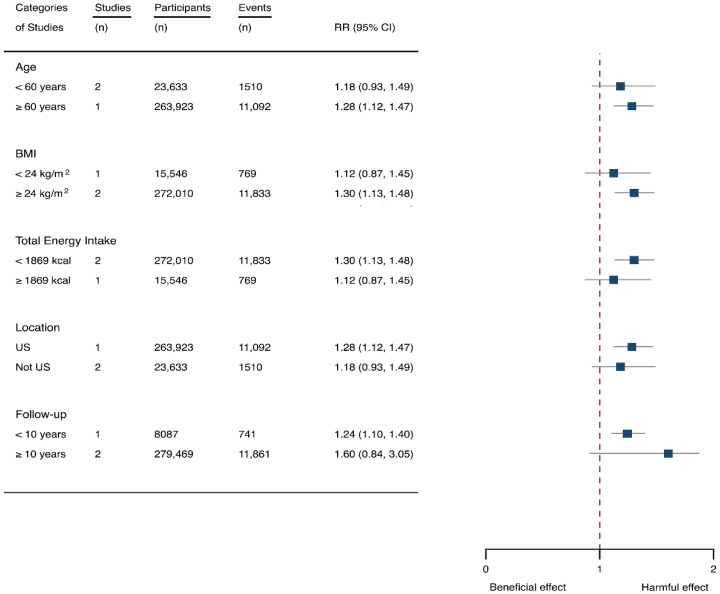
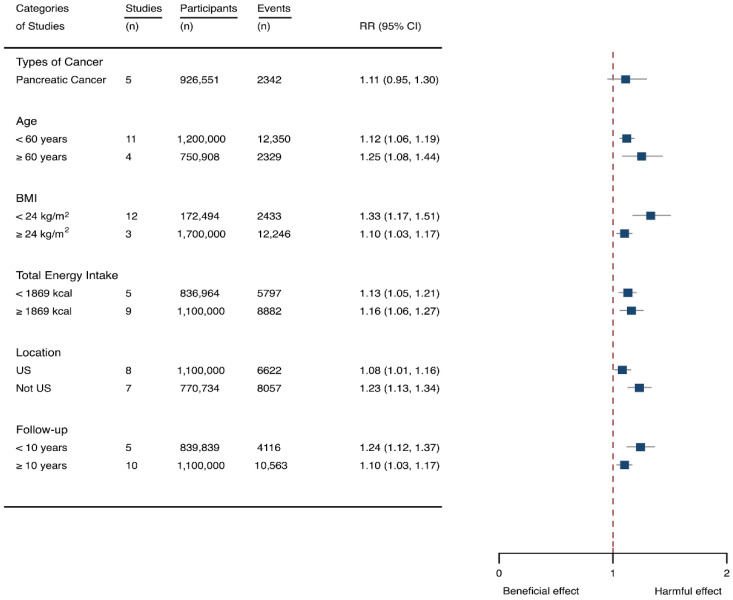
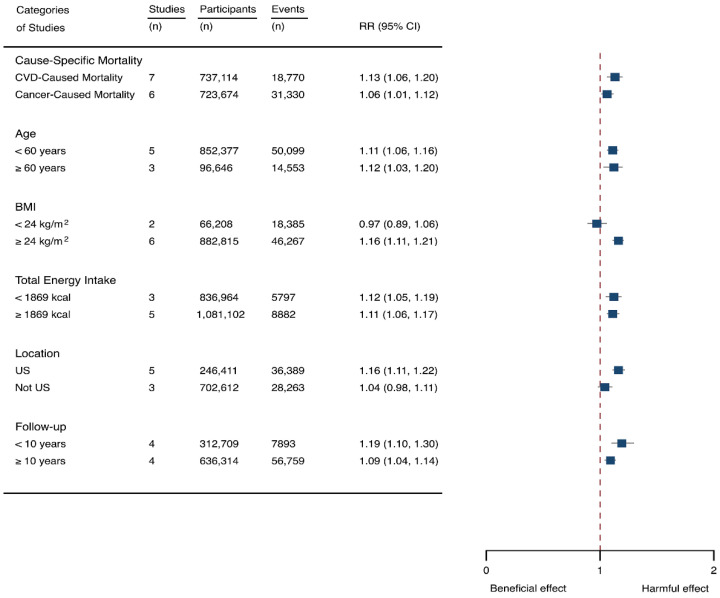
The associations between sugar-sweetened beverage (SSB) consumption and the risk of stroke, depression, cancer, and cause-specific mortality have not been determined, and the quantitative aspects of this link remain unclear. This meta-analysis therefore conducted a systematic review and dose-response analysis to determine their causal links. The database searches were conducted in PubMed, Cochrane library, Embase, Web of Science up to 10 November 2021. The intervention effects were evaluated by relative risk (RR) with 95% confidences (CI). Thirty-two articles met the inclusion criteria. Higher levels of SSB consumption significantly increased the risk of stroke (RR 1.12, 95% CI 1.03-1.23), depression (1.25, 1.11-1.41), cancer (1.10, 1.03-1.17), and all-cause mortality (1.08, 1.05-1.11) compared with none or lower SSB intake. The associations were dose-dependent, with per 250 mL increment of SSB intake daily increasing the risk of stroke, depression, cancer, and all-cause mortality by RR 1.09 (1.03-1.15), 1.08 (1.06-1.10), 1.17 (1.04-1.32), and 1.07 (1.03-1.11), respectively. The link was curved for depression and cancer risk (pnon-linear < 0.05). Subgroup analysis suggested that higher SSB intake increased ischemic stroke by 10%, CVD-caused mortality by 13%, and cancer-caused mortality by 6.0% than none or lower SSB consumption. It is suggested that SSB accounts for a leading risk factor of stroke, depression, cancer, and mortality, and that the risk rises in parallel with the increment of SSB intake (and is affected by participant characteristics).
Keywords: cancer; depression; mortality; stroke; sugar-sweetened beverage.
Conflict of interest statement
The authors declare no conflict of interest. The funders had no role in the design of the study; in the collection, analyses, or interpretation of data; in the writing of the manuscript; or in the decision to publish the results.
Figures
References
-
- Chatelan A., Rouche M., Dzielska A., Lebacq T., Fismen A.-S., Kelly C., Zaborskis A., Kopcakova J., Tsareva A., Kalman M., et al. Time trends in consumption of sugar-sweetened beverages and related socioeconomic differences among adolescents in Eastern Europe: Signs of a nutrition transition? Am. J. Clin. Nutr. 2021;114:1476–1485. doi: 10.1093/ajcn/nqab175. - DOI - PubMed
-
- Ogden C.L., Kit B.K., Carroll M.D., Park S. Consumption of sugar drinks in the United States, 2005–2008. NCHS Data Brief. 2011;71:1–8. - PubMed
-
- Rosinger A., Herrick K., Gahche J., Park S. Sugar-sweetened Beverage Consumption among U.S. Adults, 2011–2014. NCHS Data Brief. 2017;270:1–8. - PubMed
Publication types
MeSH terms
Grants and funding
LinkOut - more resources
Full Text Sources
Medical
Miscellaneous
