

Effects of Zn-Enriched Bifidobacterium longum on the Growth and Reproduction of Rats
- PMID: 35215433
- PMCID: PMC8878668
- DOI: 10.3390/nu14040783
Effects of Zn-Enriched Bifidobacterium longum on the Growth and Reproduction of Rats
Abstract
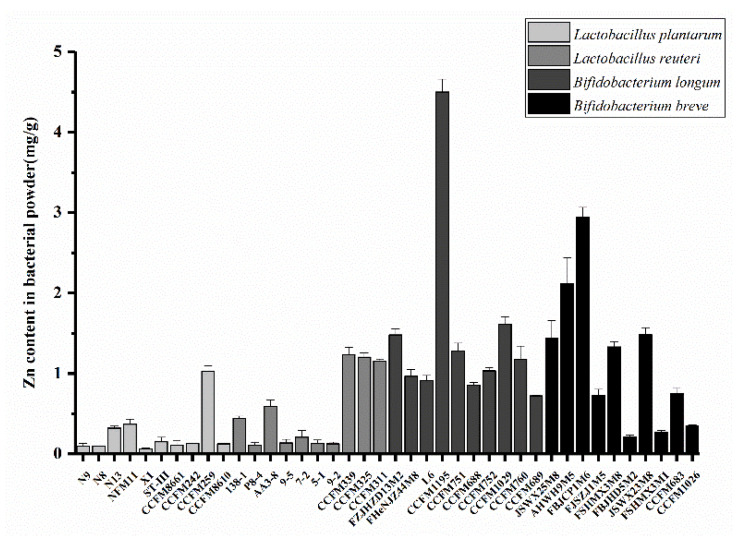
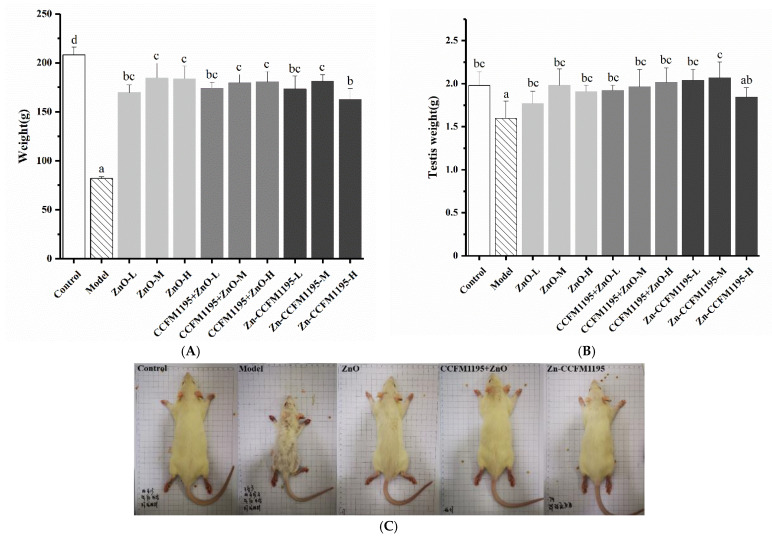
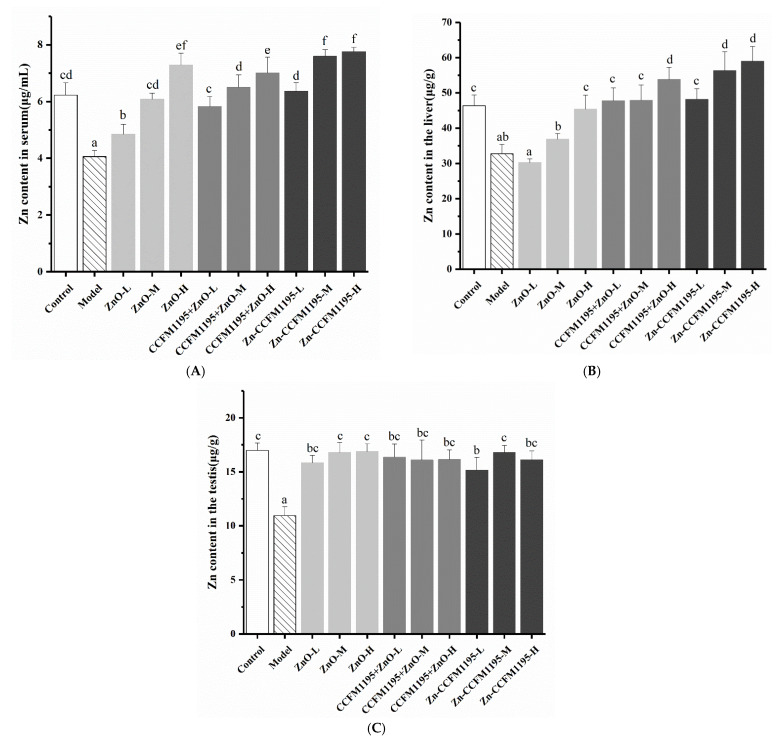
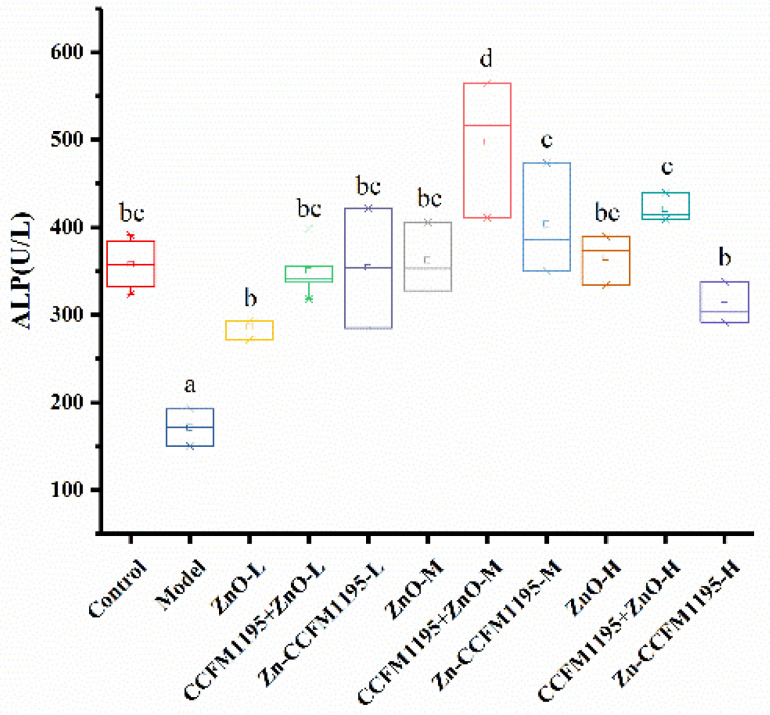
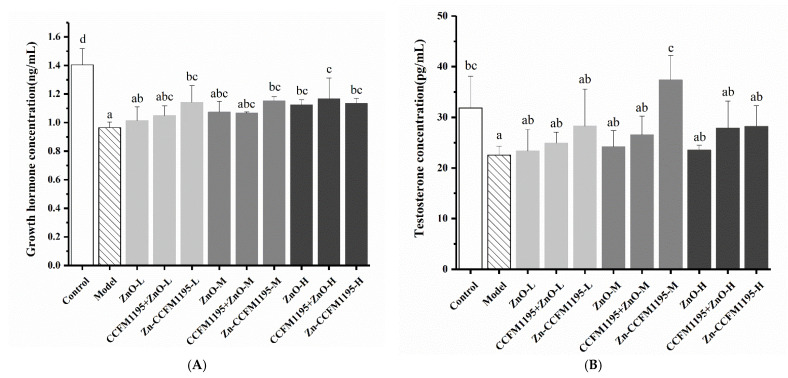
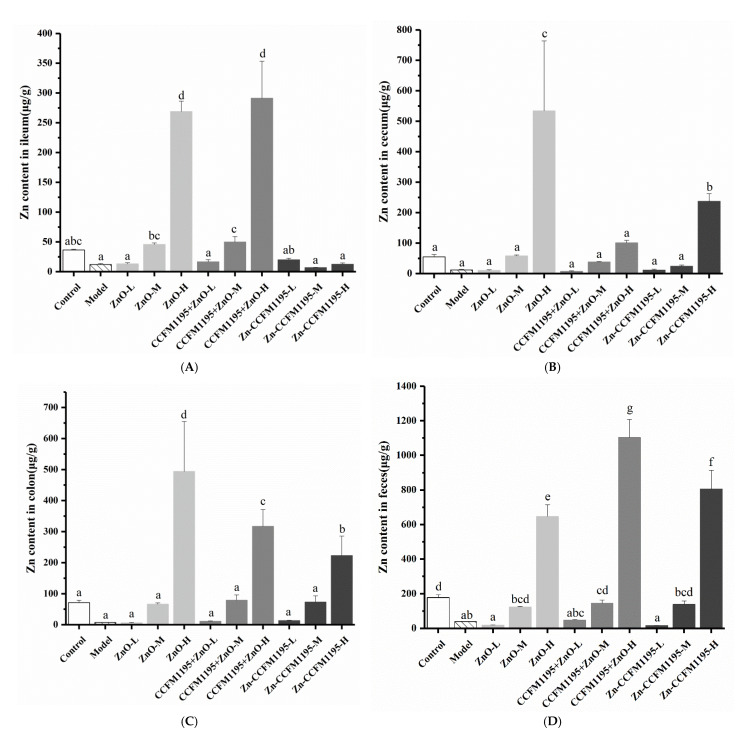
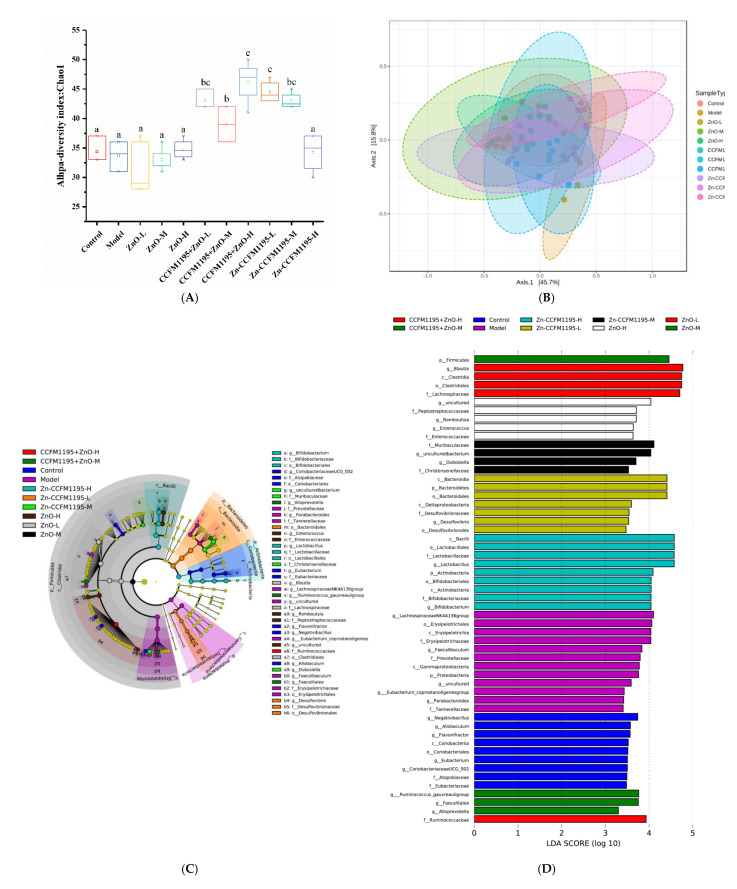
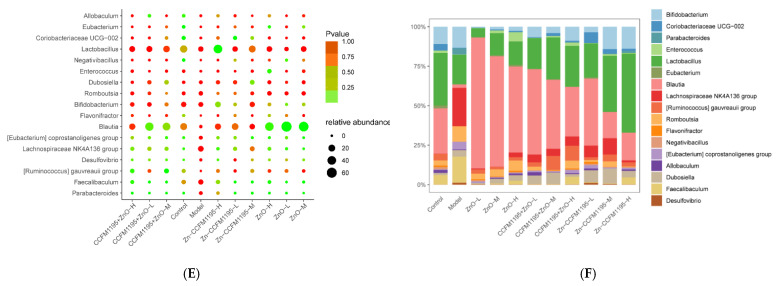
Zn is an essential trace element required for maintaining normal growth and development. Zn deficiency can cause growth retardation and reproductive system dysplasia, while Zn supplementation for treating Zn deficiency requires the use of high-quality Zn preparations. In this study, Bifidobacterium longum CCFM1195 was screened for its high Zn enrichment capacity, and the effects of different Zn supplementation regimens and doses on the growth and development of rats after Zn supplementation were investigated by supplementing Zn-deficient rat pups with different doses of various Zn supplements (ZnO, CCFM1195 + ZnO, and Zn-enriched CCFM1195). It was shown that the bioavailability of Zn was positively correlated with indicators of recovery after Zn supplementation, with Zn-enriched CCFM1195 having the best effect, followed by CCFM1195 + ZnO, while ZnO had the worst effect. Significant differences were also observed between the gut microbiota of control, model, and Zn-supplemented rats. Overall, administration of Zn-enriched CCFM1195 was more effective than the other approaches in restoring physical indicators of Zn deficiency after Zn supplementation, and this advantage was more significant at low-dose Zn supplementation.
Keywords: Zn; Zn-enriched Bifidobacterium longum; growth and reproduction development; gut microbiota.
Conflict of interest statement
The author declares no conflict of interest.
Figures

Similar articles
-
Zinc-Enriched Bifidobacterium longum subsp. longum CCFM1195 Alleviates Cutibacterium acnes-Induced Skin Lesions in Mice by Mitigating Inflammatory Responses and Oxidative Stress.Nutrients. 2025 May 26;17(11):1803. doi: 10.3390/nu17111803. Nutrients. 2025. PMID: 40507073 Free PMC article.
-
Selenium-enriched Bifidobacterium longum DD98 attenuates irinotecan-induced intestinal and hepatic toxicity in vitro and in vivo.Biomed Pharmacother. 2021 Nov;143:112192. doi: 10.1016/j.biopha.2021.112192. Epub 2021 Sep 25. Biomed Pharmacother. 2021. PMID: 34649340
-
Bifidobacterium longum supplementation improves age-related delays in fracture repair.Aging Cell. 2023 Apr;22(4):e13786. doi: 10.1111/acel.13786. Epub 2023 Jan 27. Aging Cell. 2023. PMID: 36704918 Free PMC article.
-
Gut Microbiota as a Mediator of Essential and Toxic Effects of Zinc in the Intestines and Other Tissues.Int J Mol Sci. 2021 Dec 3;22(23):13074. doi: 10.3390/ijms222313074. Int J Mol Sci. 2021. PMID: 34884881 Free PMC article. Review.
-
Bifidobacterium Longum: Protection against Inflammatory Bowel Disease.J Immunol Res. 2021 Jul 23;2021:8030297. doi: 10.1155/2021/8030297. eCollection 2021. J Immunol Res. 2021. PMID: 34337079 Free PMC article. Review.
Cited by
-
Zinc-Enriched Bifidobacterium longum subsp. longum CCFM1195 Alleviates Cutibacterium acnes-Induced Skin Lesions in Mice by Mitigating Inflammatory Responses and Oxidative Stress.Nutrients. 2025 May 26;17(11):1803. doi: 10.3390/nu17111803. Nutrients. 2025. PMID: 40507073 Free PMC article.
-
Enterococcus faecium GEFA01 alleviates hypercholesterolemia by promoting reverse cholesterol transportation via modulating the gut microbiota-SCFA axis.Front Nutr. 2022 Nov 8;9:1020734. doi: 10.3389/fnut.2022.1020734. eCollection 2022. Front Nutr. 2022. PMID: 36424921 Free PMC article.
-
"Protective effects of artichoke extract and Bifidobacterium longum on male infertility in diabetic rats".Biochem Biophys Rep. 2024 Sep 23;40:101834. doi: 10.1016/j.bbrep.2024.101834. eCollection 2024 Dec. Biochem Biophys Rep. 2024. PMID: 39386078 Free PMC article.
-
Gut Microbiota Modulation by Selenium and Zinc Enrichment Postbiotic on Dysbiosis Associated with Hypertension.Curr Vasc Pharmacol. 2024;22(5):365-374. doi: 10.2174/0115701611290537240509061549. Curr Vasc Pharmacol. 2024. PMID: 38779729
References
-
- Caulfield L.E., Black R.E. Zinc Deficiency. In: Ezzati M., Lopez A.D., Rodgers A., Murray C.J., editors. Comparative Quantification of Health Risks: Global and Regional Burden of Disease Attributable to Selected Major Risk Factors. Vol. 1. World Health Organization; Geneva, Switzerland: 2004. pp. 257–279.
-
- Nriagu J. Zinc deficiency in human health. Encycl. Environ. Health. 2011:789–800. doi: 10.1016/b978-0-444-52272-6.00674-7. - DOI
MeSH terms
Substances
Grants and funding
LinkOut - more resources
Full Text Sources
Other Literature Sources
