Review
. 2022 Feb 18;14(4):862.
doi: 10.3390/nu14040862.

What Is the Evidence That Dietary Macronutrient Composition Influences Exercise Performance? A Narrative Review

Affiliations
Review

What Is the Evidence That Dietary Macronutrient Composition Influences Exercise Performance? A Narrative Review

Timothy David Noakes. Nutrients. .

Abstract

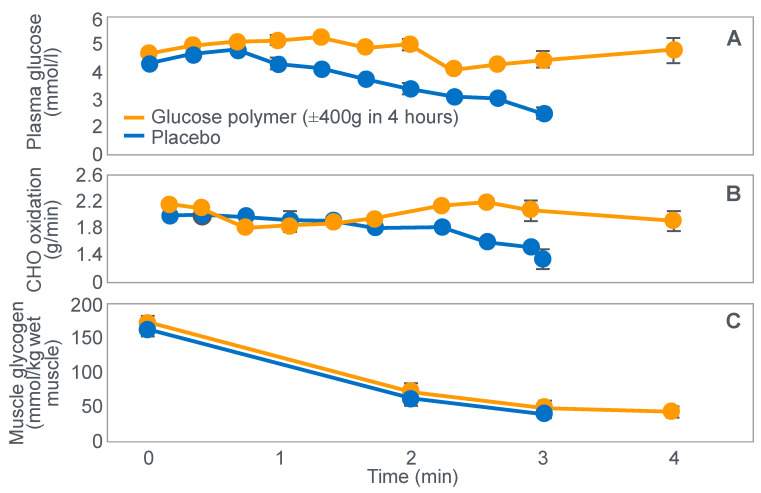
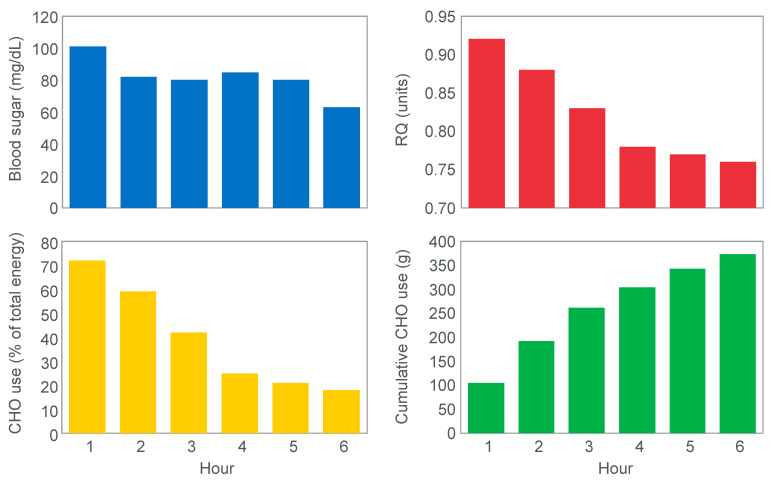
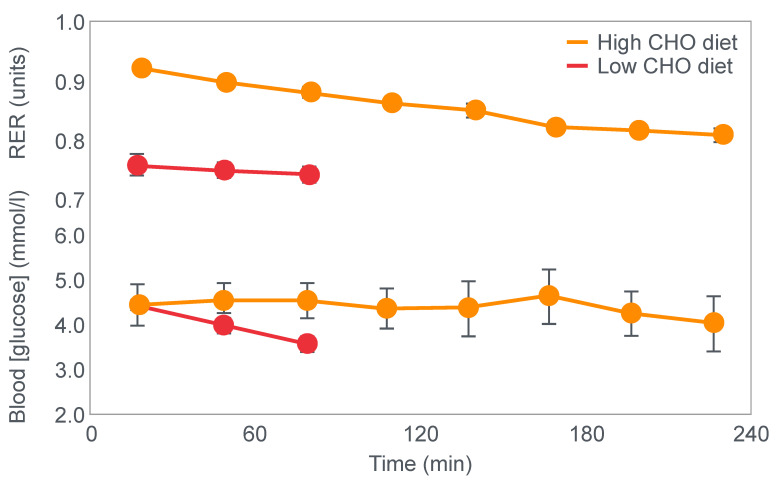
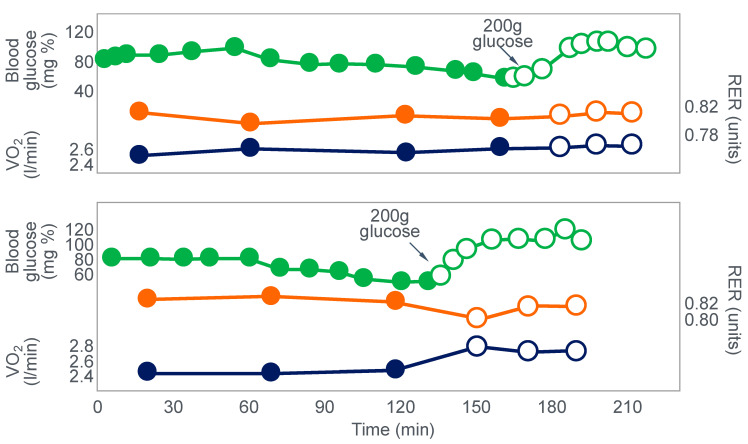
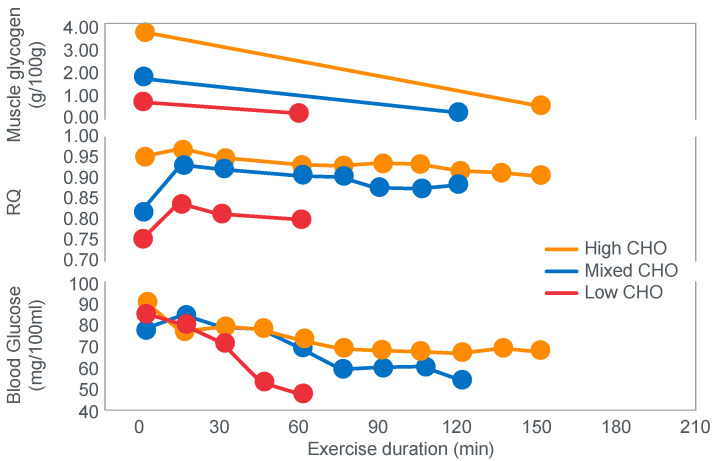
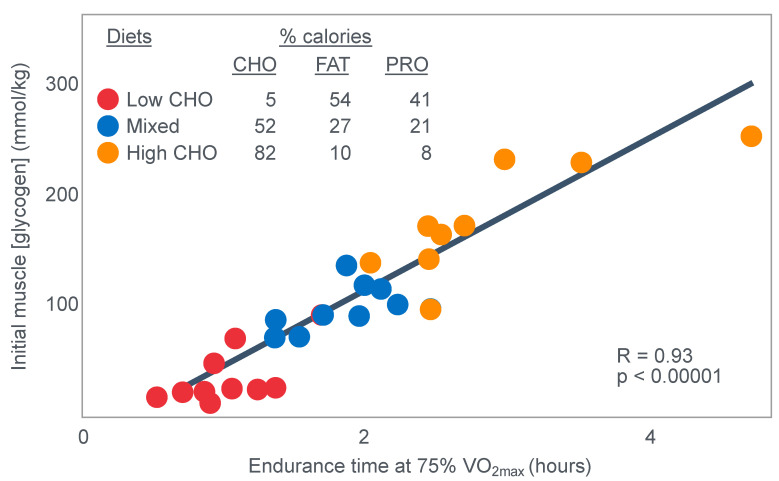
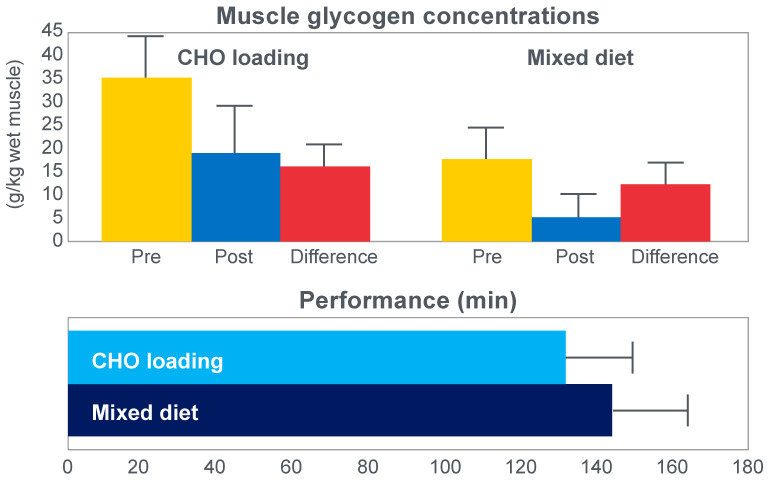
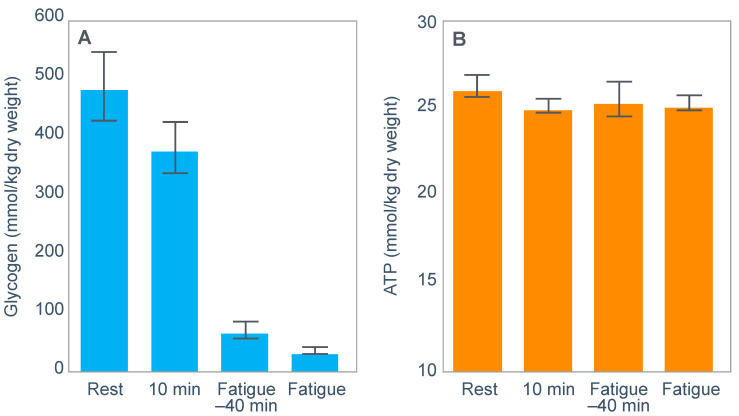
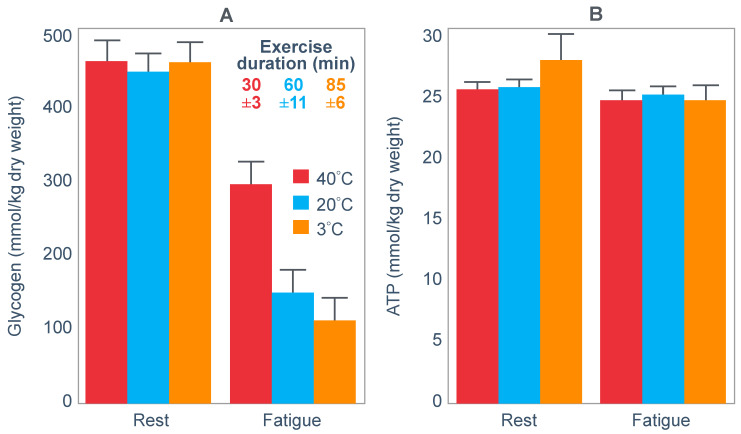
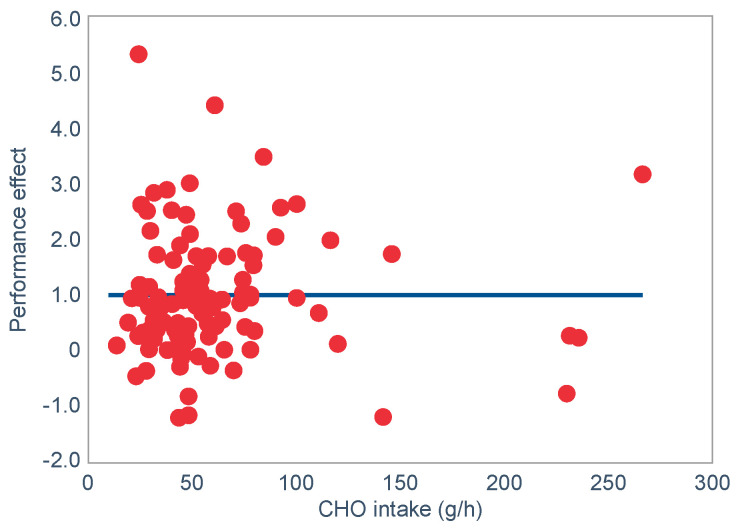
The introduction of the needle muscle biopsy technique in the 1960s allowed muscle tissue to be sampled from exercising humans for the first time. The finding that muscle glycogen content reached low levels at exhaustion suggested that the metabolic cause of fatigue during prolonged exercise had been discovered. A special pre-exercise diet that maximized pre-exercise muscle glycogen storage also increased time to fatigue during prolonged exercise. The logical conclusion was that the athlete's pre-exercise muscle glycogen content is the single most important acutely modifiable determinant of endurance capacity. Muscle biochemists proposed that skeletal muscle has an obligatory dependence on high rates of muscle glycogen/carbohydrate oxidation, especially during high intensity or prolonged exercise. Without this obligatory carbohydrate oxidation from muscle glycogen, optimum muscle metabolism cannot be sustained; fatigue develops and exercise performance is impaired. As plausible as this explanation may appear, it has never been proven. Here, I propose an alternate explanation. All the original studies overlooked one crucial finding, specifically that not only were muscle glycogen concentrations low at exhaustion in all trials, but hypoglycemia was also always present. Here, I provide the historical and modern evidence showing that the blood glucose concentration-reflecting the liver glycogen rather than the muscle glycogen content-is the homeostatically-regulated (protected) variable that drives the metabolic response to prolonged exercise. If this is so, nutritional interventions that enhance exercise performance, especially during prolonged exercise, will be those that assist the body in its efforts to maintain the blood glucose concentration within the normal range.

Keywords: carbohydrates; diet; endurance; fatigue; fats; hypoglycaemia; liver glycogen; muscle glycogen.


Conflict of interest statement

The author declares that he has no conflict of interest. Although he writes and has written books promoting the low-carbohydrate diet, all proceeds from those publications are donated to his Non-Profit Organization, The Noakes Foundation. In the past, he received funding from commercial companies to research the effects of carbohydrate ingestion and high-carbohydrate diets on athletic performance, which ceased more than 15 years ago. He did not personally benefit financially from such funding. Author royalties from his other books, Lore of Running (2002) and Waterlogged: The Serious Problem of Overhydration in Endurance Sports (2011), are donated to the Tim and Marilyn Sports Science Research Trust that funds a post-doctoral scholarship for academic work in sport and health promotion.

Figures

Figure 10
Figure 10
Changes in plasma glucose concentrations (panel A), rates of carbohydrate (CHO) oxidation (panel B) and muscle glycogen concentrations (panel C) during prolonged exercise when subjects ingested either placebo or 100 g of carbohydrate every hour during exercise. Subjects began the trial after a 16 h fasting period. Adapted with permission from ref. [49]. Copy-right 1986 American Physiological Society.
Figure 1
Figure 1
Changes in metabolic variables during 6 h of exercise in Runner Y. Reproduced from data in [12].
Figure 2
Figure 2
Changes in respiratory exchange ratio (RER) and blood glucose concentrations during prolonged exercise following high- and low-carbohydrate diets. Adapted with permission from ref. [14]. Copy-right 1939 Acta Physiologica (John Wiley and Sons).
Figure 3
Figure 3
Effect on blood glucose concentrations, oxygen consumption (VO2) and respiratory exchange ratio (RER) of ingestion of 200 g of glucose at point of exhaustion in two athletes. Adapted with permission from ref. [14]. Copy-right 1939 Acta Physiologica (John Wiley and Sons).
Figure 4
Figure 4
Changes in muscle glycogen concentrations, Respiratory Quotient (RQ) and blood glucose concentrations in subjects after acute adaptation to either high, mixed or low-carbohydrate diets. Adapted with permission from ref. [17]. Copy-right 1967 Acta Physiologica (John Wiley and Sons).
Figure 5
Figure 5
Relationship between initial muscle glycogen concentrations and exercise duration at 75%VO2max in subjects acutely adapted to high-, mixed- and low-carbohydrate diets. Adapted with permission from ref. [17]. Copy-right 1967 Acta Physiologica (John Wiley and Sons).
Figure 6
Figure 6
Changes in muscle glycogen concentrations and in running performances in athletes completing two 30 km races after high- (carbohydrate (CHO) loading) and mixed- carbohydrate diets. Drawn from data in [19].
Figure 7
Figure 7
The time differences at 8 checkpoints when the same athletes ran two 30 km races after high- and mixed-carbohydrate diets. All athletes ran slower after the mixed-carbohydrate diet. Arrows indicate the point in the race at which athletes who started the race with low muscle glycogen concentrations, because they had eaten the mixed-carbohydrate diet, were predicted to have reached ‘limiting’ low muscle glycogen concentrations. Adapted with permission from ref. [19]. Copy-right 1971 American Physiological Society.
Figure 8
Figure 8
Changes in respiratory exchange ratio (RER) (panel A) and in plasma glucose concentrations (panel C) in athletes during an initial bout of 180 min of exercise (Exercise Bout 1) that induced profound hypoglycemia in all the athletes. (Panels B,D) show changes in these variables in three groups of athletes who received either a placebo or carbohydrate by mouth, or a continuous glucose infusion during Exercise Bout 2 that followed 20 min after the conclusion of Exercise Bout 1. Adapted with permission from ref. [27]. Copy-right 1987 American Physiological Society.
Figure 9
Figure 9
From [46]. Specialized brain areas in the hypothalamus and brain stem (AP, area postrema; ARC, arcuate nucleus; BLM, basolateral medulla; DMN, dorsomedial nucleus; DMNX, dorsal motor nucleus of the vagus; LH, lateral hypothalamus; NTS, nucleus of the solitary tract; PNS, parasympathetic nervous system; PVN, paraventricular nucleus; SNS, sympathetic nervous system; VMH, ventromedial hypothalamus) sense peripheral metabolic signals through hormones and nutrients to regulate whole body glucose metabolism. The autonomic nervous system contributes by modulating pancreatic insulin/glucagon secretion, hepatic glucose production and skeletal muscle glucose uptake. During exercise, the major threat to blood glucose homeostasis is the rate of blood glucose uptake by the exercising muscles. It therefore makes sense that the hypothalamic regulators of blood glucose homeostasis must also influence the degree of motor unit recruitment that is allowed in the exercising limbs, specifically to ensure that hypoglycaemic brain damage does not occur during especially prolonged exercise. Adapted, modified and redrawn from the original in [46] with the addition of the action of the hypothalamic → motor cortex → spinal cord → peripheral nerve → skeletal muscle homeostatic reflex control.
Figure 11
Figure 11
Changes in plasma glucose (panel A) and plasma insulin concentrations (panel B), in rates of carbohydrate oxidation (panel C) and in muscle glycogen concentration before and after exercise, including muscle glycogen change (panel D), in athletes who exercised for 120 min with or without a glucose infusion that produced profound hyperglycemia. Note that unlike the response shown in Figure 10, subjects in this study did not develop hypoglycemia during the control condition even though they had fasted for 12–14 h before exercise but had eaten a high-carbohydrate diet. Adapted with permission from ref. [64]. Copy-right 1991 American Physiological Society.
Figure 12
Figure 12
If an inability to generate sufficient ATP in the exercising muscles was the key factor ‘limiting’ exercise performance during prolonged exercise then, in this unregulated system, the sole outcome would always be the development of skeletal muscle rigor. Since skeletal muscle rigor does not happen during any form of exercise, skeletal muscle function (and metabolism) must be homeostatically regulated, specifically to prevent this catastrophic outcome.
Figure 13
Figure 13
Muscle glycogen concentrations (panel A) were reduced during exercise, reaching very low levels at fatigue. Yet muscle ATP concentrations (panel B) remained at pre-exercise resting concentrations during exercise and at the point of fatigue. The total adenine nucleotide pool (TAN) was also not reduced at fatigue. Adapted with permission from ref. [99]. Copy-right Year 2003 American Physiological Society.
Figure 14
Figure 14
Although muscle glycogen concentrations (panel A) were reduced during exercise, they were not similar at the point of exercise termination in three different conditions of external heat (40, 30 and 3 °C). At the point of fatigue, muscle ATP concentrations (panel B) were not different from pre-exercise resting concentrations in all three conditions. Adapted with permission from ref. [101]. Copy-right 1999 Acta Physiologica Scandinavica.
Figure 15
Figure 15
Changes in calculated glycogenolytic rates (panel A), substrate phosphorylation (panel B), and PDHa concentration (panel C) during exercise at 70%VO2max and after a 1 min sprint at 150% peak power output (PPO) in subjects following short-term adaptation to high-carbohydrate or high-fat diets. Exercise performance during the self-paced time trial at ~90%VO2max—time to complete the time trial; mean power and % PPO was not influenced by the diet (panel D). Adapted with permission from ref. [43]. Copy-right 2006 American Physiological Society.
Figure 16
Figure 16
The extent of motor unit recruitment in the muscles in the exercising limbs determines the athlete’s exercise intensity. This also determines the metabolic response within those muscles. Thus, the most appropriate method to protect the muscles from a catastrophic metabolic outcome (Figure 12) is to regulate the number of motor units that are allowed to be activated in the muscles in the exercising limbs. This model therefore predicts that if the ability to generate ATP in the exercising limbs is restrained (‘limited’) for any reason, the immediate response of the central nervous system will be to reduce the number of motor units it chooses to recruit in those active muscles. This will ensure that homeostasis is maintained. Note this diagram suggests that exercise terminates only after muscle glycogen is completely depleted. In fact, the central governor ensures that exercise always terminates before this point is reached.
Figure 17
Figure 17
Power outputs measured in a series of 1 and 4 km sprints during a 100 km cycling time trial in the laboratory, fell progressively. This reduction could be due either to mechanisms present in the exercising muscles (peripheral fatigue) or the result of reduced motor unit recruitment in the exercising muscles by the motor cortex in the brain (central regulation).
Figure 18
Figure 18
Equivalent and progressive reductions in power output and electromyographic activity in the exercising leg muscles during five 1 km sprint during a 100 km cycling time trial in the laboratory. This indicates the presence of a centrally-regulated homeostatic control that progressively reduces motor unit recruitment in the exercising limbs during prolonged exercise. This shows that performance is ‘regulated’, not ‘limited’ during exercise [11]. Adapted with permission from ref. [110]. Copy-right 2001 American Physiological Society.
Figure 19
Figure 19
Ratings of perceived exertion (RPE) rose as a linear function of absolute exercise durations in the study of Baldwin et al. [42] in subjects who began exercise with either low or high muscle glycogen content (panel A). When the same data are expressed as a function of relative (%) time, (panel B) the lines overlap. Thus, the RPE rises as a linear function of the expected duration of the exercise that is being performed. Adapted with permission from ref. [116]. Copy-right Year 2004 American Physiological Society.
Figure 20
Figure 20
Power outputs (panel A) and serum glucose concentrations (panel B) in subjects performing a 70 km cycling trial under four different conditions of starting muscle glycogen contents (high or low) and ingestion during exercise (placebo or 9% carbohydrate solution). Adapted with permission from ref. [71]. Copy-right Year 1993 American Physiological Society.
Figure 21
Figure 21
Changes in plasma glucose concentrations (panel A) and in rates of carbohydrate oxidation (panel B) when subjects drank either placebo or one of four different carbohydrate solutions with different carbohydrate concentrations (6, 12 or 18%). CHO-12C and CHO-12I refer to trials that were conducted continuously (C) or intermittently (I). Adapted with permission from ref. [51]. Copy-right 1989 American Physiological Society.
Figure 22
Figure 22
Changes in running speeds (panels A,B) and in blood glucose concentrations (panels C,D) in subjects running a 30 km time trial before (panels A,C) and after (panels B,D) 7 days of ‘carbohydrate loading’. ‘Carbohydrate loading’ prevented the development of hypoglycemia during the final 10 km of the race (panel D) and was associated with better maintenance of running speed (panel B). Adapted with permission from ref. [72]. Copy-right 1992 Springer Nature (European Journal of Applied Physiology).
Figure 23
Figure 23
Changes in plasma glucose (panel A) and muscle glycogen concentrations (panel B) in subjects performing prolonged exercise with either carbohydrate (CHO) or placebo (CON) ingestion during exercise. Adapted with permission from ref. [57]. Copy-right 1999 American Physiological Society.
Figure 24
Figure 24
Changes in plasma insulin (panel A) and plasma glucose (panel B) concentrations; average work rate (panel C) and rates of carbohydrate oxidation (panel D) when subjects ingested either carbohydrate (C), carbohydrate plus medium chain triglycerides (C + MCT) or a sweetened placebo (P) during a 100 km cycling time trial in the laboratory. Note: In the original diagrams, it is not possible in some panels to distinguish between lines drawn for the C and C + M groups as the lines appear to be incorrectly labelled. However, the lines are largely overlapping. Adapted with permission from ref. [69]. Copy-right 2000 American Physiological Society.
Figure 25
Figure 25
Times (panels A,C) and power outputs (panels B,D) in 4 km (panels A,B) and 1 km sprints (panels C,D) interspersed within a 100 km cycling time trial were not different when subjects had undergone pre-exercise ‘carbohydrate loading’ with either real carbohydrates or a placebo. Adapted with permission from ref. [120]. Copy-right 2000. American Physiological Society.
Figure 26
Figure 26
Changes in arterial blood glucose (panel A) concentrations, arteriovenous glucose differences across the brain (panel B) and ratings of perceived exertion (panel C) in subjects when they ingested placebo or glucose during 180 min of exercise. Adapted with permission from ref. [123]. Copy-right 2003 Acta Physiologica (John Wiley and Sons).
Figure 27
Figure 27
Power outputs during either 1 or 4 km sprints interspersed within a 100 km laboratory cycling time trial when athletes ate either the low-carbohydrate or high-carbohydrate diets for six days followed by a single day of ‘carbohydrate loading’. Adapted with permission from ref. [104]. Copy-right 2006 American Physiological Society.
Figure 28
Figure 28
Rates of carbohydrate (panel A) and fat oxidation (panel B) measured at 1, 13 and 25 km in race walkers during two 25 km time trials before and after they had adapted to one of three different dietary options—high-carbohydrate diet; a periodized carbohydrate diet; and a low-carbohydrate high-fat diet. Adapted with permission from ref. [134]. Copy-right 2017 The Physiological Society (John Wiley and Sons).
Figure 29
Figure 29
The absence of any relationship between the amount of carbohydrate ingested per hour during exercise and any measured performance benefit. Adapted with permission from ref. [139]. Copy-right 2010 Springer Nature.

References

    1. Krogh A. A gas analysis apparatus accurate to 0.001% mainly designed for respiratory exchange work. Biochem. J. 1920;14:267–281. doi: 10.1042/bj0140267. - DOI - PMC - PubMed
    1. Krogh A., Lindhard J. The relative value of fat and carbohydrate as sources of muscular energy. Biochem. J. 1920;14:290–363. doi: 10.1042/bj0140290. - DOI - PMC - PubMed
    1. Hawley J.A., Maughan R.J., Hargreaves M. Exercise metabolism: Historical Perspective. Cell Metab. 2015;22:12–17. doi: 10.1016/j.cmet.2015.06.016. - DOI - PubMed
    1. Cathcart E.P. The influence of muscle work on protein metabolism. Physiol. Rev. 1925;5:225–243. doi: 10.1152/physrev.1925.5.2.225. - DOI
    1. Hill A.V., Long C.H.N., Lupton H. Muscular exercise, lactic acid and the supply and utilisation of oxygen: Parts VII–VIII. Proc. R. Soc. Lond. B Biol. Sci. 1924;97:155–176.