. 2022 Feb 19;14(4):877.
doi: 10.3390/nu14040877.

The Influence of Roux-en-Y Gastric Bypass and Diet on NaCl and Sucrose Taste Detection Thresholds and Number of Circumvallate and Fungiform Taste Buds in Female Rats

Affiliations

The Influence of Roux-en-Y Gastric Bypass and Diet on NaCl and Sucrose Taste Detection Thresholds and Number of Circumvallate and Fungiform Taste Buds in Female Rats

Kellie M Hyde et al. Nutrients. .

Abstract

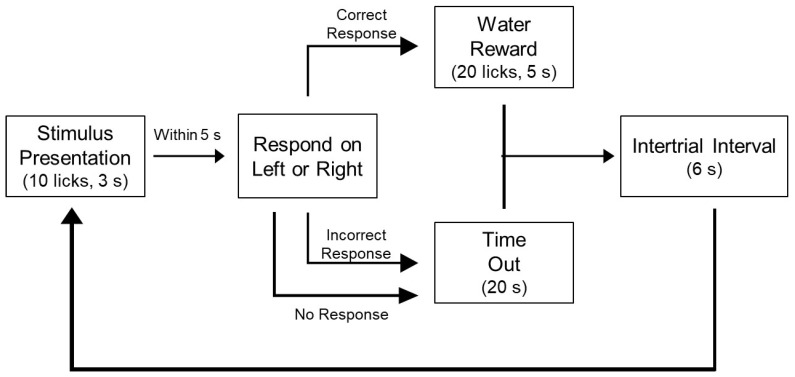
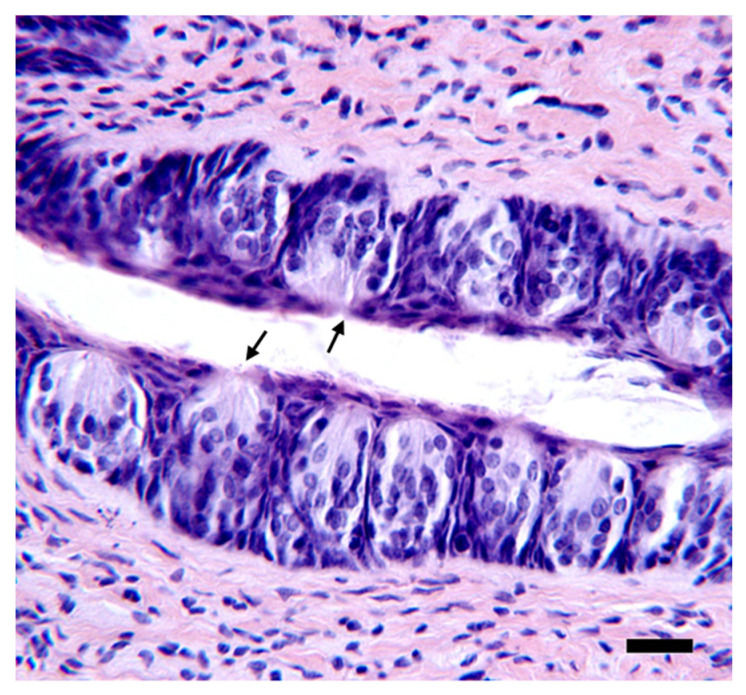
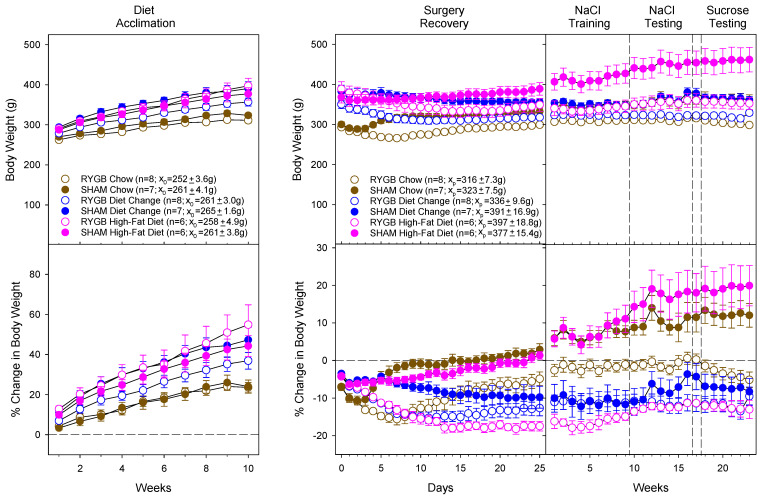
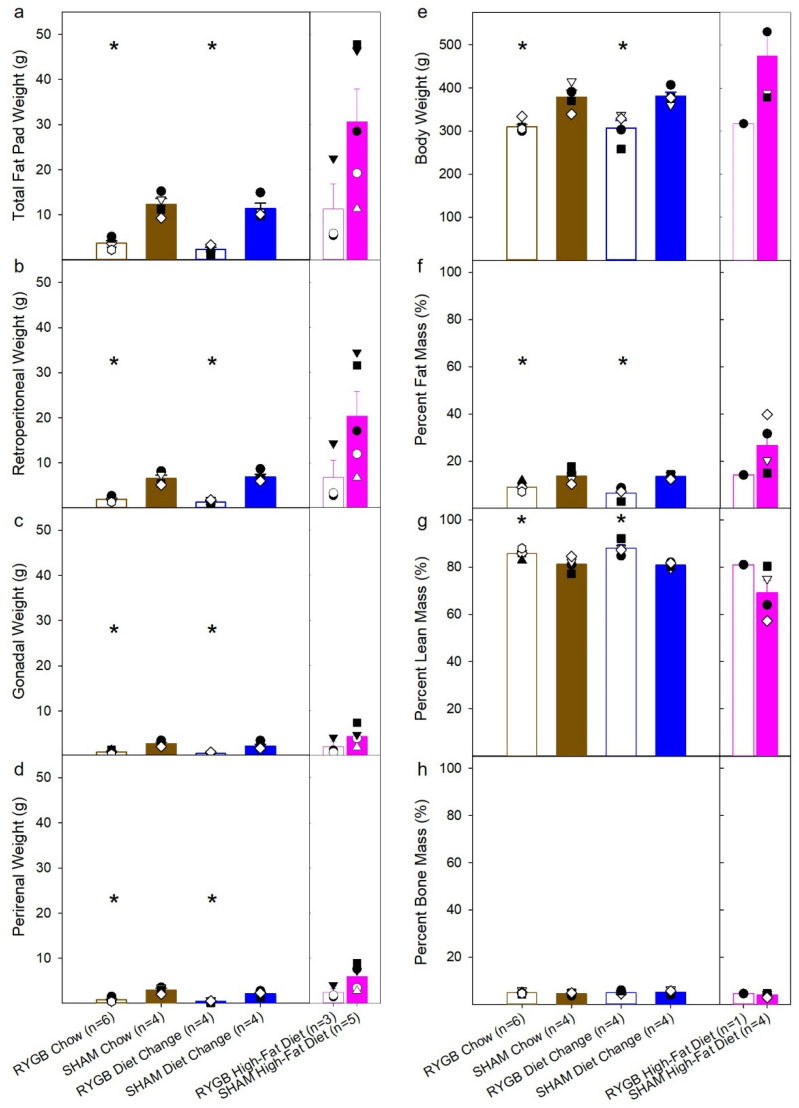
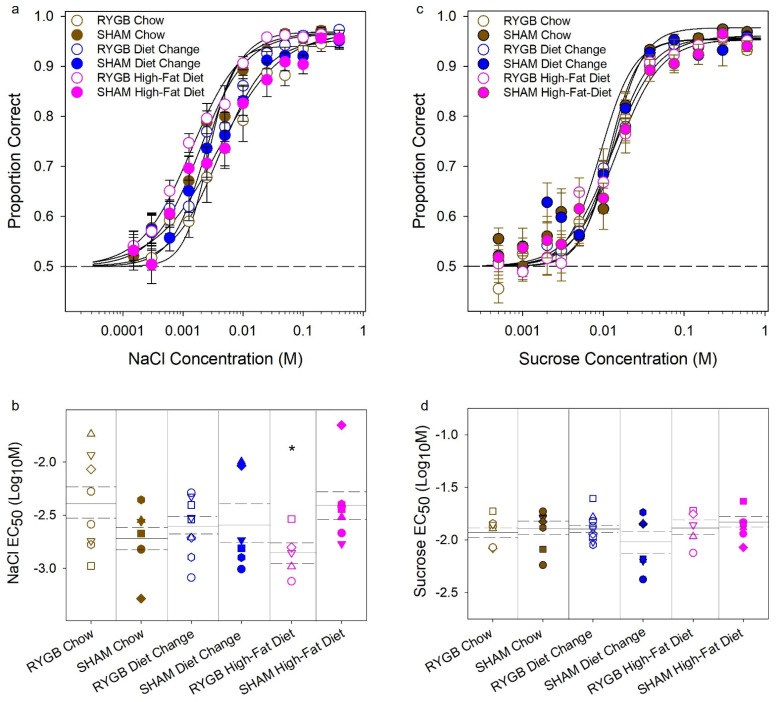
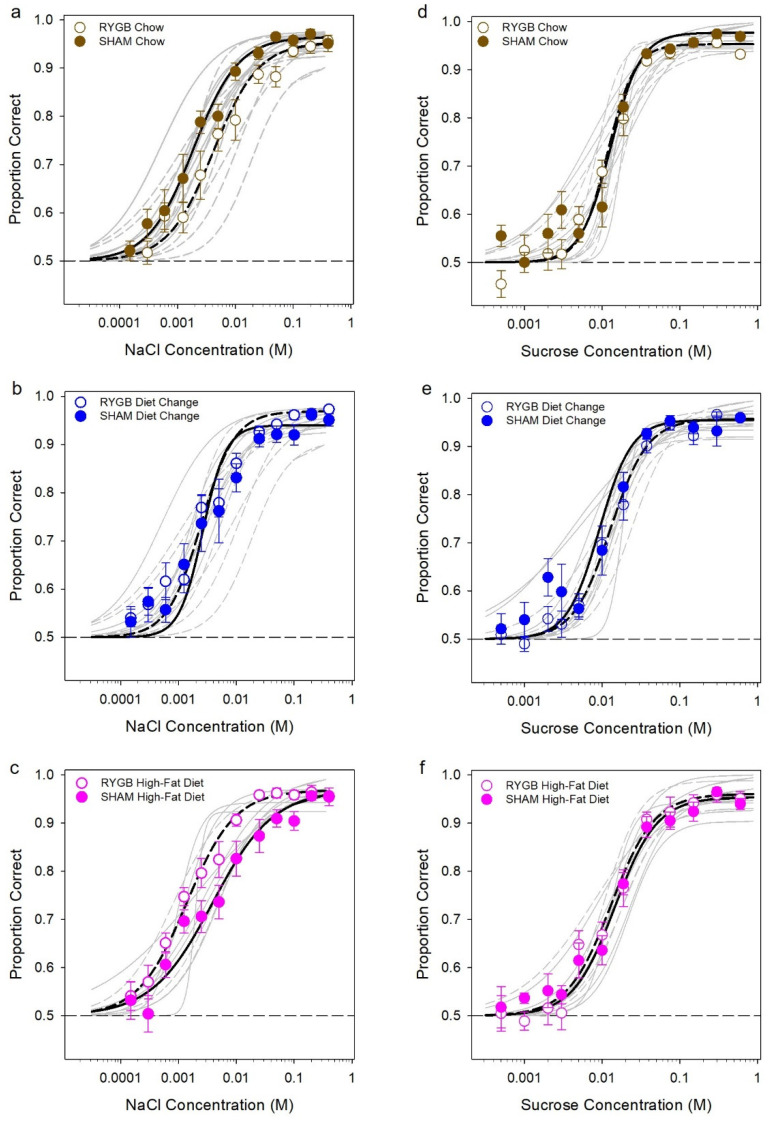
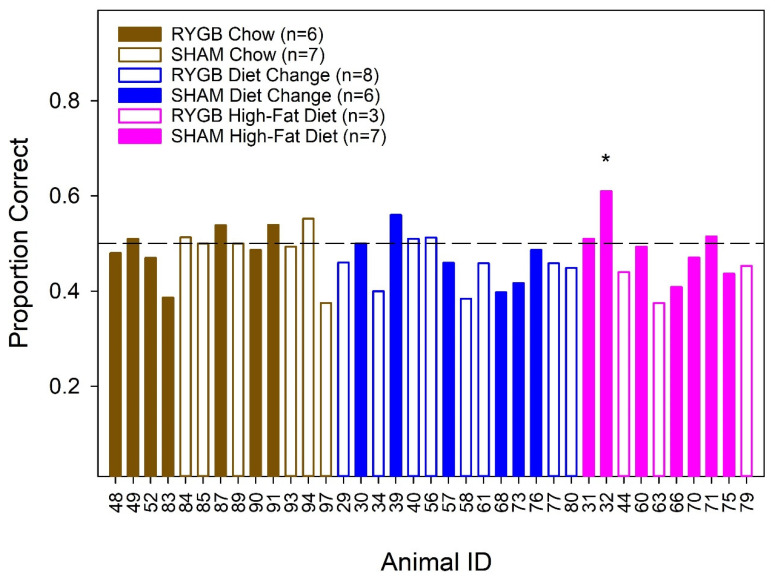
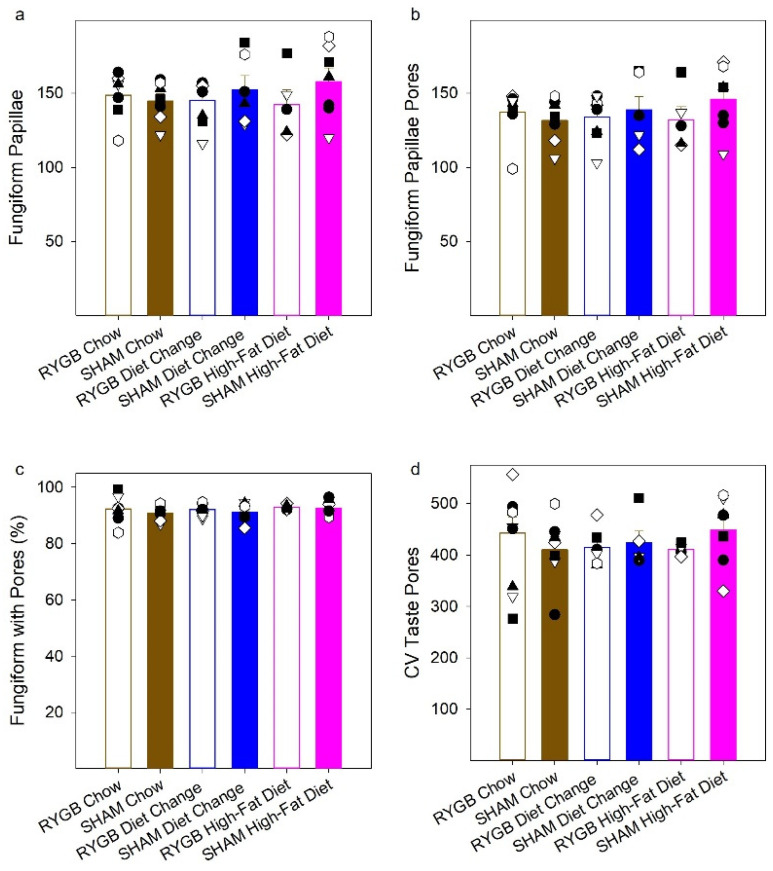
Roux-en-Y gastric bypass (RYGB) in rats attenuates preference for, and intake of, sugar solutions. Additionally, maintenance on a high-fat diet (HFD) reportedly alters behavioral responsiveness to sucrose in rodents in short-term drinking tests. Due to the fact that the behavioral tests to date rely on the hedonic value of the stimulus to drive responsiveness, we sought to determine whether taste detection thresholds to sucrose and NaCl are affected by these manipulations as measured in an operant two-response signal detection paradigm. Female rats were maintained on HFD or chow for 10 weeks, at which point animals received either RYGB or SHAM surgery followed by a gel-based diet and then powdered chow. Upon recovery, half of the rats that were previously on HFD were switched permanently to chow, and the other rats were maintained on their presurgical diets (n = 5-9/diet condition × surgery group for behavioral testing). The rats were then trained and tested in a gustometer. There was a significant interaction between diet condition and surgery on NaCl threshold that was attributable to a lower value in RYGB vs. SHAM rats in the HFD condition, but this failed to survive a Bonferroni correction. Importantly, there were no effects of diet condition or surgery on sucrose thresholds. Additionally, although recent evidence suggests that maintenance on HFD alters taste bud number in the circumvallate papillae (CV) of mice, in a subset of rats, we did not find that diet significantly influenced taste pores in the anterior tongue or CV of female rats. These results suggest that any changes in sucrose responsiveness in intake/preference or hedonically oriented tests in rats as a function of HFD maintenance or RYGB are not attributable to alterations in taste sensitivity.

Keywords: Roux-en-Y gastric bypass; bariatric surgery; gustatory system; high-fat diet; rat; taste; taste pores; taste sensitivity; taste thresholds.


Conflict of interest statement

The authors declare no conflict of interest.

Figures

Figure 1
Figure 1
Flowchart of trial parameters. Once a trial had begun, animals had to sample the stimulus and very quickly decide on which side to respond. If they were correct, they received a water reward; if they were incorrect or did not respond, they received a timeout.
Figure 2
Figure 2
Representative image of CV Slice. A representative image showing the morphology of a pore (black arrows). Photomicrograph adjusted for brightness and contrast. Scale bar represents 25 µm.
Figure 3
Figure 3
Mean (±SE, standard error) of body weight (top panels) and percentage change in body weight (bottom panels) of female rats during each of the critical periods. For the left panels, the mean body weight for each diet group on the first day of diet acclimation served as baseline (x0; mean ± SE; left) for percentage change analysis during the Diet Acclimation period. Week 1 reflects the change in body weight from the first day of the diet acclimation period. In the right panels, mean body weight on the day before surgery served as baseline (xp; mean ± SE; right) for percentage change comparisons for the remainder of the experiment. Day 0 reflects the food-deprived body weight of animals on the day of surgery. RYGB animals are represented by open circles and SHAMs by filled circles. Brown symbols represent the Chow group; blue, the diet change; pink, the high-fat diet.
Figure 4
Figure 4
Mean (± SE, standard error) and individual animal data for total fat pad weight (a) and weights of the retroperitoneal (b), gonadal (c), and perirenal fat pads (d); the mean (± SE) of the body weight on the day of the EchoMRI scan (e); and the percent fat (f), lean (g), and bone (h) mass from the animals in Phase 2. Diet groups are represented as brown for the Chow group; blue, the diet change; pink, the high-fat diet. RYGB group means within each diet condition are represented by open bars, SHAM by filled bars. Due to low group size, the HFD RYGB group could not be included in the statistical analyses and is represented in a separate panel along with its sham-operated control group, which was included in some analyses. Significant differences from paired comparisons (that survived Bonferroni corrections) between the surgical groups within a diet are represented with “*”.
Figure 5
Figure 5
Mean (± SE) proportion correct as a function of stimulus concentration for NaCl (a) and sucrose (c) for each of the groups. Curve fits reflect group averages for individual data based on the 3-parameter logistic function described in Data Analysis. Individual EC50 values for NaCl (b) and sucrose (d) were also calculated using this logistics function. Means for each diet condition are noted by the solid line; SE, dashed lines. RYGB animals are represented by open circles and SHAMs by filled circles. Brown symbols represent the Chow group; blue, the diet change; pink, the high-fat diet. “*” reflects a significant effect of surgery within a given diet condition as assessed by paired comparison; no comparisons survived Bonferroni corrections.
Figure 6
Figure 6
The effect of surgery for each diet condition. Mean (±SE, standard error) proportion correct as a function of stimulus concentration for NaCl (ac) and sucrose (df); Chow groups in the top row, DC in the middle row, and HFD in the bottom row. Solid line on curve fits reflects group averages; the grey lines are for individual data based on the 3-parameter logistic function described in Data Analysis. RYGB animals are represented by open circles and dashed lines and SHAMs by filled circles and solid lines. The horizontal dashed line represents chance performance in this task.
Figure 7
Figure 7
Individual animal performance from the stimulus control test. Filled bars reflect SHAM females and open bars represent the RYGB animals. Brown shading or outlining represent the Chow group; blue, the Diet Change; pink, the High-Fat Diet. One-tailed binomial analyses were used to test for differences greater than chance, represented as significant by “*”. Although the performance of Rat 32 was significantly greater than chance, it was quite poor, and the difference did not survive Bonferroni correction. The horizontal dashed line represents chance performance in this task.
Figure 8
Figure 8
Histological analyses. Mean (± SE) and individual number of fungiform papillae (a), number of taste pores in the anterior tongue (b), percent of fungiform papillae that had a taste pore (c), and number of taste pores in the circumvallate papillae (d). RYGB groups are in open bars, SHAMs, in filled. Diet groups are represented as brown for the Chow group; blue, the diet change; pink, the high-fat diet.
Figure 9
Figure 9
Terminal meal and hormone analyses. Mean (±SE, standard error) of the body weight on test day (a), total caloric intake (b), postprandial GLP-1 response (c), and plasma leptin levels (d). Significant differences between SHAM groups found from uncorrected paired comparisons are reflected by different black letters above the bars; “*” represents differences between surgical groups in a given diet condition. There were no differences among the SHAM diet conditions for GLP-1 (c); differences between total meal intake (b) in the Chow and DC SHAM groups did not survive Bonferroni corrections; surgical differences between the DC group for GLP-1 (c) and leptin (d) levels did not survive corrections. RYGB groups are in open bars, SHAMS in filled. Diet groups are represented as brown for the Chow group; blue, the diet change; pink, the high-fat diet.

Similar articles

Cited by

References

    1. Kershaw J.C., Mattes R.D. Nutrition and taste and smell dysfunction. World J. Otorhinolaryngol. Head Neck Surg. 2018;4:3–10. doi: 10.1016/j.wjorl.2018.02.006. - DOI - PMC - PubMed
    1. Kourouniotis S., Keast R.S.J., Riddell L.J., Lacy K., Thorpe M.G., Cicerale S. The importance of taste on dietary choice, behaviour and intake in a group of young adults. Appetite. 2016;103:1–7. doi: 10.1016/j.appet.2016.03.015. - DOI - PubMed
    1. Spector A.C. Linking gustatory neurobiology to behavior in vertebrates. Neurosci. Biobehav. Rev. 2000;24:391–416. doi: 10.1016/S0149-7634(00)00013-0. - DOI - PubMed
    1. Spector A.C., Glendinning J.I. Linking Peripheral Taste Processes to Behavior. Curr. Opin. Neurobiol. 2009;19:370–377. doi: 10.1016/j.conb.2009.07.014. - DOI - PMC - PubMed
    1. Fock K.M., Khoo J. Diet and exercise in management of obesity and overweight. J. Gastroenterol. Hepatol. 2013;28:59–63. doi: 10.1111/jgh.12407. - DOI - PubMed