. 2022 Feb 13;14(4):722.
doi: 10.3390/polym14040722.

Noninvasive Detection, Tracking, and Characterization of Aerogel Implants Using Diagnostic Ultrasound

Affiliations

Noninvasive Detection, Tracking, and Characterization of Aerogel Implants Using Diagnostic Ultrasound

Sagar Ghimire et al. Polymers (Basel). .

Abstract

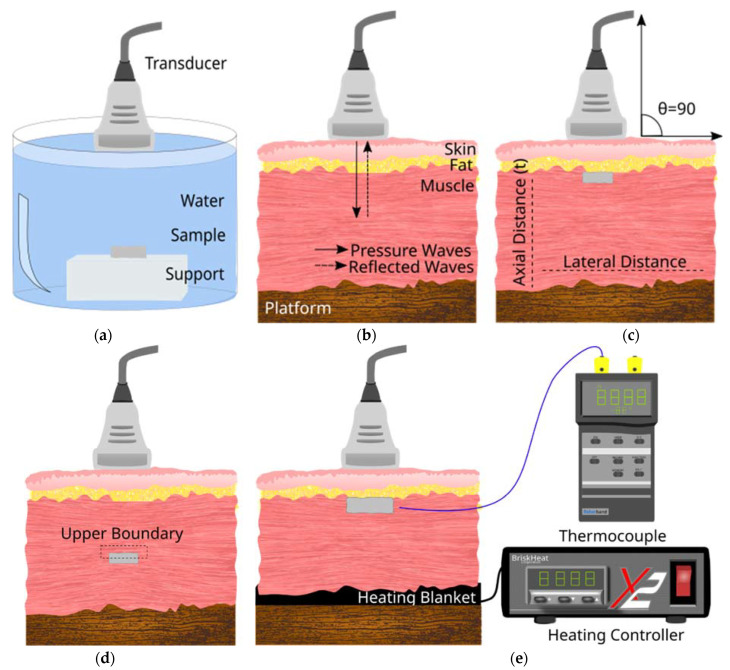
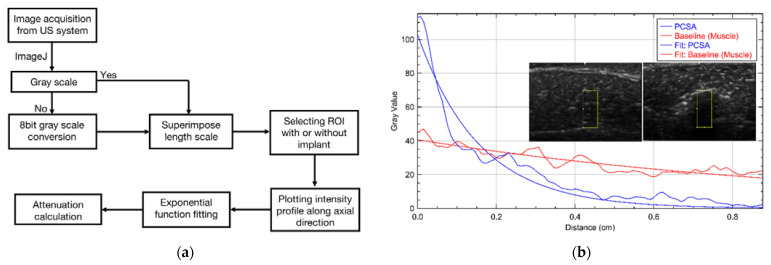
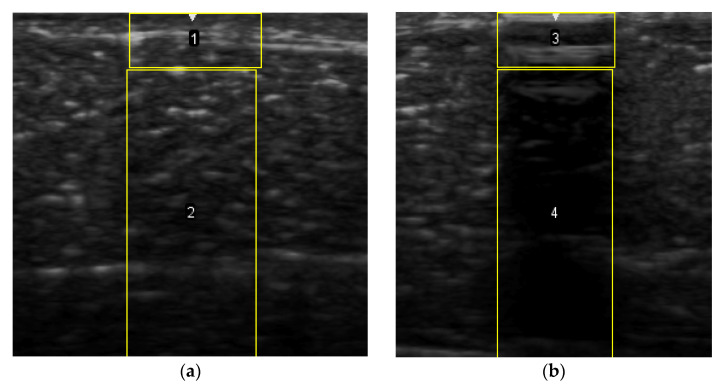
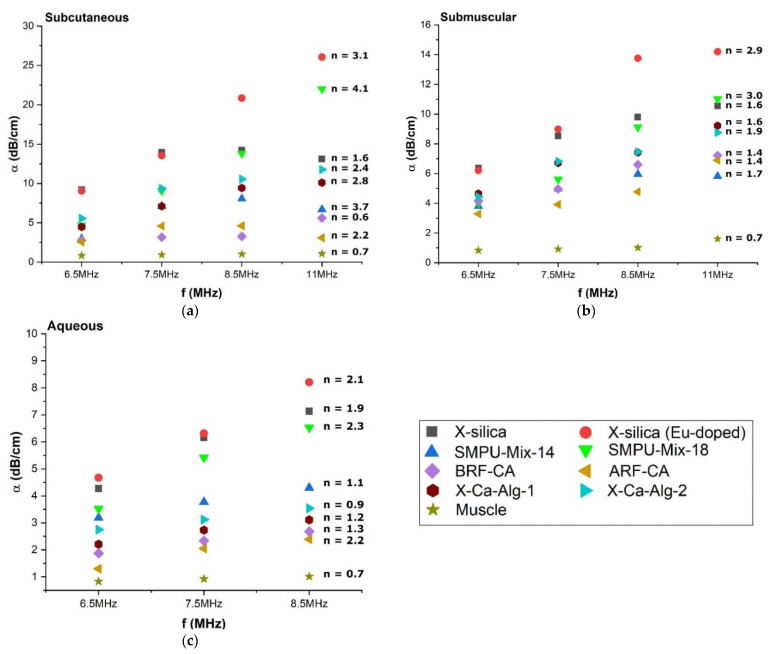
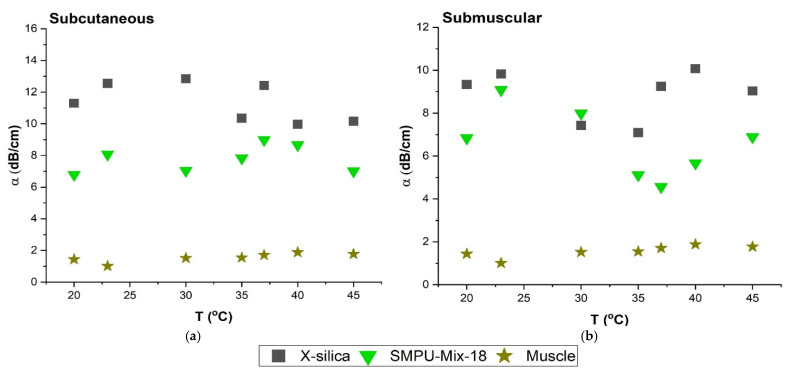
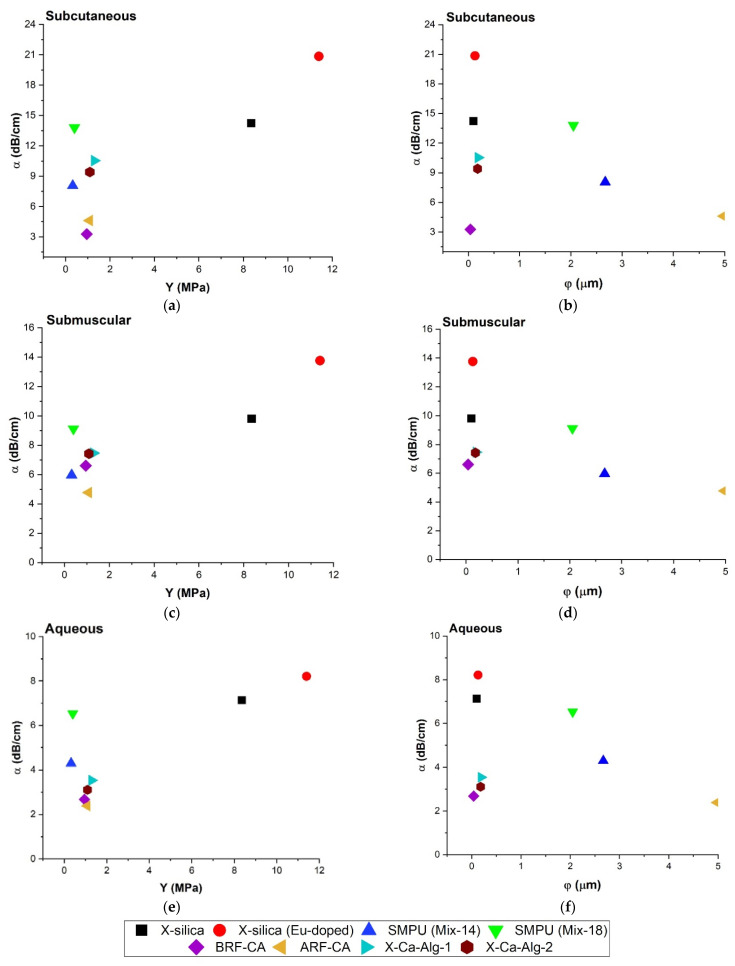
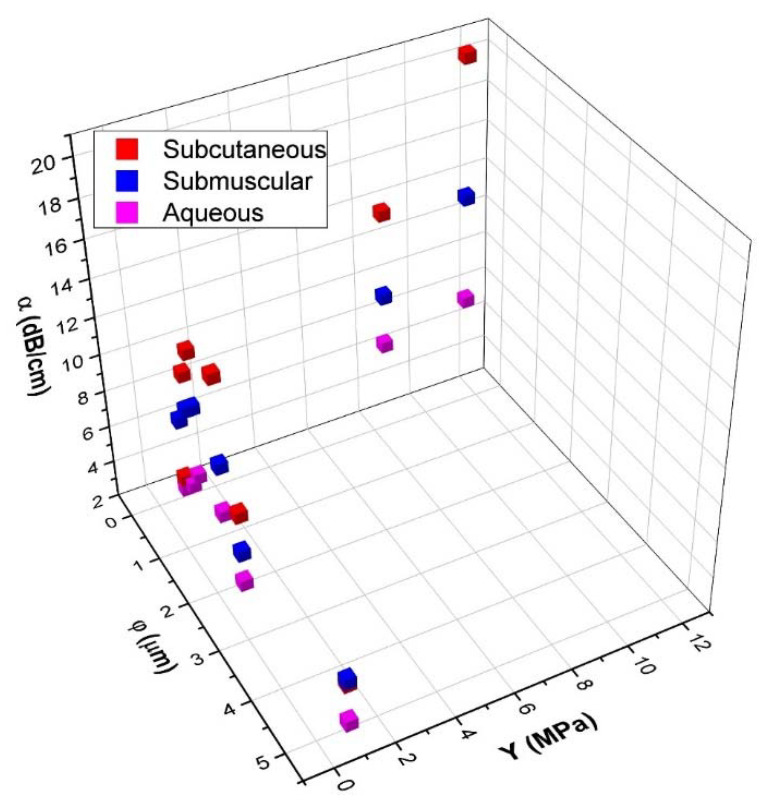
Medical implants are routinely tracked and monitored using different techniques, such as MRI, X-ray, and ultrasound. Due to the need for ionizing radiation, the two former methods pose a significant risk to tissue. Ultrasound imaging, however, is non-invasive and presents no known risk to human tissue. Aerogels are an emerging material with great potential in biomedical implants. While qualitative observation of ultrasound images by experts can already provide a lot of information about the implants and the surrounding structures, this paper describes the development and study of two simple B-Mode image analysis techniques based on attenuation measurements and echogenicity comparisons, which can further enhance the study of the biological tissues and implants, especially of different types of biocompatible aerogels.

Keywords: B-mode; acoustic attenuation; aerogel; ultrasound.


Conflict of interest statement

The authors declare no conflict of interest.

Figures

Figure 1
Figure 1
Schematic diagram of the cross-section view of the different configurations used for diagnostic US imaging of aerogel. (a) Aerogel samples were tested in an Aq environment by placing them on top of sample support. (b) Configuration used to image the tissue without any implants. This served as the baseline for image analysis. Continuous arrows show pressure waves propagating and though the tissue and implant. Discontinuous arrows show reflected pressure waves from the Z difference within the tissue and implant area. (c) Configuration where implant insertion is SC (d) Configuration where implant insertion is SM. (e) Configuration with temperature controlling heating blanket and thermocouple for US imaging at different temperatures. The angle of scan was maintained at 90° that corresponds to the 0° in US device settings.
Figure 2
Figure 2
(a) Flowchart showing the attenuation analysis procedure used in this study. US images were exported to ImageJ (NIH open-source software) to scale the measurements, selecting the region of interest (ROI) and exponentially fitting the intensity profile at 6.5 MHz frequency. (b) Representation of exponential fit of selected ROI of two different B-mode images of baseline (left) and PCSA (right) at 6.5 MHz frequency.
Figure 3
Figure 3
(a) Selection of ROI-1 and ROI-2 in the B-mode image of the muscle without implants. (b) Selection of ROI-3 and ROI-4 in the B-mode image with aerogel implants.
Figure 4
Figure 4
(a) Correlation between impedance values and sound speed for each type of aerogel used in this study. (b) Impedance as a function of Young’s modulus for all the aerogels used in the experiment. Both (a,b) represent data in an Aq environment.
Figure 5
Figure 5
Attenuation versus frequency plot for three different environments, (a) Subcutaneous (b) Submuscular and (c) Aqueous. The attenuation coefficient dependence can be seen from the graphs above, α = αοfn.
Figure 6
Figure 6
Comparison of attenuation coefficient (α) at temperature range of 20–45 °C at 6.5 MHz. (a) α in SC region (b) α in SM region. Temperature range is consistent with small fluctuations.
Figure 7
Figure 7
Comparison of attenuation coefficient (α) at 8.5 MHz, Young’s modulus (Y), and Pore diameter (φ) for all three configurations; Aq environment samples inserted SC and SM measured at a scan frequency of 8.5 MHz. (a) α vs. Y in SC region, (b) α vs. φ in SC region, (c) α vs. Y in SM region, and (d) α vs. φ in SM region. (e,f) represent α vs. Y and α vs. φ respectively in an Aq environment.
Figure 8
Figure 8
Comparison of attenuation coefficient (α) at 8.5 MHz, Young’s modulus (Y) and pore-diameter (φ) for SC, SM, and Aq implants.
Figure 9
Figure 9
Comparison of attenuation coefficient (α) at 8.5 MHz and acoustic impedance (Z) for all three configurations; (a) SC, (b) SM, and (c) Aq environment.
Figure 9
Figure 9
Comparison of attenuation coefficient (α) at 8.5 MHz and acoustic impedance (Z) for all three configurations; (a) SC, (b) SM, and (c) Aq environment.
Figure 10
Figure 10
Echogenicity of the aerogels at 8.5 MHz tabulated according to the classifications indicated in Table 3: (a) SC and (b) SM compared to control, calculated using Equation (4a,b), Table 2.

Similar articles

Cited by

References

    1. Naumova A.V., Modo M., Moore A., Murry C.E., Frank J.A. Clinical Imaging in Regenerative Medicine. Nat. Biotechnol. 2015;32:804–818. doi: 10.1038/nbt.2993. - DOI - PMC - PubMed
    1. Berry D.B., Englund E.K., Chen S., Frank L.R., Ward S.R. Medical Imaging of Tissue Engineering and regenerative medicine constructus. Biomater. Sci. 2021;9:301–314. doi: 10.1039/D0BM00705F. - DOI - PMC - PubMed
    1. Solorio L., Babin B.M., Patel R.B., Mach J., Exner A.A. Noninvasive Characterization of In situ Forming Implants Using Diagnostic Ultrasound. J. Control. Release. 2010;143:186–190. doi: 10.1016/j.jconrel.2010.01.001. - DOI - PMC - PubMed
    1. Ashokkumbar M. The characterization of acoustic cavitation bubbles–An overview. Ultrason. Sonochem. 2011;18:864–872. doi: 10.1016/j.ultsonch.2010.11.016. - DOI - PubMed
    1. Maulik D. Doppler Ultrasound in Obstetrics and Gynecology. Springer; Berlin, Germany: 2005. Biological safety of diagnostic sonography; pp. 9–111. - DOI

LinkOut - more resources