. 2022 Feb 18;14(4):797.
doi: 10.3390/polym14040797.

Translocation, Rejection and Trapping of Polyampholytes

Affiliations

Translocation, Rejection and Trapping of Polyampholytes

Yeong-Beom Kim et al. Polymers (Basel). .

Abstract

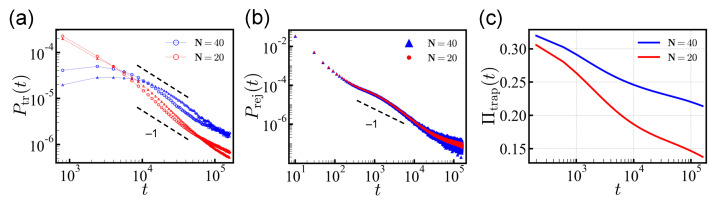
Polyampholytes (PA) are a special class of polymers comprising both positive and negative monomers along their sequence. Most proteins have positive and negative residues and are PAs. Proteins have a well-defined sequence while synthetic PAs have a random charge sequence. We investigated the translocation behavior of random polyampholyte chains through a pore under the action of an electric field by means of Monte Carlo simulations. The simulations incorporated a realistic translocation potential profile along an extended asymmetric pore and translocation was studied for both directions of engagement. The study was conducted from the perspective of statistics for disordered systems. The translocation behavior (translocation vs. rejection) was recorded for all 220 sequences comprised of N = 20 charged monomers. The results were compared with those for 107 random sequences of N = 40 to better demonstrate asymptotic laws. At early times, rejection was mainly controlled by the charge sequence of the head part, but late translocation/rejection was governed by the escape from a trapped state over an antagonistic barrier built up along the sequence. The probability distribution of translocation times from all successful attempts revealed a power-law tail. At finite times, there was a population of trapped sequences that relaxed very slowly (logarithmically) with time. If a subensemble of sequences with prescribed net charge was considered the power-law decay was steeper for a more favorable net charge. Our findings were rationalized by theoretical arguments developed for long chains. We also provided operational criteria for the translocation behavior of a sequence, explaining the selection by the translocation process. From the perspective of protein translocation, our findings can help rationalize the behavior of intrinsically disordered proteins (IDPs), which can be modeled as polyampholytes. Most IDP sequences have a strong net charge favoring translocation. Even for sequences with those large net charges, the translocation times remained very dispersed and the translocation was highly sequence-selective.

Keywords: Monte Carlo simulation; drift-diffusion; polyampholytes; probability distribution function; translocation.


Conflict of interest statement

The authors declare no conflict of interest.

Figures

Figure 1
Figure 1
(a) Schematic representation of an α-hemolysin pore. The mushroom-shaped complex is approximately 10 nm long. The colored patches represent charged regions inside the pore, a positively charged cis protrusion and a negatively charged trans edge. (b) Translocation free energy (top) and corresponding translocation force (bottom) for small ions, K+ (red) and Cl (blue), in α-hemolysin, with a transmembrane potential of +150 mV (solid lines) and 150 mV (dashed lines). The potential is in favor of translocation of negative (positive) ions from cis-to-trans (reverse) direction with +150 mV. The free energy values are taken from Figure 7 of Ref. [22] and those values used for the MC simulations are indicated by circles. (c) Schematics showing the initial position of the PA chain in the MC simulation for translocation from the cis to the trans side.
Figure 2
Figure 2
(a) The translocation time distributions for 220 sequences of N = 20. The number of translocated sequences are measured in the time interval [tδt/2, t+δt/2] with δt = 1.6×10³ MCT. The symbols ○ and Δ represent the cis-to-trans and reverse directions, respectively. (b) Distributions of rejection times, measured within the time interval [tδt/2, t+δt/2] with δt = 20 MCT. Dashed lines are guides for the power-law relation, P(t)t1. (c) Logarithmic decay of trapped populations, Πtrap(t), normalized by the total number of translocation trials.
Figure 3
Figure 3
Distributions of translocation times (in the reverse direction) for various Q-ensembles of N = 20. The PDF measures the fraction of translocated sequences at given time interval [tδt/2, t+δt/2] with δt = 1600 MCT for each Q-ensemble. Each distribution is normalized by the total number of successfully translocated sequences with tw = 1.6×10⁵ MCT. Colors from yellow to blue represent charge values of Q = 0, 2, 4, 6, 8, 10, 12 and 14, respectively. The dashed lines are a guide for the eyes indicating power-law relations, P(t)t(1+μ) with μ=0 and 1. For each Q, we indicate the average translocation times ttr by ○. The ttr(Q) decreases with increasing net charges. The square symbols for Q = 6, 8, 10, 12 and 14 represent the average translocation times ttr(Q) with tw = 106 MCT.
Figure 4
Figure 4
The average translocation times ttr in the cis-to-trans (□) and reverse (○) directions as a function of the net charge Q for N = 20. The + symbols represent the standard deviations of the corresponding data. The averages are obtained from the successful translocation trials with waiting times tw=1.6×10⁵ (blue) and 106 (green) MCTs, respectively. The filled symbols (Q>15) indicate the convergence of data independent of the waiting time.
Figure 5
Figure 5
The percentages of translocated/rejected/trapped sequences (in the reverse direction) with tw = 1.6×10⁵ MCT (a) for exactly enumerated N = 20 sequences and (b) for 107 randomly created sequences of N = 40. The top panels show the dependencies on Qh and Q and the bottom panels show the dependencies on Qmin and Q. Color codes are presented in neighboring color bars.
Figure 6
Figure 6
The PDFs of translocation times of PA (sequence (d) in Table 3) and IDP IN sequences (sequence (h) and (i) in Table 3) engaging in the cis-to-trans direction with tw = 1.6×10⁵ MCT. The number of translocated sequences are measured in the time interval [tδt/2, t+δt/2] with δt = 1.0×10³ MCT. The PDFs of sequence (d) and (h) clearly show exponential decay as a function of time.

References

    1. Uversky V.N. Intrinsically disordered proteins from A to Z. Intl. J. Biochem. Cell Biol. 2011;43:1090–1103. doi: 10.1016/j.biocel.2011.04.001. - DOI - PubMed
    1. Müller-Späth S., Soranno A., Hirschfeld V., Hofmann H., Rüegger S., Reymond L., Nettels D., Schuler B. Charge interactions can dominate the dimensions of intrinsically disordered proteins. Proc. Natl. Acad. Sci. USA. 2010;107:14609–14614. doi: 10.1073/pnas.1001743107. - DOI - PMC - PubMed
    1. Bianchi G., Longhi S., Grandori R., Brocca S. Relevance of Electrostatic Charges in Compactness, Aggregation, and Phase Separation of Intrinsically Disordered Proteins. Int. J. Mol. Sci. 2020;21:6208. doi: 10.3390/ijms21176208. - DOI - PMC - PubMed
    1. Sorensen C.S., Kjaergaard M. Effective concentrations enforced by intrinsically disordered linkers are governed by polymer physics. Proc. Natl. Acad. Sci. USA. 2019;116:23124–23131. doi: 10.1073/pnas.1904813116. - DOI - PMC - PubMed
    1. Meller A., Nivon L., Branton D. Voltage-driven DNA translocations through a nanopore. Phys. Rev. Lett. 2001;86:3435. doi: 10.1103/PhysRevLett.86.3435. - DOI - PubMed

LinkOut - more resources