Observational Study
. 2022 Jan 18;14(2):168.
doi: 10.3390/v14020168.

Epstein-Barr Virus (EBV) Genotypes Associated with the Immunopathological Profile of People Living with HIV-1: Immunological Aspects of Primary EBV Infection

Affiliations
Observational Study

Epstein-Barr Virus (EBV) Genotypes Associated with the Immunopathological Profile of People Living with HIV-1: Immunological Aspects of Primary EBV Infection

Leonn Mendes Soares Pereira et al. Viruses. .

Abstract

Background: The aim of the present study was to evaluate the immunological profile of adult HIV-1+ patients coinfected with primary Epstein-Barr virus (EBV) infection who were free of antiretroviral drugs and inhabitants of the Brazilian Amazon region.

Materials and methods: Primary EBV infection was screened by the semiquantitative detection of IgM and IgG anti-VCA. Genotypes were determined by conventional PCR. EBV and HIV viral load (VL) were quantified by real-time PCR. Cytokine dosage and cell quantification were performed by cytometry.

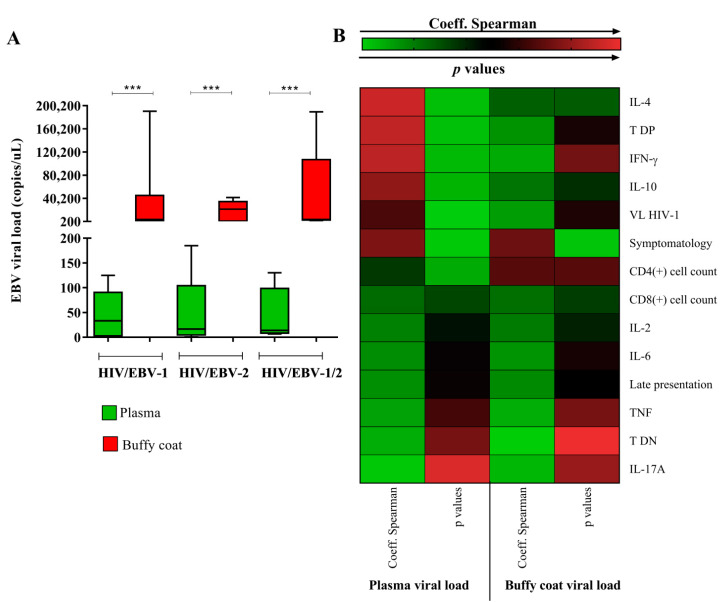
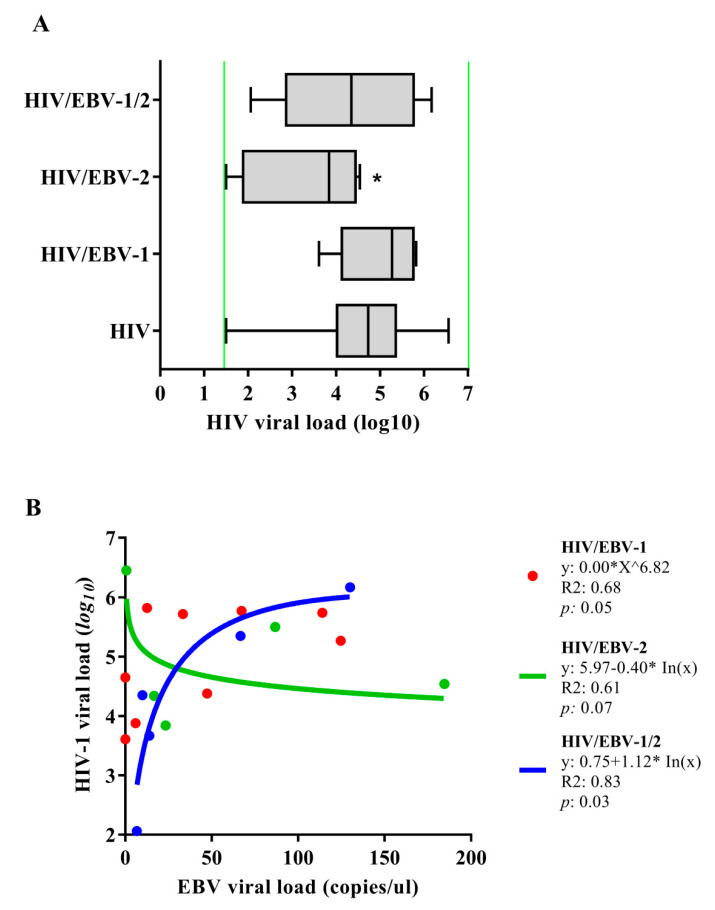
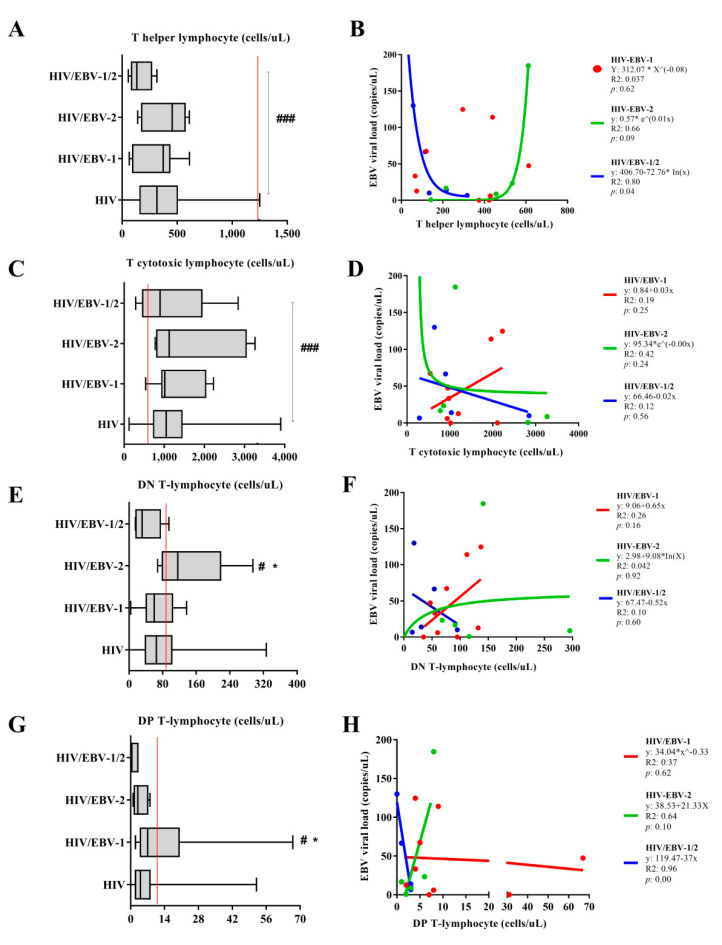
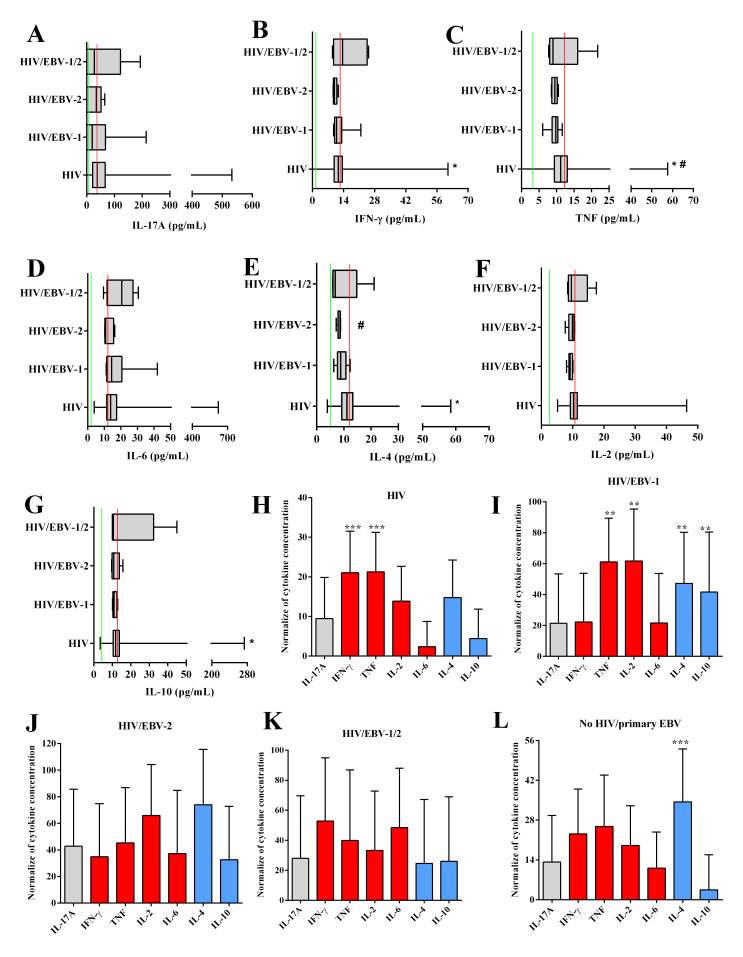
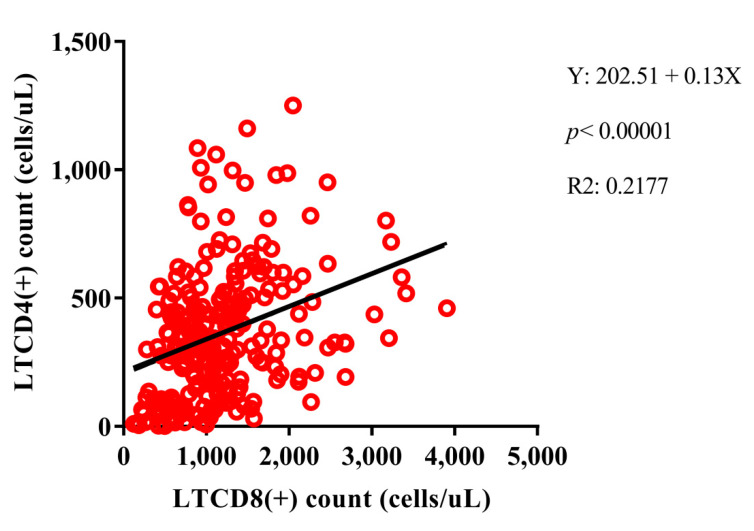
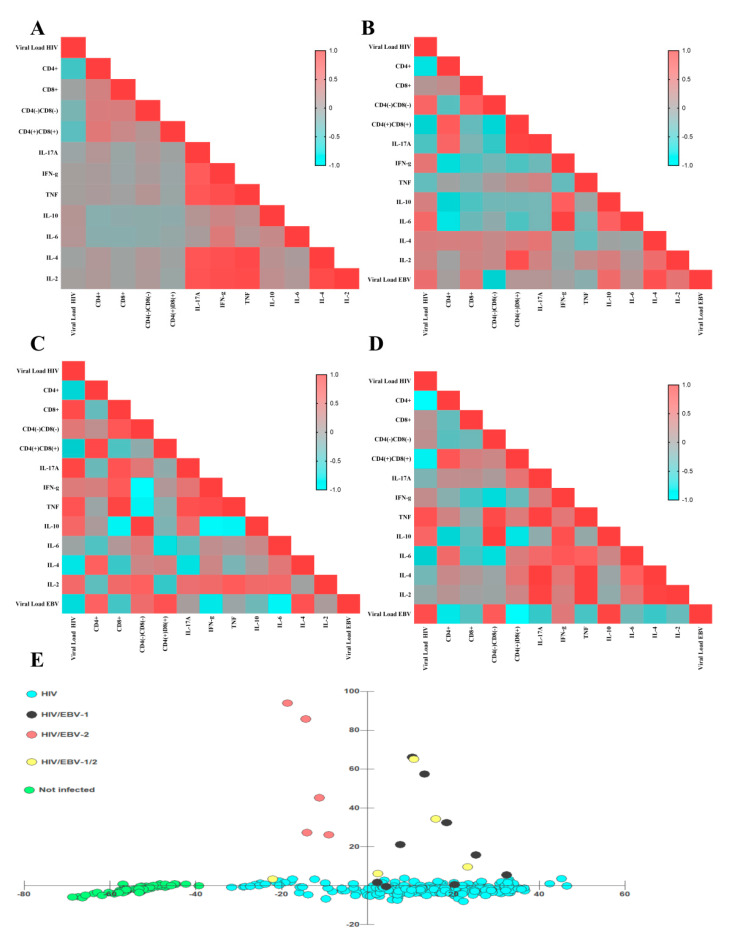
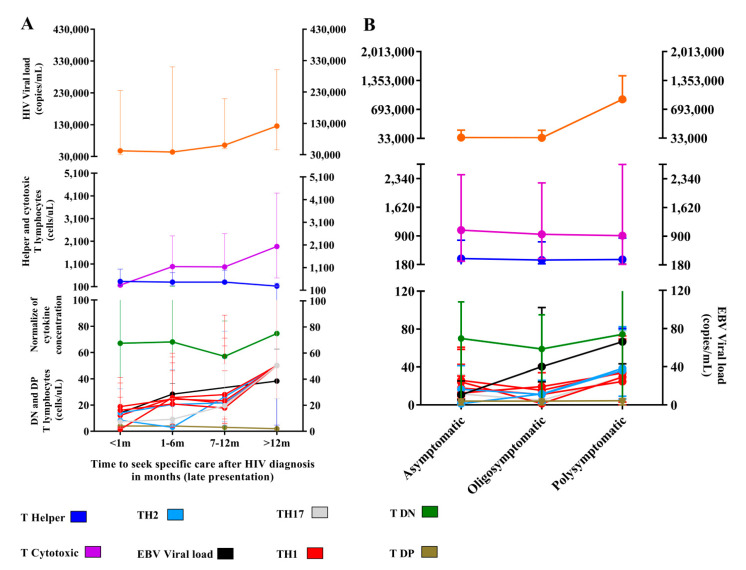
Results: Only HIV-1+ individuals had primary EBV infection (7.12%). The EBV-1 genotype was the most prevalent (47.37%). The VL of HIV-1 was lower in the HIV/EBV-2 group. CD4+ T lymphocytes were inversely proportional to the VL of EBV in HIV/EBV-1/2 multi-infected patients. The HIV/EBV-2 group had the lowest cytokine levels, especially IFN-γ and IL-4. Different correlations were proposed for each coinfection. The late search for specific care related to HIV infection directly affected the cytokine profile and the number of CD8+ T lymphocytes. Symptoms were associated with the increase in VL of both viruses and cytokine profile.

Conclusions: Different immunological profiles were associated with EBV genotypes in primary infection, with EBV-2 being more frequent in patients with low levels of HIV viral load. With late infection monitoring and consequent delay in the initiation of HAART, clinical changes and effects on the maintenance of the immune response were observed.

Keywords: EBV; HIV-1; coinfection; immunopathological profile.


Conflict of interest statement

The authors declare that there were no conflict of interest in conducting this project.

Figures

Figure 1
Figure 1
Analysis of the EBV viral load in different blood extracts. (A) Graph showing the quantification of the EBV viral load in the plasma and buffy coat of the HIV/primary EBV coinfected groups. ***: p < 0.0001. (B) Heatmap illustrating the absolute values of the Spearman coefficient and respective p value for the correlations between the EBV viral load quantified in plasma and in the buffy coat with the other factors studied. The most significant correlations were observed for plasma viral load; in the buffy coat, the viral load was associated only with the patients’ symptoms. The statistical data for each correlation are detailed in Supplementary Table S1.
Figure 2
Figure 2
Quantification of viral load: (A) Quantification of the HIV-1 plasma viral load. Green lines indicate the limits of detection for the assay used (<log1.6 (40 copies)—>log7 (10,000,000 copies)); *: p < 0.05. (B) Regression graph for viral loads of HIV-1 and EBV.
Figure 3
Figure 3
Cell quantification: Box–plots of the quantification of (A) helper, (C) cytotoxic, (E) double-negative, and (G) double–positive T lymphocytes in the studied groups. Red lines indicate the median cell count in no HIV/primary EBV individuals. #: high score in relation to no HIV/primary EBV individuals. *: high count among those infected. ###: p < 0.001; # *: p < 0.05. Cartesian graph of the regression between EBV viral load and the quantification of (B) helper, (D) cytotoxic, (F) double-negative, and (H) double–positive T lymphocytes in the studied groups.
Figure 4
Figure 4
Cytokine levels: Box–plots of the cytokines IL-17A (A), IFN-γ (B), IL-4 (C), TNF (D), IL-6 (E), IL-2 (F), and IL-10 (G). Red lines indicate the median cytokine levels in the no HIV/primary EBV group. Green lines indicate the limit of detection for each cytokine defined by the assay manufacturer (IL-17A: 18.9 pg/mL; IFN-γ: 3.7 pg/mL; IL-4: 4.9 pg/mL; TNF: 3.8 pg/mL; IL-6: 2.4 pg/mL; IL-2: 2.6 pg/mL; IL-10: 4.5 pg/mL). #: different levels compared to the no HIV/primary EBV group. *: different levels among the infected groups. Graph of the comparison of immunological profiles based on the normalized concentration of cytokines evaluated in the HIV (H), HIV/EBV-1 (I), HIV/EBV-2 (J), HIV/EBV-1/2 (K), and no HIV/primary EBV (L) groups. Gray: TH17 cytokines; red: TH1 cytokines; blue: TH2 cytokines. *: p < 0.05; **: 0.005 > p > 0.001; ***: p < 0.001.
Figure 5
Figure 5
Positive linear regression model between helper T lymphocyte (LTCD4+) and cytotoxic T lymphocyte (LTCD8+) counts among PLHIV no primary EBV infection.
Figure 6
Figure 6
Matrix of correlations and clusters. (AD) Heatmap graphs illustrating the Pearson coefficient of each analyzed correlation between immunological and virological factors for different groups: (A) PLHIV no primary EBV infection; (B) HIV/EBV-1; (C) HIV/EBV-2; (D) HIV/EBV-1/2. The color spectrum varies from blue (negative correlations) to red (positive correlations), as per the legend in the figures. (E) Discriminant dispersion diagram of the studied groups based on their immunological and viral load profiles. The HIV/EBV-2 group did not overlap with the coinfected cluster.
Figure 7
Figure 7
Time of seeking specific care and symptomatology: (A) Graph of the evaluation of immunological markers and viral load after different delays in attendance. In total, 129 patients with immediate attendance (<1 m), 105 patients with attendance between 1 to 6 months (1–6 m), 32 patients with attendance between 7 to 12 months (7–12 m) and 4 patients with late attendance (>12 m), were evaluated. (B) Graph of the evaluation of immunological markers and viral loads based on symptomatologic category. Totals of 138 asymptomatic, 74 oligosymptomatic, and 56 polysymptomatic patients were evaluated.

References

    1. Lacoste V., Judde J.G., Bestetti G., Cadranel J., Antoine M., Valensi F., Delabesse E., MacIntyre E., Gessain A. Virological and molecular characterisation of a new B lymphoid cell line, established from an AIDS patient with primary effusion lymphoma, harbouring both KSHV/HHV8 and EBV viroses. Leuk. Lymphoma. 2000;38:401–409. doi: 10.3109/10428190009087032. - DOI - PubMed
    1. Chao C., Silverberg M.J., Martínez-Maza O., Chi M., Abrams D.I., Haque R., Zha H.D., McGuire M., Xu L., Said J. Epstein-Barr Virus Infection and Expression of B-cell Oncogenic Markers in HIV-Related Diffuse Large B-cell Lymphoma. Clin. Cancer Res. 2012;18:4702–4712. doi: 10.1158/1078-0432.CCR-11-3169. - DOI - PMC - PubMed
    1. Lang F., Pei Y., Lamplugh Z.L., Robertson E.S. Molecular Biology of EBV in Relationship to HIV/AIDS-Associated Oncogenesis. Cancer Treat Res. 2019;177:81–103. - PubMed
    1. Friis A.M.C., Åkerlund B., Gyllensten K., Aleman A., Ernberg I. Host–Epstein–Barr virus relationship affected by immunostimulation in HIV-infected patients representing distinct progressor profile groups. Scand. J. Infect. Dis. 2012;44:388–392. doi: 10.3109/00365548.2011.645503. - DOI - PubMed
    1. Riedel D.J., Tang L.S., Rositch A.F. The Role of Viral Co-Infection in HIV-Associated Non-AIDS-Related Cancers. Curr. HIV/AIDS Rep. 2015;12:362–372. doi: 10.1007/s11904-015-0276-6. - DOI - PMC - PubMed

Publication types

MeSH terms