. 2022 Jan 24;14(2):224.
doi: 10.3390/v14020224.

Time-Dependent Proinflammatory Responses Shape Virus Interference during Coinfections of Influenza A Virus and Influenza D Virus

Affiliations

Time-Dependent Proinflammatory Responses Shape Virus Interference during Coinfections of Influenza A Virus and Influenza D Virus

Minhui Guan et al. Viruses. .

Abstract

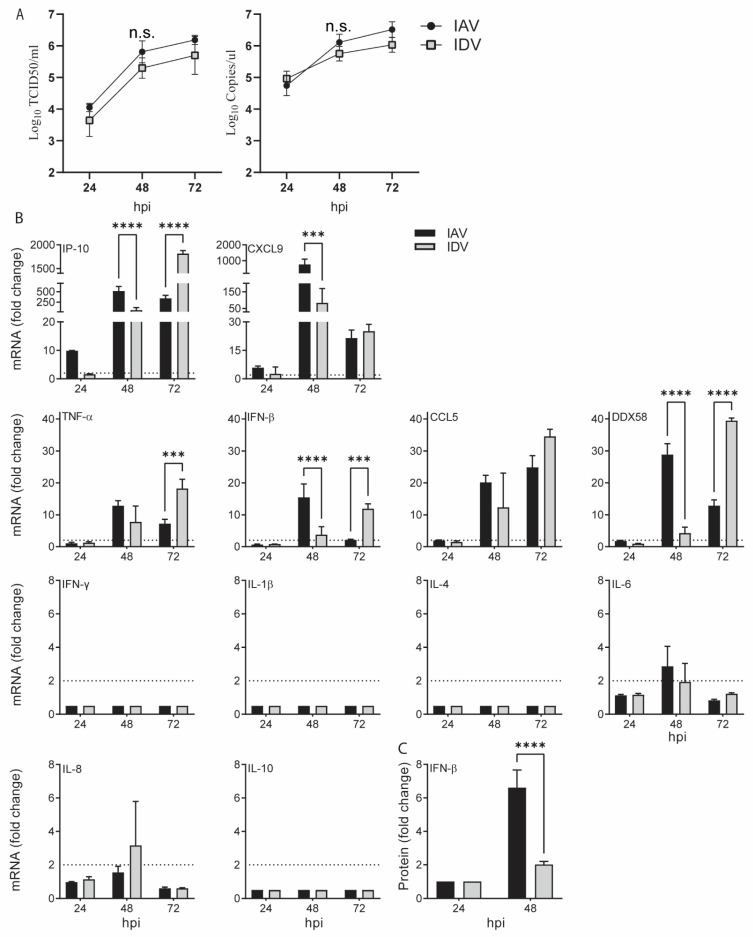
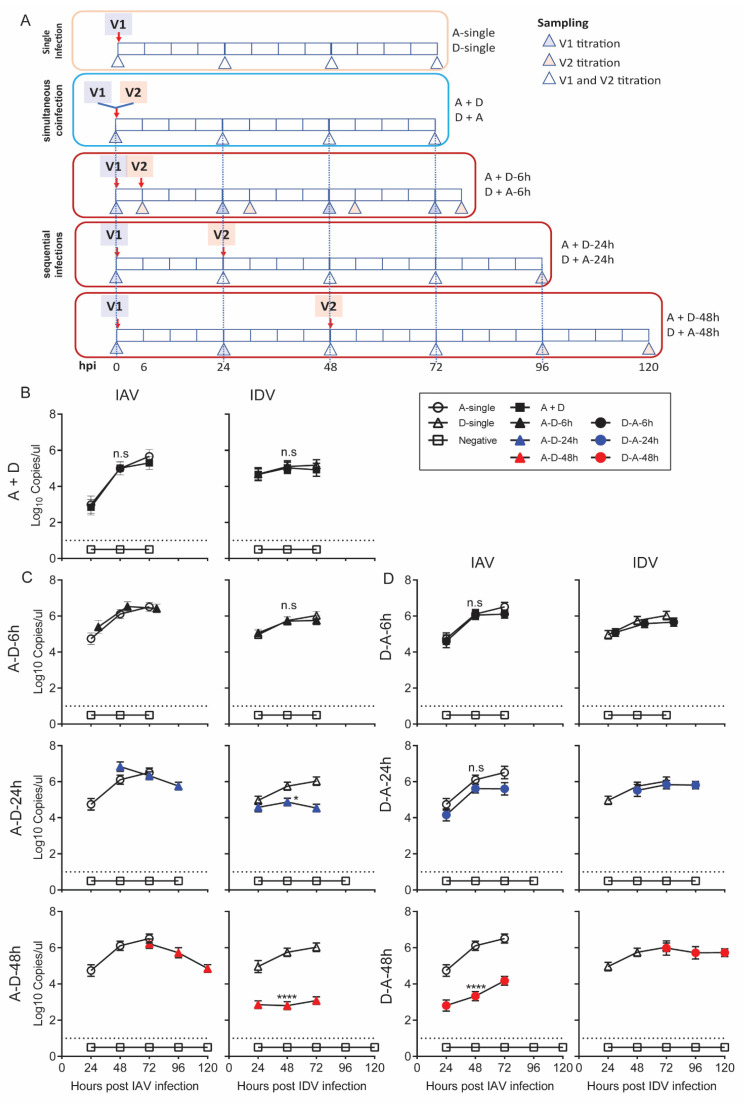
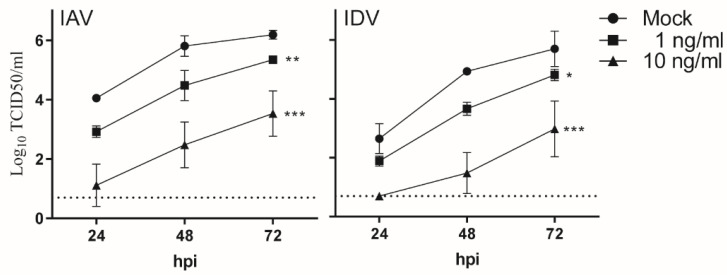
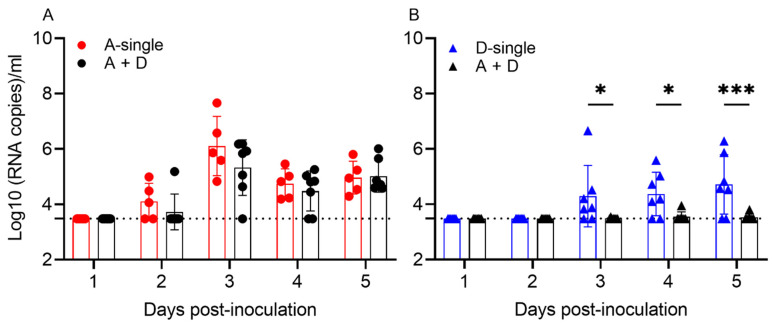
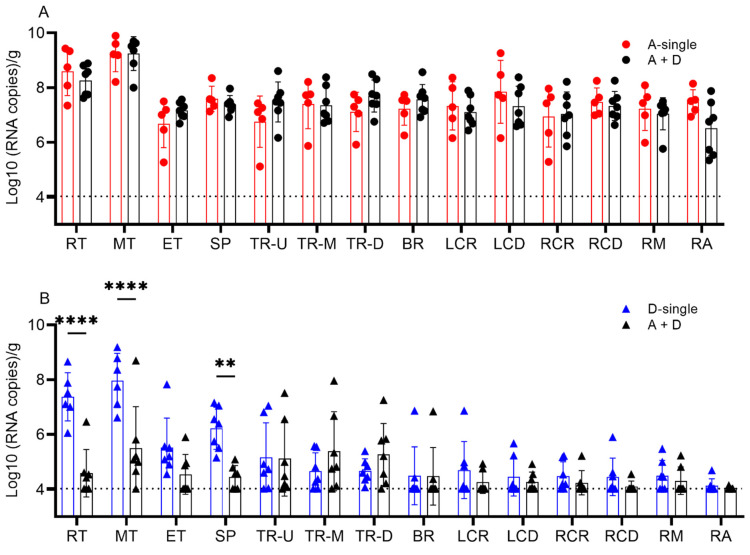
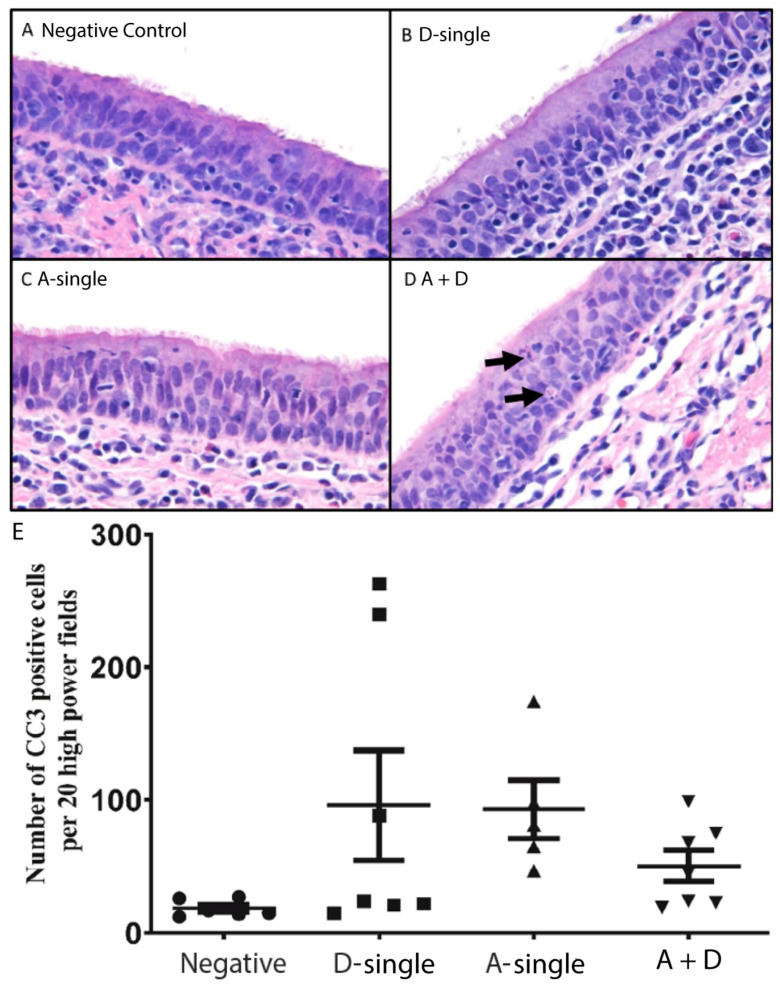
Both influenza A virus (IAV) and influenza D virus (IDV) are enzootic in pigs. IAV causes approximately 100% morbidity with low mortality, whereas IDV leads to only mild respiratory diseases in pigs. In this study, we performed a series of coinfection experiments in vitro and in vivo to understand how IAV and IDV interact and cause pathogenesis during coinfection. The results showed that IAV inhibited IDV replication when infecting swine tracheal epithelial cells (STECs) with IAV 24 or 48 h prior to IDV inoculation and that IDV suppressed IAV replication when IDV preceded IAV inoculation by 48 h. Virus interference was not identified during simultaneous IAV/IDV infections or with 6 h between the two viral infections, regardless of their order. The interference pattern at 24 and 48 h correlated with proinflammatory responses induced by the first infection, which, for IDV, was slower than for IAV by about 24 h. The viruses did not interfere with each other if both infected the cells before proinflammatory responses were induced. Coinfection in pigs further demonstrated that IAV interfered with both viral shedding and virus replication of IDV, especially in the upper respiratory tract. Clinically, coinfection of IDV and IAV did not show significant enhancement of disease pathogenesis, compared with the pigs infected with IAV alone. In summary, this study suggests that interference during coinfection of IAV and IDV is primarily due to the proinflammatory response; therefore, it is dependent on the time between infections and the order of infection. This study facilitates our understanding of virus epidemiology and pathogenesis associated with IAV and IDV coinfection.

Keywords: co-infection; influenza A virus; influenza D virus; proinflammatory response; swine; viral interference.


Conflict of interest statement

The authors declare no conflict of interest.

Figures

Figure 1
Figure 1
Proinflammatory responses stimulated by IAV and IDV in swine tracheal epithelial primary cells. Proinflammatory responses induced by IAV or IDV alone are shown in black and grey bars, respectively. (A) Growth kinetics of IAV and IDV in STECs, titrated by the TCID50 assay (left) and qPCR (right). (B) The relative mRNA expressions were quantified by qPCR and normalized by the house-keeping gene across infected and uninfected cells (details in Section 2). The mean values of fold change (2−ΔΔCt) for each treatment and standard deviation are represented. (C) The protein expression of IFN-β was quantified via ELISA assays. The fold change values of IFN-β’s protein level were calculated (infected samples/negative samples) and are plotted as the y-axis. hpi, hours post inoculation. The dotted line denotes the calculated baselines by the 2−ΔΔCt method. All data collected were obtained from three biological replicates. Significant differences are indicated (* p ≤ 0.05, ** p < 0.0021, *** p < 0.0002, **** p < 0.0001) and not significant (p > 0.05) differences are denoted by n.s. or not labeled.
Figure 2
Figure 2
Growth kinetics of coinfecting IAV and IDV in STECs. (A) The experimental design for single infection of IAV or IDV (A-single or D-single), simultaneous coinfection of IAV and IDV (A + D), sequential infections (IAV infection followed by IDV (AD) with a time gap of 6 (A-D-6h), 24 (A-D-24h) or 48 (A-D-48h) hours and sequential infections of IDV infection followed by IAV with a time gap of 6 (D-A-6h), 24 (D-A-24h) or 48 (D-A-48h) hours. Both the time points for virus inoculation and sampling are annotated. (B) Growth kinetics of IAV and IDV during simultaneous coinfection. (C) Growth kinetics of IAV and IDV during sequential infections of IAV infection followed by IDV. (D) Growth kinetics of IAV and IDV during sequential infections of IDV infection followed by IAV. The left panel of each subfigure shows the detection of IAV whereas the right panel shows the detection of IDV. The x-axis of the left panel in each subfigure represents hours after IAV infection whereas the right panel represents hours after IDV infection of the corresponding samples. The dotted line denotes the limit of detection. All data collected were obtained from three biological replicates. Significant differences are indicated (* p ≤ 0.05, ** p < 0.0021, *** p < 0.0002, **** p < 0.0001) and not significant (p > 0.05) differences are denoted by n.s.
Figure 3
Figure 3
Antagonistic effects of IFN-β on IAV and IDV. STECs were pretreated with a low dose (1 ng/mL) or a high dose (10 ng/mL) of IFN-β for 16 h before inoculating IAV or IDV. A two-way ANOVA analysis was performed to compare the pretreatment group and the mock group (without IFN-β pre-treatment) and significant differences were observed (* p ≤ 0.05, ** p < 0.0021, *** p < 0.0002).
Figure 4
Figure 4
Viral shedding in pigs from the IAV and IDV coinfection experiment. (A) Viral titers of IAV. (B) Viral titers of IDV. Viral loads in each nasal wash were quantified by qRT-PCR and represented as log10 (RNA copies)/mL. Each bar represents the mean values per group and standard deviation. Each data point indicates one sample. The dotted line indicates the limit of detection of 3.48 log10 copies/mL sample. Samples from different treatment groups are differentiated by color, i.e., A-single group in red, D-single group in blue and A + D group in black. No IAV was detected in the negative group and D-single group. No IDV was detected in the negative group and A-single group (not shown). Significant differences are indicated (* p ≤ 0.05, ** p < 0.0021, *** p < 0.0002, **** p < 0.0001).
Figure 5
Figure 5
Viral titers in the respiratory tract tissues of pigs from the IAV and IDV coinfection experiment. (A) Viral titers of IAV. (B) Viral titers of IDV. Viral loads were quantified by qRT-PCR and represented as log10 (RNA copies)/g. Each bar represents the mean values per group and standard deviation. Each data point indicates one sample. The dotted line indicates the limit of detection of 4.03 log10 copies/g tissue. Samples from different treatment groups are differentiated by colors, i.e., A-single group in red, D-single group in blue and A+D group in black. No IAV was detected in the negative group and D-single group. No IDV was detected in the negative group and A-single group (not shown). A two-way ANOVA analysis was performed to compare the single-infection and coinfection groups and significant differences are indicated (* p ≤ 0.05, ** p < 0.0021, *** p < 0.0002, **** p < 0.0001). Abbreviations: rostral turbinate (RT), middle turbinate (MT), ethmoid turbinate (ET), soft palate (SP), upper trachea (TR-U), middle trachea (TR-M), distal trachea (TR-D), bronchus (BR), left cranial lung (LCR), left caudal lung (LCD), right cranial lung (RCR), right caudal lung (RCD), right middle lung (RM) and right accessory lung (RA).
Figure 6
Figure 6
Hematoxylin and eosin staining of tracheas of pigs. (A) Negative control (circle), in which pigs were inoculated with sterile PBS; (B) D-single (square), in which pigs were inoculated with D/46N alone; (C) A-single (up-pointing triangle), in which pigs were inoculated with sH3N2 alone; (D) A + D (down-pointing triangle), in which pigs were inoculated simultaneously with D/46N and sH3N2; and (E) Cleaved caspase 3 staining in the trachea of pigs. All tracheal tissues showed chronic lymphoplasmacytic inflammation within the mucosa and submucosa. Apoptotic bodies (arrows) were frequently observed (D, arrows); however, there was no significant difference among treatment groups and they varied between pigs (E).

Similar articles

Cited by

References

    1. Palese P., Shaw M. Orthomyxoviridae: The Viruses and Their Replication. In: Knipe D., Howley P., editors. Fields Virology. 5th ed. Volume 2. Lippincott Williams & Wilkins; Philadelphia, PA, USA: 2007. pp. 1647–1690.
    1. Hause B.M., Collin E.A., Liu R., Huang B., Sheng Z., Lu W., Wang D., Nelson E.A., Li F. Characterization of a novel influenza virus in cattle and Swine: Proposal for a new genus in the Orthomyxoviridae family. mBio. 2014;5:e00014–e00031. doi: 10.1128/mBio.00031-14. - DOI - PMC - PubMed
    1. Hause B.M., Ducatez M., Collin E.A., Ran Z., Liu R., Sheng Z., Armien A., Kaplan B., Chakravarty S., Hoppe A.D., et al. Isolation of a novel swine influenza virus from Oklahoma in 2011 which is distantly related to human influenza C viruses. PLoS Pathog. 2013;9:e1003176. doi: 10.1371/journal.ppat.1003176. - DOI - PMC - PubMed
    1. Ferguson L., Eckard L., Epperson W.B., Long L.P., Smith D., Huston C., Genova S., Webby R., Wan X.-F. Influenza D virus infection in Mississippi beef cattle. Virology. 2015;486:28–34. doi: 10.1016/j.virol.2015.08.030. - DOI - PMC - PubMed
    1. Quast M., Sreenivasan C., Sexton G., Nedland H., Singrey A., Fawcett L., Miller G., Lauer D., Voss S., Pollock S., et al. Serological evidence for the presence of influenza D virus in small ruminants. Vet. Microbiol. 2015;180:281–285. doi: 10.1016/j.vetmic.2015.09.005. - DOI - PMC - PubMed

LinkOut - more resources