. 2022 Jan 25;14(2):235.
doi: 10.3390/v14020235.

HIV-1 Nucleocapsid Protein Binds Double-Stranded DNA in Multiple Modes to Regulate Compaction and Capsid Uncoating

Affiliations

HIV-1 Nucleocapsid Protein Binds Double-Stranded DNA in Multiple Modes to Regulate Compaction and Capsid Uncoating

Helena Gien et al. Viruses. .

Abstract

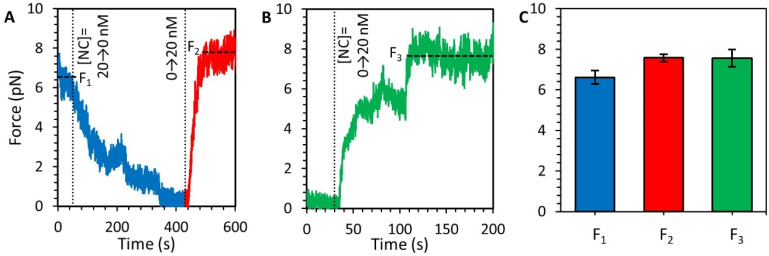
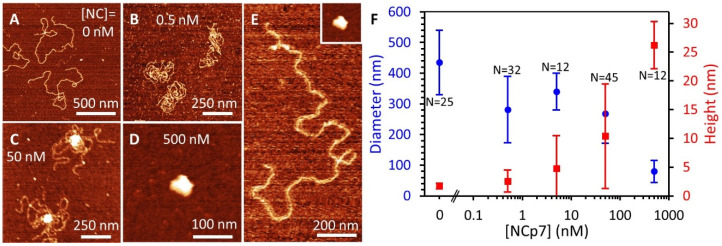
The HIV-1 nucleocapsid protein (NC) is a multi-functional protein necessary for viral replication. Recent studies have demonstrated reverse transcription occurs inside the fully intact viral capsid and that the timing of reverse transcription and uncoating are correlated. How a nearly 10 kbp viral DNA genome is stably contained within a narrow capsid with diameter similar to the persistence length of double-stranded (ds) DNA, and the role of NC in this process, are not well understood. In this study, we use optical tweezers, fluorescence imaging, and atomic force microscopy to observe NC binding a single long DNA substrate in multiple modes. We find that NC binds and saturates the DNA substrate in a non-specific binding mode that triggers uniform DNA self-attraction, condensing the DNA into a tight globule at a constant force up to 10 pN. When NC is removed from solution, the globule dissipates over time, but specifically-bound NC maintains long-range DNA looping that is less compact but highly stable. Both binding modes are additionally observed using AFM imaging. These results suggest multiple binding modes of NC compact DNA into a conformation compatible with reverse transcription, regulating the genomic pressure on the capsid and preventing premature uncoating.

Keywords: DNA condensation; HIV-1 nucleocapsid protein; atomic force microscopy; capsid uncoating; optical tweezers.


Conflict of interest statement

The authors declare no conflict of interest. The funders had no role in the design of the study; in the collection, analyses, or interpretation of data; in the writing of the manuscript, or in the decision to publish the results.

Figures

Figure 1
Figure 1
Overview of the role of NC in HIV replication. (A) NC is critical to multiple steps of the full lifecycle of HIV. As a subdomain of the Gag protein, NC is critical for packaging vRNA in the viral particle. When the viral particle matures, NC is cleaved from Gag and is contained inside the capsid with the vRNA. NC acts as a chaperone for reverse transcription of the viral RNA into DNA and binds and aggregates nucleic acids with high affinity. (B) NC binds and condenses viral DNA during the reverse transcription. NC acts as a chaperone during the synthesis of (−)DNA using vRNA as a template followed by synthesis of the complementary (+)DNA. For the full ~10 kbp viral DNA to be contained inside the capsid, which has a diameter comparable in length to the natural persistence length of DNA, the DNA must be compacted to a volume much smaller than predicted by the natural thermodynamic fluctuations of uncondensed DNA. Once the capsid uncoats, the viral DNA and viral proteins will be released into the host cell nucleus, enabling integration.
Figure 2
Figure 2
Binding of fluorescently-labeled NC to DNA. (A) Confocal scanning laser images (40 nm pixel size) and descriptive cartoons show two beads held by laser traps with an unlabeled DNA substrate tethered in between. The beads show weak autofluorescence and the DNA is not visible. (B) Alexa 488-NC is flowed into the sample chamber and binds the DNA (image magnification and brightness are enhanced to show faint line associated with NC binding uniformly along the stretched DNA). (C) When the DNA extension is decreased by bringing the two beads closer together, a large cluster of labeled NC forms along the substrate. The cluster becomes brighter when the substrate extension is further decreased (D) but becomes fainter again when extension is increased (E). (F) Quantification of the globule fluorescence intensity in each image compared to the substrate extension indicates that more labeled NC is incorporated into the globule as the end-to-end extension of the DNA is decreased. Error bars represent propagated error based on integration of pixel intensities associated with globule compared to background fluorescence.
Figure 3
Figure 3
NC-mediated compaction of DNA. (A) DNA force-extension curve showing results of an experiment performed in three steps. (1, blue) An 8.1 kbp DNA, biotinylated on both ends, is tethered between two streptavidin coated beads. One bead is held in a stationary dual-beam optical trap while the other is moved using a piezo-electric stage attached to a micropipette tip in order to extend the DNA. Stretching of protein-free DNA follows the idealized polymer WLC model (black line fit to blue data). (2, green) While the DNA is held at a constant tension of 20 pN, a fixed concentration of NC is flowed into the sample and incubated with the DNA. Binding of the NC to the substrate results in a small decrease in extension. (3, red) The extension of the DNA is reduced, initially resulting in a decrease in tension, consistent with the WLC model with modified contour and persistence length (dashed line). Once a critical force is reached, however, the DNA continues to compact without a drop in tension, resulting in a force plateau. (B) Plot of DNA extension during protein incubation while holding at a constant 20 pN (green data and black fit line from panel (A)). (C) Contour length of uncondensed DNA during NC mediated compaction including force plateau (red data and dashed fit line from panel (A)).
Figure 4
Figure 4
NC binding to DNA above force plateau (Figure 3, step 2). (A) Incubation of NC with DNA held at 20 pN results in a small concentration-dependent reduction in DNA extension. Low concentrations of NC (10 nM) result in slow and incomplete shortening of the DNA. At higher concentrations, a faster and larger extension reduction occurs, sometimes occurring in multiple steps before equilibration. (B) Binding rates (i.e., the rates at which the NC-DNA complex reaches equilibrium equal to the sum of the rates of free protein binding and bound protein dissociating) increase with [NC] in both buffers containing 50 mM (orange) and 150 mM (purple) Na+. The concentration dependence, as determined by a linear fit of the data (dashed lines), is consistent with a bimolecular binding rate of ~105 s−1M−1. The fits also have a y-intercept of ~0.05 s−1, which would imply a fundamental dissociation time constant on the order of 10s of seconds. (C) Total change in extension varies with [NC]. Due to multistep compaction, the total extension change observed is largest at 50 nM. If the extension change is primarily attributed to a decrease in DNA persistence length, then the decrease in extension of the DNA at 20 pN in saturating NC (1 μM) is consistent with a halving of persistence length from 45 to 20 nm. (D) Dissociation of NC from the DNA substrate is observed when free protein is removed from the sample after incubation. The drop in DNA extension associated with NC incubation is reversed, and DNA returns to its original length on a timescale of ~50 s, consistent with the implied dissociation rate from the y-intercept of the fits in panel (B). The observed kinetics are consistent with a simple bimolecular on-off binding mechanism (dotted line fit).
Figure 5
Figure 5
Compaction of DNA by NC at low force (Figure 3, step 3). (A) Decreasing the extension of the DNA substrate reduces its applied tension and allows for NC-mediated compaction depending on NC concentration (colored lines, black line shows protein-free DNA for reference). At saturating concentrations of NC (>20 nM), a force plateau emerges, where the NC condensate pulls against the stretching force and absorbs all excess DNA, preventing further drops in tension. At sub-saturating NC concentrations (10 nM), the DNA is not fully compacted and its tension approaches zero. (B) The average compaction force as a function of NC and Na+ concentration shows a minimum of ~20 nM NC is needed for efficient compaction and a slight decrease in compaction force at higher protein concentration. (C) The fraction of DNA substrates that compact at low force (exhibit a force plateau) increases with NC concentration. (D) Individual force plateaus may appear rough or smooth as the force fluctuates moderately (blue) or substantially (red) as the DNA compacts. (E) The fluctuations in force, as measured by standard deviation of force (σ), are measured along the same force plateaus plotted in panel (D) using a moving average of 10 s. The rough plateau (red) shows greater deviations in force along its entire length as compared to the smooth plateau (blue) (average deviation over entire curves are listed on plot). The inset displays a histogram of individual DNA molecules compacted in the presence of NC. (F) Using instantaneous force and extension measurements, the contour length of the DNA-NC complex is calculated over time showing increasing DNA condensation as illustrated by inset cartoons. Instead of discrete steps, the length of the polymer decreases gradually as seen in the magnified inset. The instantaneous slope of this line varies over time, especially for DNA compactions with larger force deviations, but the contour length always decreases monotonically over time with an average rate determined by our instrument controls (i.e., the rate at which the beads are moved closer).
Figure 6
Figure 6
Stability and structure of the DNA-NC complex. (A) After the -NC-DNA condensate is formed (as shown in Figure 3, Figure 4 and Figure 5), the complex is re-stretched (1, red), displaying large hysteresis, indicating that NC compaction is not reversible. High force can partially decompact the DNA (2, green) and the force plateau reappears when the extension of the DNA is decreased (3, blue). Dashed line shows protein-free DNA for reference. (B) When the compacted DNA substrate is left incubating with NC (20 nM), the NC-DNA complex is progressively shortened, as shown by representative force-extension curves with different incubation times (colored lines). (C) The contour length of the NC-DNA complex decreases as incubation time is increased. (D) Re-stretching the NC-DNA complex immediately after free protein is removed from the system still requires high applied force for decompaction (1, red and 2, green), but the majority of NC is dissociated from the DNA as the release of the DNA extension no longer displays the force plateau caused by NC-mediated compaction (blue). Dashed line shows protein-free DNA for reference (E) Kymograph showing globules of fluorescently-labeled NC initially formed at low DNA tension (top) dissipating while the DNA is held at a tension of 20 pN (same condition as green line in panel (D)). Horizontal axis shows fluorescence intensity along axis of stretched DNA with large stripes on left and right displaying bead autofluorescence and bright spots in between indicating the locations of NC globules. Vertical axis shows the globules fading but not disappearing entirely over 10 s timescale, indicating partial dissociation. (F) Re-stretching the NC-DNA complex again, still in the absence of free protein, follows WLC models with reduced contour length (dashed lines). Several sudden abrupt increases in contour length (shifting to the right) occur, consistent with the sudden breaking of large DNA loops, until the DNA reaches the extended length of protein free DNA (gray line), as illustrated by inset cartoons.
Figure 7
Figure 7
(De)compaction of DNA-NC at low force. (A) A DNA that is saturated and compacted by 20 nM NC is held at an extension of roughly half that of fully extended DNA, following the experimental procedure outlined in Figure 3. Free protein is removed from the sample (blue) and over hundreds of seconds the tension on the DNA decreases as the DNA decompacts. Reintroducing the NC results in immediate recompaction of the DNA (red). Vertical dotted lines indicate changing NC concentration and horizontal dashed lines indicate equilibrium extension. (B) Protein-free DNA is held at a fixed extension of approximately half its fully extended length, resulting in low substrate tension (<1 pN). NC is flowed into the sample and incubated with the DNA, resulting in an increase in substrate tension over time. The force on the DNA eventually plateaus at the same value observed in previous experiments. (C) Comparison of compaction force for different experimental procedures show that the force plateau generated by NC-mediated compaction of DNA is consistent for the first compaction after extension reduction (F1, blue), the second compaction after reintroduction of NC into the sample (F2, red), and spontaneous compaction upon introduction of NC to protein-free DNA (F3, green).
Figure 8
Figure 8
AFM images of NC-DNA complexes. (A) A 7.2 kbp DNA molecule, in the absence of protein, assumes a spread-out conformation, consistent with the WLC model, with infrequent DNA overlaps. (B) Low concentrations of NC (<10 nM) stabilize crosslinking of DNA loops, reducing the spread of the DNA but not producing a condensed globule. (C) Moderate NC concentrations create a highly condensed DNA globule that partially condenses the DNA. (D) Saturating quantities of NC (>100 nM) condense the entire DNA molecule with no bare DNA remaining. Note the panels show different length scales. (E) Comparison of a protein-free DNA and fully compacted DNA-NC globule (inset) on the same scale. (F) Average diameter and height of DNA molecules as a function of NC concentration, with total number of DNA molecules measured (N) listed for each condition. Increasing NC compacts the DNA, resulting in a smaller maximum DNA diameter on the surface (blue) and higher maximum height due to the formation of a tight 3D globule consisting of many layers of DNA (red). Error bars represent standard deviation, showing the spread of values for individual DNA molecules.

Similar articles

Cited by

References

    1. Coffin J.M., Hughes S.H., Varmus H.E. Retroviruses. [(accessed on 31 August 2021)];1997 Available online: https://www.ncbi.nlm.nih.gov/books/NBK19376/
    1. Levin J.G., Guo J., Rouzina I., Musier-Forsyth K. Nucleic acid chaperone activity of HIV-1 nucleocapsid protein: Critical role in reverse transcription and molecular mechanism. Prog. Nucleic Acid Res. Mol. Biol. 2005;80:217–286. - PubMed
    1. Burdick R.C., Li C., Munshi M., Rawson J.M., Nagashima K., Hu W.-S., Pathak V.K. HIV-1 uncoats in the nucleus near sites of integration. Proc. Natl. Acad. Sci. USA. 2020;117:5486–5493. doi: 10.1073/pnas.1920631117. - DOI - PMC - PubMed
    1. Burdick R.C., Pathak V.K. Efficient HIV-1 in vitro reverse transcription: Optimal capsid stability is required. Signal Transduct. Target. Ther. 2021;6:13. doi: 10.1038/s41392-020-00458-3. - DOI - PMC - PubMed
    1. Li C., Burdick R.C., Nagashima K., Hu W.-S., Pathak V.K. HIV-1 cores retain their integrity until minutes before uncoating in the nucleus. Proc. Natl. Acad. Sci. USA. 2021;118:e2019467118. doi: 10.1073/pnas.2019467118. - DOI - PMC - PubMed

Publication types

Substances

LinkOut - more resources