. 2022 Jan 27;14(2):255.
doi: 10.3390/v14020255.

Rapid Biosensor of SARS-CoV-2 Using Specific Monoclonal Antibodies Recognizing Conserved Nucleocapsid Protein Epitopes

Affiliations

Rapid Biosensor of SARS-CoV-2 Using Specific Monoclonal Antibodies Recognizing Conserved Nucleocapsid Protein Epitopes

Jong-Hwan Lee et al. Viruses. .

Abstract

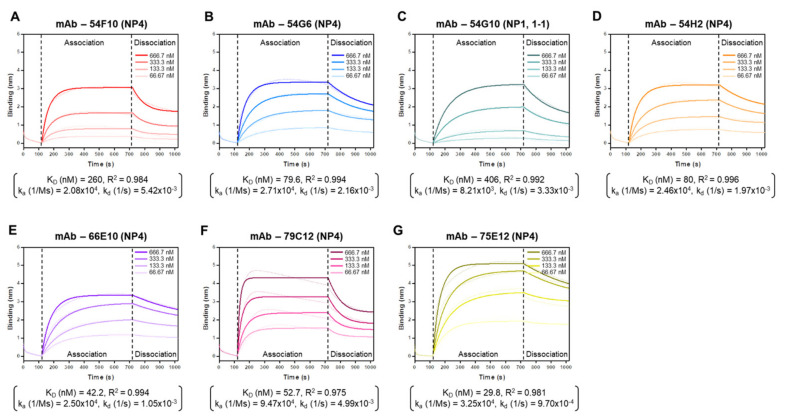
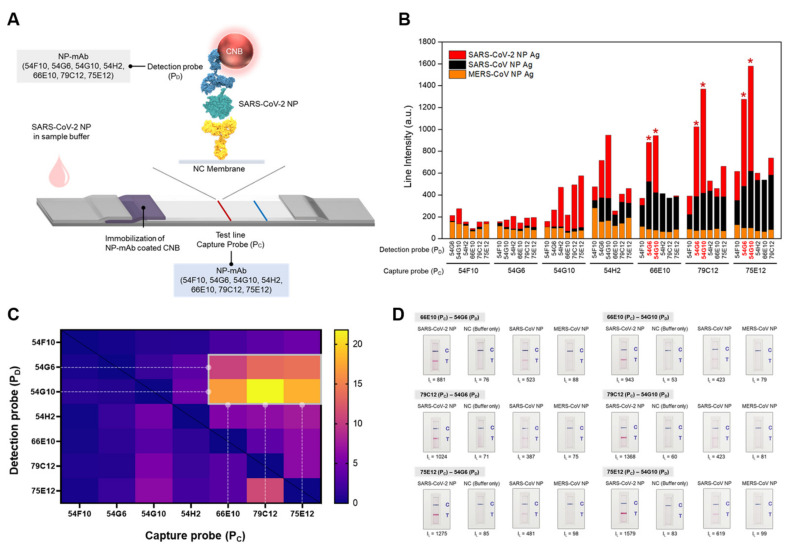
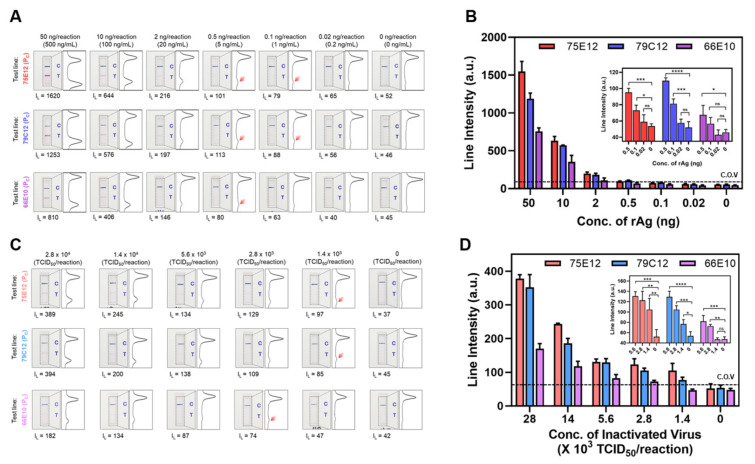
Coronavirus disease 2019 (COVID-19), the pandemic caused by severe acute respiratory syndrome coronavirus 2 (SARS-CoV-2), is characterized by symptoms such as fever, fatigue, a sore throat, diarrhea, and coughing. Although various new vaccines against COVID-19 have been developed, early diagnostics, isolation, and prevention remain important due to virus mutations resulting in rapid and high disease transmission. Amino acid substitutions in the major diagnostic target antigens of SARS-CoV-2 may lower the sensitivity for the detection of SARS-CoV-2. For this reason, we developed specific monoclonal antibodies that bind to epitope peptides as antigens for the rapid detection of SARS-CoV-2 NP. The binding affinity between antigenic peptides and monoclonal antibodies was investigated, and a sandwich pair for capture and detection was employed to develop a rapid biosensor for SARS-CoV-2 NP. The rapid biosensor, based on a monoclonal antibody pair binding to conserved epitopes of SARS-CoV-2 NP, detected cultured virus samples of SARS-CoV-2 (1.4 × 10³ TCID50/reaction) and recombinant NP (1 ng/mL). Laboratory confirmation of the rapid biosensor was performed with clinical specimens (n = 16) from COVID-19 patients and other pathogens. The rapid biosensor consisting of a monoclonal antibody pair (75E12 for capture and the 54G6/54G10 combination for detection) binding to conserved epitopes of SARS-CoV-2 NP could assist in the detection of SARS-CoV-2 NP under the circumstance of spreading SARS-CoV-2 variants.

Keywords: COVID-19; SARS-CoV-2; biosensor; conserved epitope; monoclonal antibody; nucleocapsid; virus mutation.


Conflict of interest statement

The authors declare no conflict of interest.

Figures

Figure 1
Figure 1
Selection of antigenic peptides for the development of SARS-CoV-2 nucleocapsid protein-specific (NP-specific) antibodies. (A) The amino acid sequence of SARS-CoV-2 NP is aligned with SARS-CoV NP and MERS NP. Five short peptides with high sequence specificity are selected based on the sequence alignment (NP1—red, NP1-1—pink, NP2—green, NP3—yellow, and NP4—purple). (B) The frequencies of amino acid substitution in SARS-CoV-2 NP in four major variants of SARS-CoV-2 (alpha, beta, gamma, and delta variants). Of the five short peptides selected by sequence alignment, the NP 1, NP 1-1, and NP 4 peptides share a highly conserved sequence despite mutation accumulation.
Scheme 1
Scheme 1
Detection of the SARS-CoV-2 NP antigen with lateral flow immunoassay (LFIA). The LFIA consists of a sample pad, conjugate pad, nitrocellulose membrane, and absorbent pad. The conjugate pad contains a CNB-conjugated SARS-CoV2 NP-specific antibody and a chicken IgY antibody, used as signal molecules for the test line and control line, respectively. SARS-CoV-2 NP antigen extracted from a patient’s nasopharyngeal swab is loaded into the LFIA, and the sample flows through the LFIA via capillary force. After 15 min of sample loading, SARS-CoV-2 NP is detected in the test line, showing a red line. Detection of the SARS-CoV-2 NP antigen can be confirmed visually or semi-quantitatively.
Scheme 2
Scheme 2
Overall scheme of SARS-CoV-2 NP-specific antibody production. After immunizing mice with each of the five selected peptides (NP 1, NP 1-1, NP 2, NP3, and NP 4), antibody-secreting plasma cells were isolated and fused with myeloma to generate hybridomas. The hybridoma cells were selectively cultured and screened by ELISA (1st) and direct-LFA (2nd). Selected hybridoma cells were injected into the mouse abdominal cavity. After 14 days, produced antibodies were purified by affinity chromatography. Seven monoclonal antibodies (54F10, 54G6, 54G10, 54H2, 66E10, 79C12, and 75E12) were eventually obtained.
Figure 2
Figure 2
Biolayer interferometry (BLI) results of monoclonal antibodies against the SARS-CoV-2 NP antigen. Association and dissociation curves resulting from the antibodies–NP-antigen binding events are obtained using the BLI technique. Real-time binding sensorgrams are represented in dotted lines and their fitting curves are represented in solid lines: (A) 54F10 (red), (B) 54G6 (blue), (C) 54G10 (green), (D) 54H2 (orange), (E) 66E10 (purple), (F) 79C12 (pink), (G) 75E12 (yellow). The 54F10, 54G6, 54H2, 66E10, 79C12, and 75E12 monoclonal antibodies are produced from NP4 peptide as an antigenic determinant, and 54G10 is derived from the antigenic peptide NP1 or NP 1-1. Four different concentrates of antibody are used to analyze the association–dissociation pattern and the binding constants are calculated from the resulting fitting curves based on a 1:1 binding model.
Figure 3
Figure 3
Discovery of the optimal sandwich pair for detecting SARS-CoV-2 NP antigen. (A) Schematic illustration of the LFIA consisting of seven kinds of capture and detection probes. A total of 42 pairs obtained from seven kinds of monoclonal antibodies are evaluated. (B) Overlapped bar graph showing line intensities in the test line according to each sandwich pair and target antigen. Each pair is assessed for detection sensitivity and specificity with 50 ng of NP antigen from SARS-CoV-2 (red), SARS-CoV (black), and MERS-CoV (orange) (PC: capture probe; PD: detection probe). Red marks above the bars and detection probes indicate optimal pairs selected for SARS-CoV-2 NP detection. (C) Heat-map for the normalized line intensities of each sandwich pair. The line intensities are normalized for the absence of the target antigen. Six pairs (marks in gray box) are finally selected for the sandwich pairs for detecting the SARS-CoV-2 NP antigen. (D) Representative images of the LFIA results for each of the selected six pairs (IL: line intensity of the test line measured by a portable line analyzer).
Figure 4
Figure 4
Sensitivity analysis of the optimal sandwich pairs. (A) Results for the detection sensitivity of the selected pairs with recombinant SARS-CoV-2 NP antigen. Three pairs of LFIAs; <Pair 1> 75E12(PC)–54G6/54G10(PD), <Pair 2> 79C12(PC)–54G6/54G10(PD), and <Pair 3> 66E10(PC)–54G6/54G10(PD), are tested with the serially diluted recombinant NP antigens (concentration ranges: 50 ng/reaction to 20 pg/reaction). The LFIA strips are photographed and the intensity of the test line is measured using a portable line analyzer (IL: line intensity). Furthermore, the intensities of the test and control lines are converted to a peak histogram. (B) Bar graph showing the sensitivity analysis results for the selected pairs; Pair 1 (red), Pair 2 (blue), and Pair 3 (purple). Inset) The detection intensity in the low concentration range (0.5 ng to 0.02 ng antigen) (p-values: ns > 0.05, * p ≤ 0.05, ** p ≤ 0.01, *** p ≤ 0.001, **** p ≤ 0.0001). (C) Results for the detection sensitivity of the selected pairs with serial diluted viral samples (concentration ranges: 2.8 × 10⁴ TCID50 to 1.4 × 10³ TCID50). (D) Bar graph showing the detection sensitivity of the viral sample. Inset) The detection intensity in the low concentration range (5.6 × 10³ TCID50 to 1.4 × 10³ TCID50 of SARS-CoV-2) (p-values: ns > 0.05, * p ≤ 0.05, ** p ≤ 0.01, *** p ≤ 0.001, **** p ≤ 0.0001). The cutoff value (C.O.V.) is determined as the mean value of the line intensities in the absence of antigen plus three times the standard deviation.
Figure 5
Figure 5
Clinical assessment of the LIFA. (A) Scheme of the laboratory confirmation procedure of the LFIA with newly developed sandwich pairs. Nasopharyngeal swabs from COVID-19 patients are placed into the UTM and mixed with running buffer in a 1:1 (v/v) ratio. An amount of 100 μL of the mixed solution is loaded into the LFIA, and, 15 min later, the presence of SARS-CoV-2 NP antigen in the clinical sample is confirmed by visual and portable line analyzer. (B) Detection sensitivity results of Pair 1-based LFIA with clinical specimens. Nasopharyngeal swabs from COVID-19 patients (n = 16) are applied to the LIFA device. After 15 min of sample loading, the results of COVID-19 infection are confirmed with the naked eye, and the intensities of the test lines are further analyzed with a portable analyzer (IL: line intensity). RT-qPCR quantifies the viral load of the COVID-19 patient specimens. (C) Dot graph of clinical assessment results for Pair 1- and Pair 2-based LFIA. The cut-off-value (C.O.V.) is determined as the mean value of the line intensities of healthy donors plus three times the standard deviation. (D) Laboratory confirmation results of the Pair 1-based LFIA compared to the RT-qPCR using clinical samples. Nasopharyngeal swab samples from COVID-19 patients (n = 16) and healthy donors (n = 10) are applied to the LFIA and RT-qPCR. RT-qPCR is performed with specific primer–probe sets for detecting the SARS-CoV-2-specific gene (N gene), and viral load in the clinical sample is investigated with the standard curve of N-gene amplicon obtained from standard SARS-CoV-2 RNA. (The detailed information of the primer–probe set is presented in Experimental Section 2.7). (E) Bar graph of specificity analysis with human coronaviruses (OC32 and 229E) and other respiratory pathogens such as human parainfluenza virus 1 (HPIV-1), human parainfluenza virus 3 (HPIV-3), human adenovirus 7a (Adeno 7a), human rhinovirus 1B (Rhinovirus 1b), human respiratory syncytial virus (RSV), and Mycobacterium tuberculosis (MTB). The concentration of the control virus sample is 106 TCID50/reaction (excluding OC43: 5 × 10⁵ TCID50/reaction). Green bar: Pair 1-based LFIA, yellow bar: Pair-2 based LFIA.

Similar articles

Cited by

References

    1. Jung Y., Park G.-S., Moon J.H., Ku K., Beak S.-H., Lee C.-S., Kim S., Park E.C., Park D., Lee J.-H., et al. Comparative Analysis of Primer–Probe Sets for RT-qPCR of COVID-19 Causative Virus (SARS-CoV-2) ACS Infect. Dis. 2020;6:2513–2523. doi: 10.1021/acsinfecdis.0c00464. - DOI - PubMed
    1. Zhu N., Zhang D., Wang W., Li X., Yang B., Song J., Zhao X., Huang B., Shi W., Lu R., et al. A Novel Coronavirus from Patients with Pneumonia in China, 2019. N. Engl. J. Med. 2020;382:727–733. doi: 10.1056/NEJMoa2001017. - DOI - PMC - PubMed
    1. Zhou P., Yang X.-L., Wang X.-G., Hu B., Zhang L., Zhang W., Si H.-R., Zhu Y., Li B., Huang C.-L., et al. A pneumonia outbreak associated with a new coronavirus of probable bat origin. Nature. 2020;579:270–273. doi: 10.1038/s41586-020-2012-7. - DOI - PMC - PubMed
    1. Liu K., Fang Y.-Y., Deng Y., Liu W., Wang M.-F., Ma J.-P., Xiao W., Wang Y.-N., Zhong M.-H., Li C.-H., et al. Clinical characteristics of novel coronavirus cases in tertiary hospitals in Hubei Province. Chin. Med. J. 2020;133:1025. doi: 10.1097/CM9.0000000000000744. - DOI - PMC - PubMed
    1. Huang C., Wang Y., Li X., Ren L., Zhao J., Hu Y., Zhang L., Fan G., Xu J., Gu X., et al. Clinical features of patients infected with 2019 novel coronavirus in Wuhan, China. Lancet. 2020;395:497–506. doi: 10.1016/S0140-6736(20)30183-5. - DOI - PMC - PubMed

Publication types

MeSH terms

Supplementary concepts

LinkOut - more resources