. 2022 Jan 30;14(2):294.
doi: 10.3390/v14020294.

The Spread of SARS-CoV-2 Variant Omicron with a Doubling Time of 2.0-3.3 Days Can Be Explained by Immune Evasion

Affiliations

The Spread of SARS-CoV-2 Variant Omicron with a Doubling Time of 2.0-3.3 Days Can Be Explained by Immune Evasion

Frederic Grabowski et al. Viruses. .

Abstract

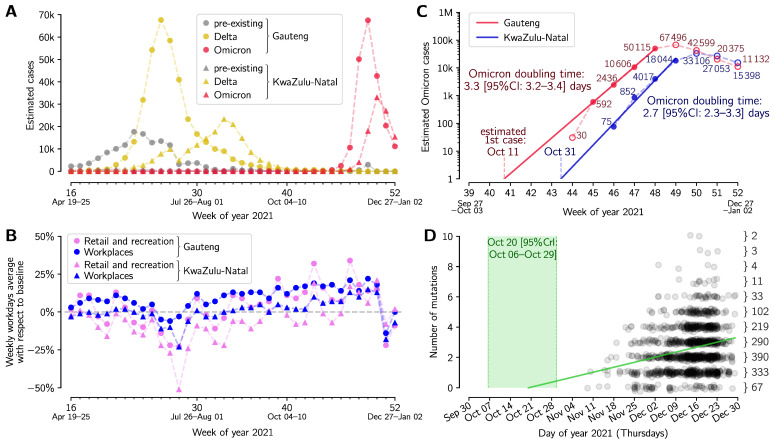
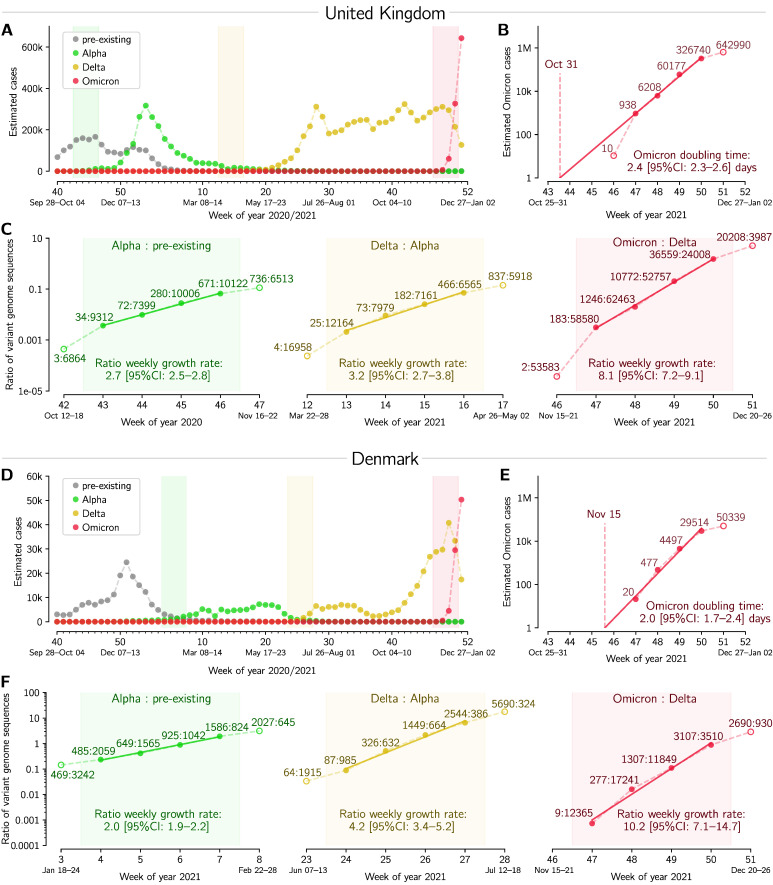
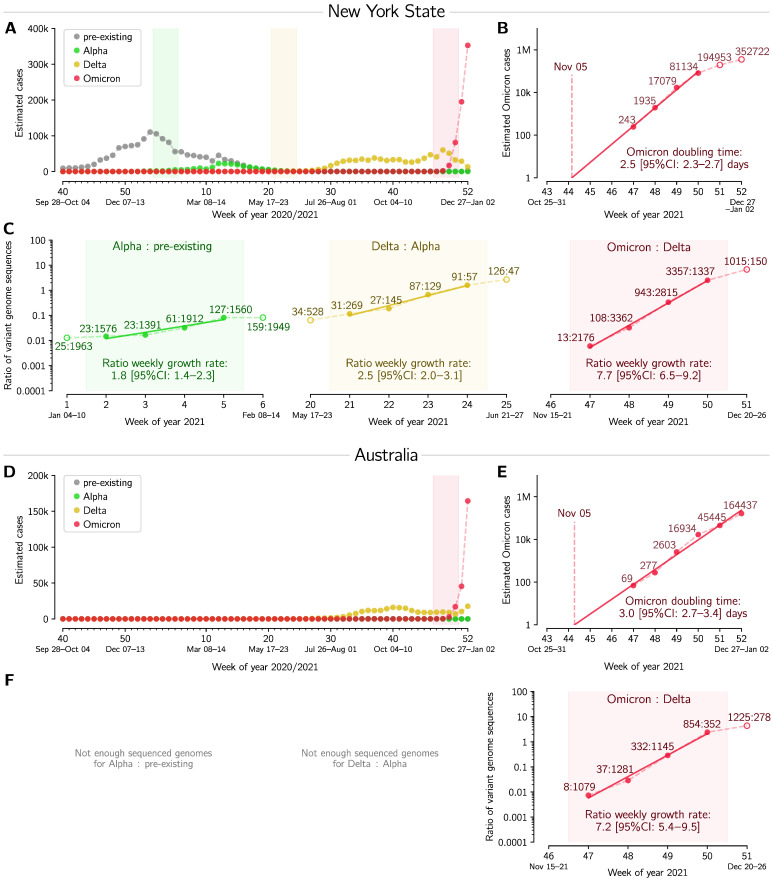
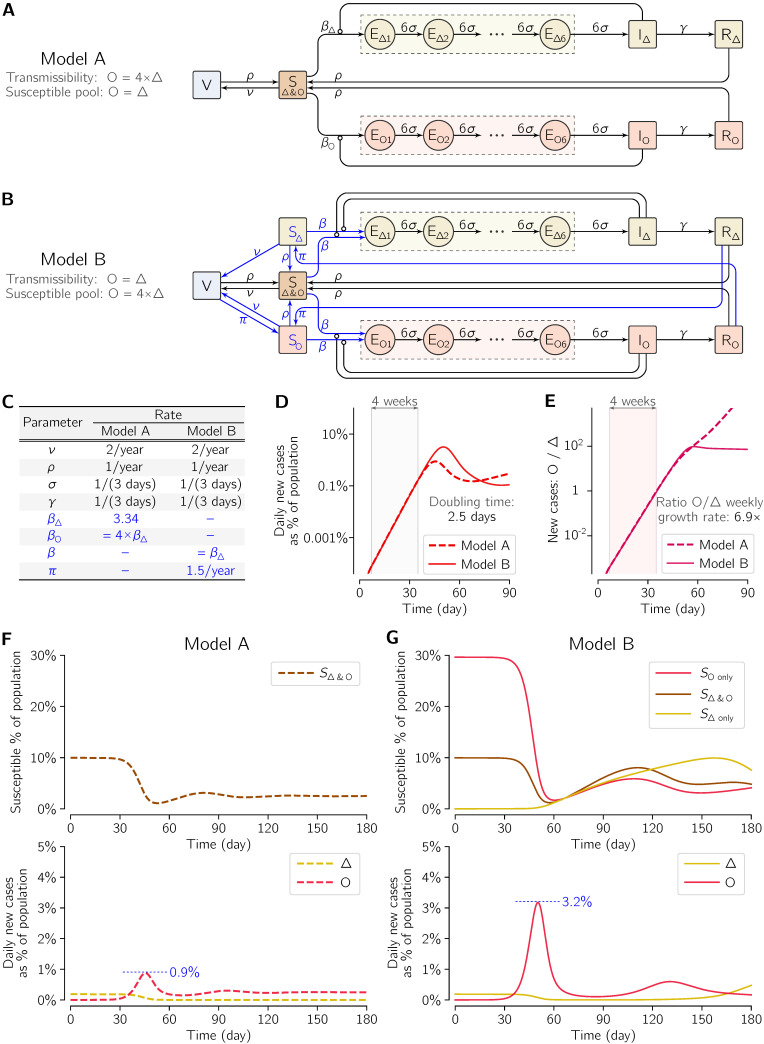
Omicron, the novel highly mutated SARS-CoV-2 Variant of Concern (VOC, Pango lineage B.1.1.529) was first collected in early November 2021 in South Africa. By the end of November 2021, it had spread and approached fixation in South Africa, and had been detected on all continents. We analyzed the exponential growth of Omicron over four-week periods in the two most populated of South Africa's provinces, Gauteng and KwaZulu-Natal, arriving at the doubling time estimates of, respectively, 3.3 days (95% CI: 3.2-3.4 days) and 2.7 days (95% CI: 2.3-3.3 days). Similar or even shorter doubling times were observed in other locations: Australia (3.0 days), New York State (2.5 days), UK (2.4 days), and Denmark (2.0 days). Log-linear regression suggests that the spread began in Gauteng around 11 October 2021; however, due to presumable stochasticity in the initial spread, this estimate can be inaccurate. Phylogenetics-based analysis indicates that the Omicron strain started to diverge between 6 October and 29 October 2021. We estimated that the weekly growth of the ratio of Omicron to Delta is in the range of 7.2-10.2, considerably higher than the growth of the ratio of Delta to Alpha (estimated to be in in the range of 2.5-4.2), and Alpha to pre-existing strains (estimated to be in the range of 1.8-2.7). High relative growth does not necessarily imply higher Omicron infectivity. A two-strain SEIR model suggests that the growth advantage of Omicron may stem from immune evasion, which permits this VOC to infect both recovered and fully vaccinated individuals. As we demonstrated within the model, immune evasion is more concerning than increased transmissibility, because it can facilitate larger epidemic outbreaks.

Keywords: COVID-19 pandemic; Omicron variant; SARS-CoV-2; genome sequencing; mutation.


Conflict of interest statement

The authors have no competing interest.

Figures

Figure 1
Figure 1
Growth and divergence of the Omicron strain. (A) Weekly aggregated cases of Omicron, Delta and other variants in two South African provinces, Gauteng and KwaZulu-Natal. (B) Weekly averaged workday mobility in Gauteng (filled circles) and KwaZulu-Natal (filled triangles) in workplaces (blue) and retail and recreation centers (pink). (C) Exponential growth of the Omicron strain in weeks 45–48 in 2021 (8 November–5 December) in Gauteng and in weeks 46–49 in KwaZulu-Natal. (D) Accumulation of mutations by the Omicron strain worldwide based on the Nextstrain phylogenetic tree. The green line shows the mutation accumulation trend determined by the linear regression assuming Poisson distribution of the number of mutations at a given time. The 95% credible interval of time is marked in light green. The dataset for panels (A,B) is provided as Supplementary Table S1; the phylogenetic tree (with dates) is provided as Supplementary Table S2.
Figure 2
Figure 2
Succession of SARS-CoV-2 strains in the UK and in Denmark. (A,D) Estimated number of weekly cases infected with a particular strain over the weeks of 2020 and 2021. (B,E) Estimated number of weekly Omicron cases and the doubling time estimate based on log–linear regression in four whole-week periods (filled circles). (C,F) Ratios of weekly cases of an emergent strain to the previously dominant strain, and the estimate of ratios’ growth rates based on log–linear regression in four whole-week periods (subpanels correspond to shaded regions in respective panels (A,D)). A dataset for this figure is provided as Supplementary Table S5.
Figure 3
Figure 3
Succession of SARS-CoV-2 strains in New York State and in Australia. (A,D) Estimated number of weekly cases infected with a particular strain over the weeks of 2020 and 2021. (B,E) Estimated number of weekly Omicron cases and the doubling time estimate based on log–linear regression in four (Panel (B)) and six (Panel (E)) whole-week periods (filled circles). (C,F) Ratios of weekly cases of an emergent strain to the previously dominant strain, and the estimate of ratios’ growth rates based on log–linear regression in four whole-week periods (subpanels correspond to shaded regions in respective panels(A,D)). A dataset for this figure is provided as Supplementary Table S5.
Figure 4
Figure 4
Two COVID-19 two-strain SEIR models with vaccination. (A) Scheme of Model A, in which the transmissibility of Omicron (O) is four-fold higher than that of Delta (Δ) and both strains have a common pool of susceptible individuals (10% of simulated population in the pre-Omicron steady state). (B) Scheme of Model B, in which the transmissibility of Omicron (O) and Delta (Δ) is the same but the aggregated pool of individuals susceptible to Omicron is four-fold higher than to Delta (40% vs. 10% of simulated population in the pre-Omicron steady state). Essential modifications with respect to Model A are shown in blue. (C) Values of rate parameters of both models. Model variant-specific parameters are blue. (D) Initial dynamics of Omicron dynamics in both models shows similar growth and identical doubling time in the 4-week time window in the initial exponential phase of the epidemic outbreak, but not in later time points. (E) Ratio of Omicron to Delta new daily cases and its growth rate in both models. (F) Dynamics of the outbreak of Omicron infections in Model A (G).

References

    1. Shu Y., McCauley J. GISAID: Global initiative on sharing all influenza data—from vision to reality. Eurosurveillance. 2017;22:30494. doi: 10.2807/1560-7917.ES.2017.22.13.30494. - DOI - PMC - PubMed
    1. Implications of the Further Emergence and Spread of the SARS-CoV-2 B.1.1.529 Variant of Concern (Omicron) for the EU/EEA—First Update. [(accessed on 2 December 2021)]. Available online: https://www.ecdc.europa.eu/en/publications-data/covid-19-threat-assessme....
    1. Hadfield J., Megill C., Bell S.M., Huddleston J., Potter B., Callender C., Sagulenko P., Bedford T., Neher R.A. Nextstrain: Real-time tracking of pathogen evolution. Bioinformatics. 2018;24:4121–4123. doi: 10.1093/bioinformatics/bty407. - DOI - PMC - PubMed
    1. Kupferschmidt K. Where did ‘weird’ Omicron come from? Science. 2021;374:1179. doi: 10.1126/science.acx9738. - DOI - PubMed
    1. Madhi S.A. South African Population Immunity and Severe Covid-19 with Omicron Variant. medRxiv. 2021 doi: 10.1101/2021.12.20.21268096. - DOI

Publication types

Supplementary concepts