. 2022 Feb 8;14(2):340.
doi: 10.3390/v14020340.

Dynamics of HIV-1 Gag Processing as Revealed by Fluorescence Lifetime Imaging Microscopy and Single Virus Tracking

Affiliations

Dynamics of HIV-1 Gag Processing as Revealed by Fluorescence Lifetime Imaging Microscopy and Single Virus Tracking

Chen Qian et al. Viruses. .

Abstract

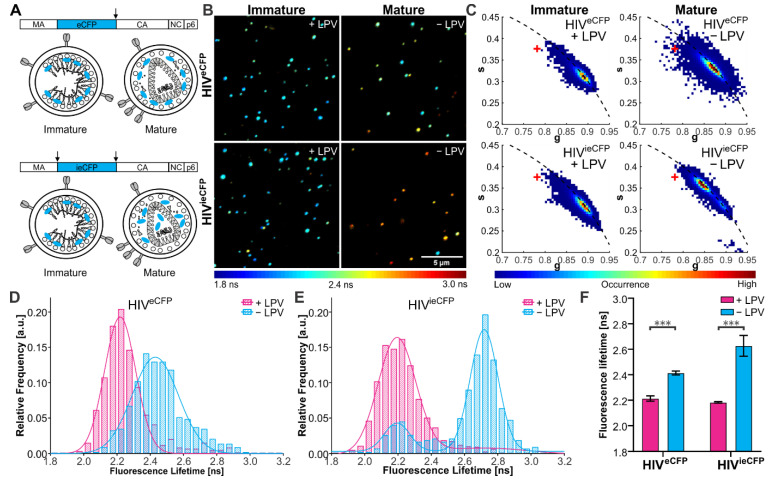
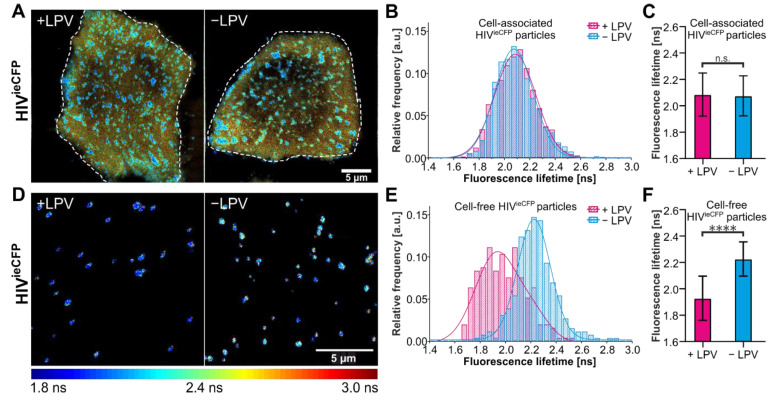
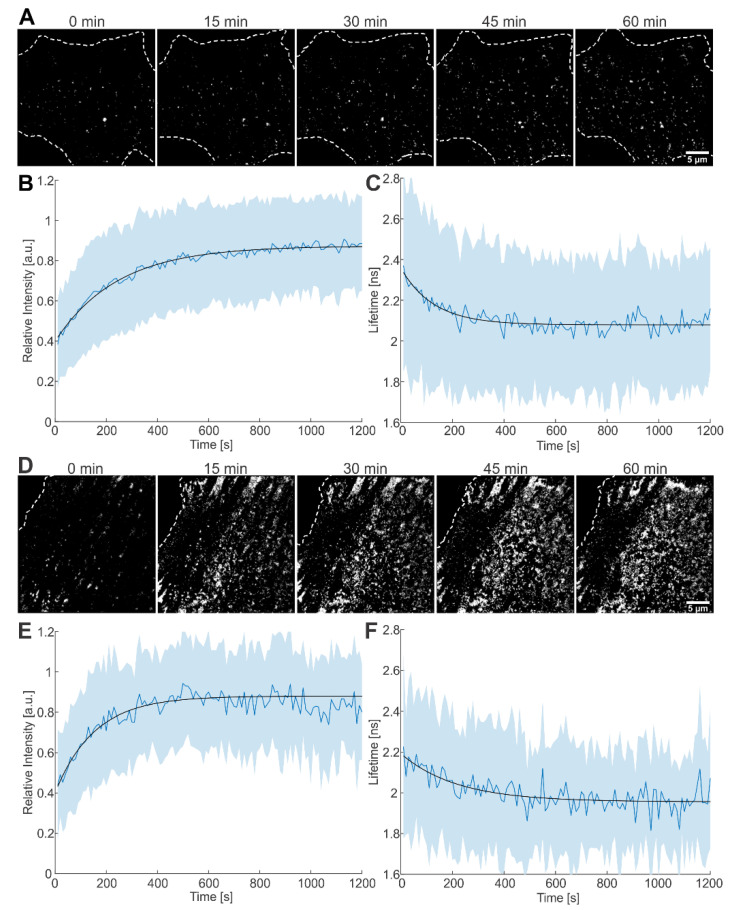
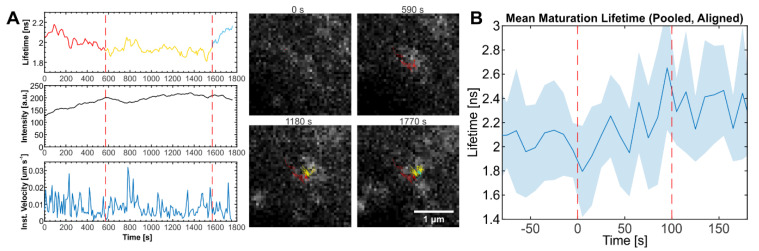
The viral polyprotein Gag plays a central role for HIV-1 assembly, release and maturation. Proteolytic processing of Gag by the viral protease is essential for the structural rearrangements that mark the transition from immature to mature, infectious viruses. The timing and kinetics of Gag processing are not fully understood. Here, fluorescence lifetime imaging microscopy and single virus tracking are used to follow Gag processing in nascent HIV-1 particles in situ. Using a Gag polyprotein labelled internally with eCFP, we show that proteolytic release of the fluorophore from Gag is accompanied by an increase in its fluorescence lifetime. By tracking nascent virus particles in situ and analyzing the intensity and fluorescence lifetime of individual traces, we detect proteolytic cleavage of eCFP from Gag in a subset (6.5%) of viral particles. This suggests that for the majority of VLPs, Gag processing occurs with a delay after particle assembly.

Keywords: HIV; fluorescence lifetime; gag processing; maturation; single virus tracking.


Conflict of interest statement

The authors declare no conflict of interest.

Figures

Figure 1
Figure 1
Fluorescence lifetime of eCFP in purified VLPs. (A) Scheme of the HIV-1 Gag polyprotein, with eCFP inserted between the MA and CA domains and flanked by one (eCFP, top) or two (ieCFP, bottom) PR cleavage sites. Arrows indicate PR cleavage sites flanking the eCFP domain. Schematic drawing of immature and mature HIVeCFP and HIVieCFP particles. (B) Fluorescence lifetime images and (C) phasor plots of immature and mature HIVeCFP or HIVieCFP particles. A ‘+’ indicates the lifetime of free ECFP measured on the same setup. VLPs were produced in transfected HEK293T cells grown in the presence (immature) or absence (mature) of 2 µM LPV as described in materials and methods and Text S1. Particles were adhered to borosilicate coverslips and imaged by CLSM with TCSPC. Measurements were conducted at 23 °C. The lifetime determined for individual VLPs is represented according to the indicated color scale. Scale bar 5 µm. (D,E) Histograms of fluorescence lifetimes of the immature (cyan) and mature (magenta) particle populations extracted from the phasor analysis. Lines show the fit of the lifetime distributions to the sum of two Gaussians. n = 500 particles each. (F) Mean and SD of fluorescent lifetime distribution peak from three independent experiments. Statistical analysis was performed using a Welch’s t-test (***: p < 0.001).
Figure 2
Figure 2
Measurements of the fluorescence lifetime of eCFP in HeLa Kyoto cells. HeLa Kyoto cells were transfected with an equimolar mixture of pCHIV/pCHIVieCFP and grown in the presence or absence of 2 µM LPV. Cells were imaged 24 hpt at 37 °C by CSLM. (A) Fluorescence lifetime images of assembly sites and trapped particles of HIVieCFP in cells measured in the absence or presence of LPV. (B) Histogram of fluorescence lifetime of trapped or cell-associated HIVieCFP particles and a fit to a single Gaussian distribution (solid lines). n = 3196 particles from 7 cells treated with LPV and n = 2999 particles from 9 non-treated cells. (C) Mean and SD of the fitted Gaussian functions in (D). (D) Fluorescence lifetime images of released HIVieCFP particles detected adjacent to transfected cells (cell-free particles). (E) Histogram of fluorescence lifetime of cell-free HIVieCFP particles and a fit to a sum of two Gaussians (solid lines). n = 250 particles each from LPV-treated and non-treated cells. (F) Mean and SD of the fitted Gaussian functions in (E). The peak of the major species was used. The fluorescence lifetime images are colored according to the ‘jet’ colormap with a range of 1.8 ns–3.0 ns. Scale bars 5 µm. Statistical analysis was performed using a Welch’s t-test (n.s.: non-significant, p > 0.05; ****: p < 0.0001).
Figure 3
Figure 3
Live-cell imaging of the assembly process at the plasma membrane of HeLa Kyoto cells. (A) Time lapse images of Gag-ieCFP assembly recorded at the plasma membrane of a transfected HeLa Kyoto cell grown in the absence of LPV recorded at the indicated times after onset of microscopic observation. Plots of (B) fluorescence intensity and (C) fluorescence lifetime measured at individual assembly sites as detected in (A). Mean values and SD are shown (n = 170 sites from 4 cells); black lines represent fits to single exponential equations. (D) Time lapse images recorded at the plasma membrane of a transfected HeLa Kyoto cell grown in the presence of 2 µM LPV. Plot of (E) fluorescence intensity and (F) fluorescence lifetime measured at individual assembly sites as detected in (D). Mean values and SD are shown (n = 51 sites from 2 cells); black lines represent fits to single exponential equations. HeLa Kyoto cells were co-transfected with equimolar amounts of pCHIV wt and pCHIVieCFP and imaged at 16 hpt. Cells were imaged every 5 s for 1–2 h. Scale bars: 5 µm.
Figure 4
Figure 4
Particles showing eCFP lifetime changes indicative of maturation. (A) Lifetime, intensity, and velocity plots of an individual particle showing lifetime changes indicative of maturation following assembly. The lifetime plot is colored by the identifiable state of particle (red: assembly, yellow: plateau phase, blue: maturation). Still images from the movie analyzed for this graph recorded at the indicated times are shown. See Movie S1. (B) Mean and SD of fluorescence lifetime of maturing particles in pCHIV/pCHIVieCFP (1:1) transfected HeLa Kyoto cells. The lifetime of each particle was aligned at the start point of maturation (Time = 0 s) for each trace before averaging. Dotted lines indicate the apparent time range over which the lifetime change occurs. n = 11 traces from 4 cells. Scale bar: 1 µm.

Similar articles

Cited by

References

    1. Murray P.S., Li Z., Wang J., Tang C.L., Honig B., Murray D. Retroviral matrix domains share electrostatic homology: Models for membrane binding function throughout the viral life cycle. Structure. 2005;13:1521–1531. doi: 10.1016/j.str.2005.07.010. - DOI - PubMed
    1. Gamble T.R., Yoo S., Vajdos F.F., von Schwedler U.K., Worthylake D.K., Wang H., McCutcheon J.P., Sundquist W.I., Hill C.P. Structure of the carboxyl-terminal dimerization domain of the HIV-1 capsid protein. Science. 1997;278:849–853. doi: 10.1126/science.278.5339.849. - DOI - PubMed
    1. Muriaux D., Darlix J.L. Properties and functions of the nucleocapsid protein in virus assembly. RNA Biol. 2010;7:744–753. doi: 10.4161/rna.7.6.14065. - DOI - PMC - PubMed
    1. Sundquist W.I., Krausslich H.G. HIV-1 assembly, budding, and maturation. Cold Spring Harb. Perspect. Med. 2012;2:a006924. doi: 10.1101/cshperspect.a006924. - DOI - PMC - PubMed
    1. Pettit S.C., Moody M.D., Wehbie R.S., Kaplan A.H., Nantermet P.V., Klein C.A., Swanstrom R. The p2 domain of human immunodeficiency virus type 1 Gag regulates sequential proteolytic processing and is required to produce fully infectious virions. J. Virol. 1994;68:8017–8027. doi: 10.1128/jvi.68.12.8017-8027.1994. - DOI - PMC - PubMed

Publication types

MeSH terms

Substances