. 2022 Feb 11;14(2):377.
doi: 10.3390/v14020377.

Zika Virus Infection of Sertoli Cells Alters Protein Expression Involved in Activated Immune and Antiviral Response Pathways, Carbohydrate Metabolism and Cardiovascular Disease

Affiliations

Zika Virus Infection of Sertoli Cells Alters Protein Expression Involved in Activated Immune and Antiviral Response Pathways, Carbohydrate Metabolism and Cardiovascular Disease

Mahamud-Ur Rashid et al. Viruses. .

Abstract

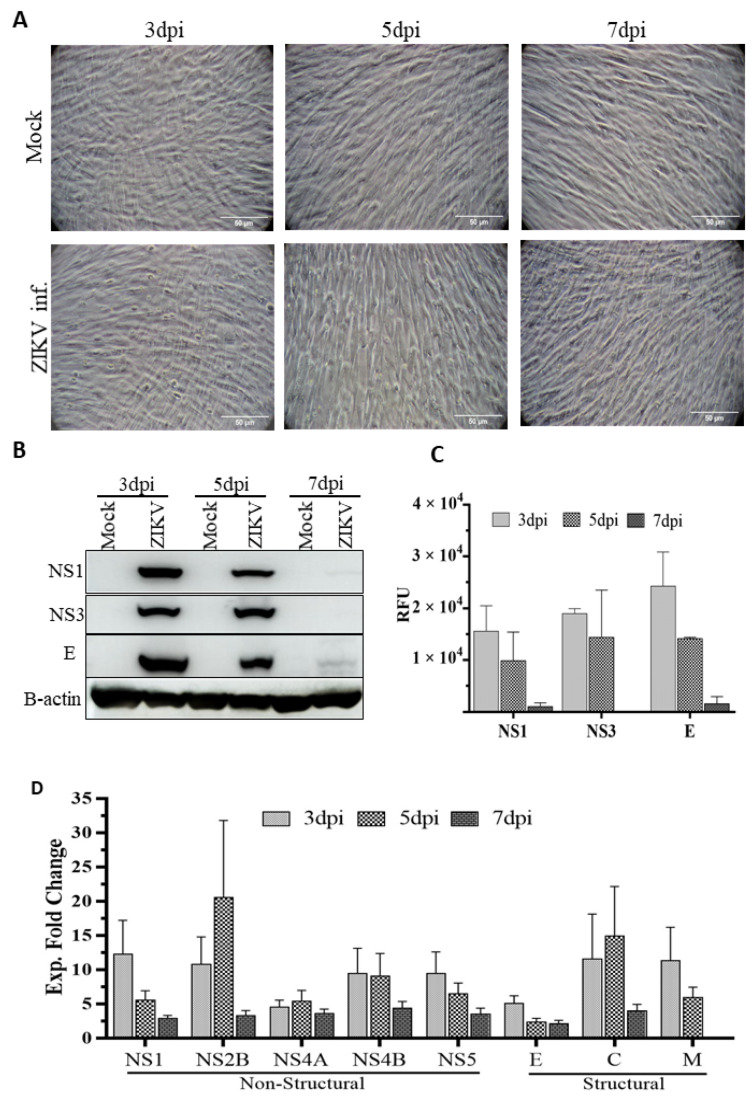
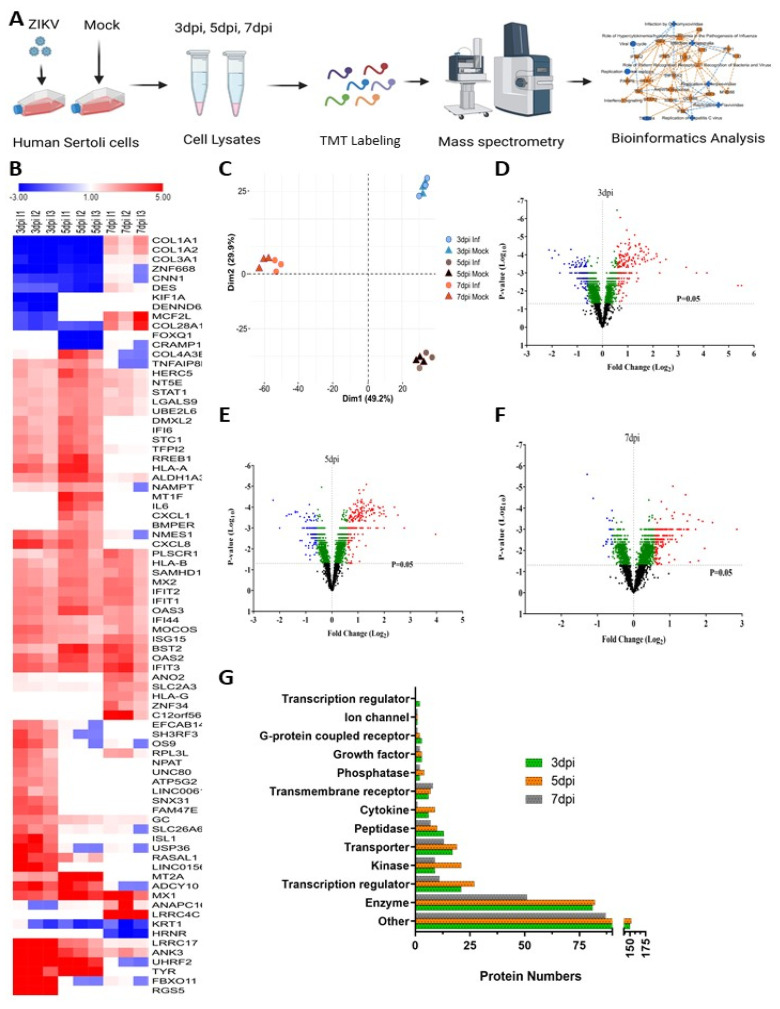
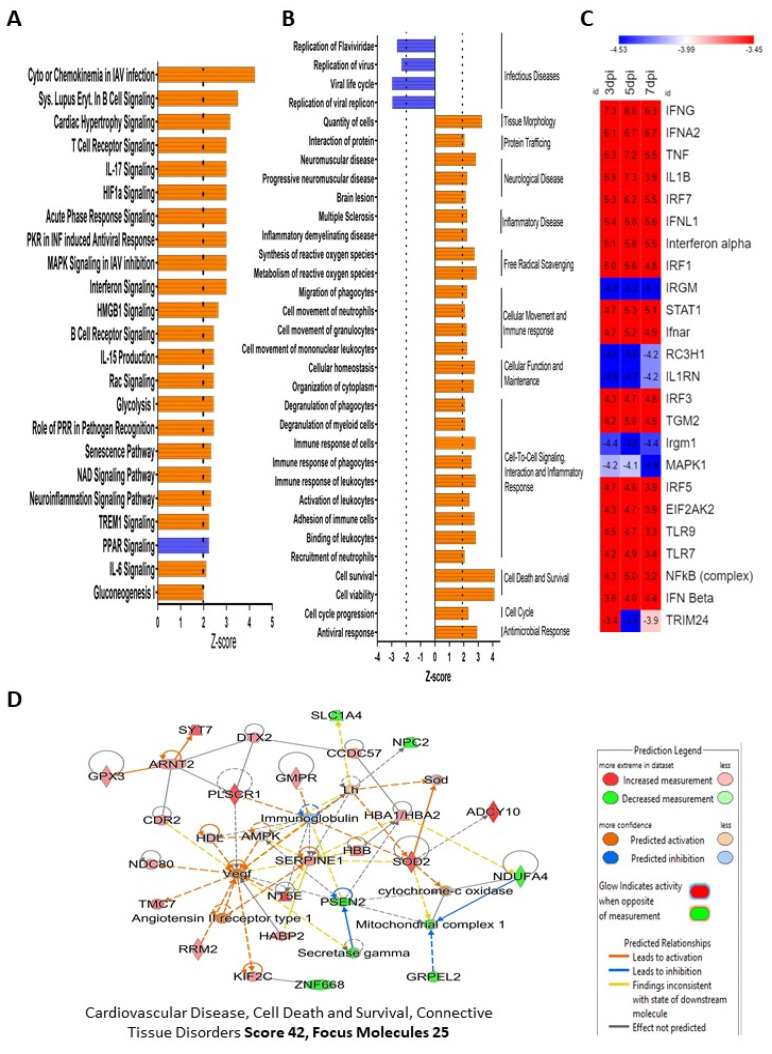
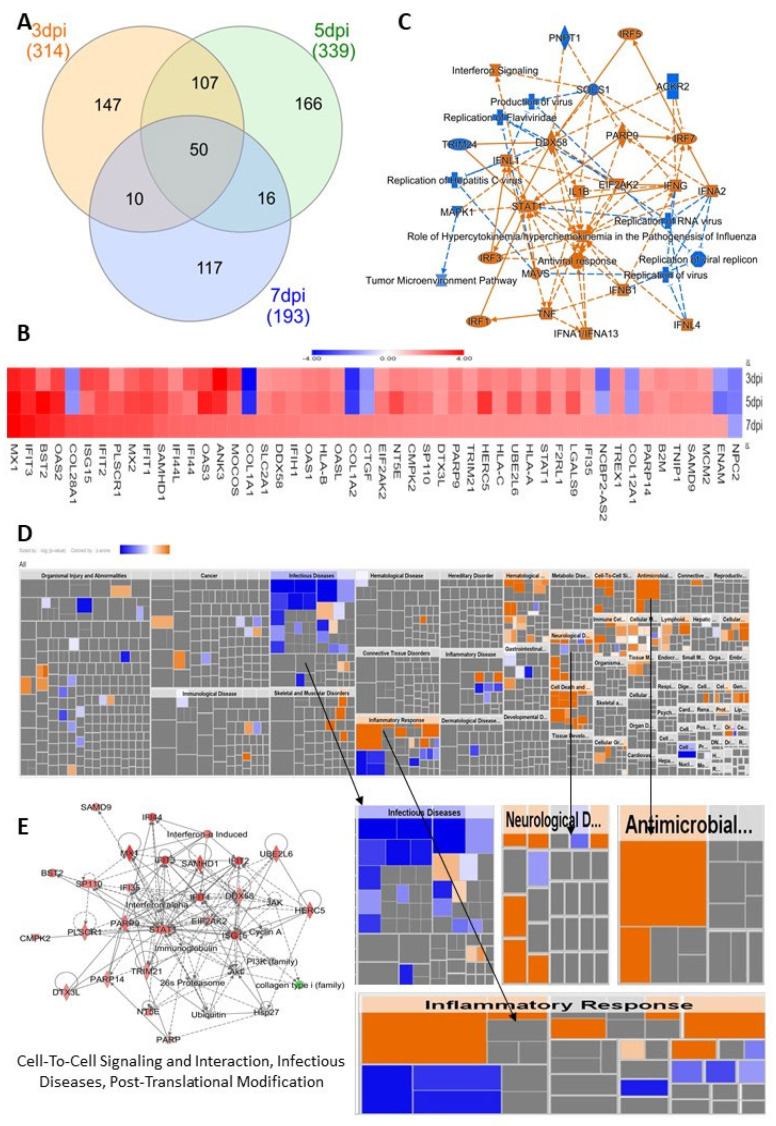
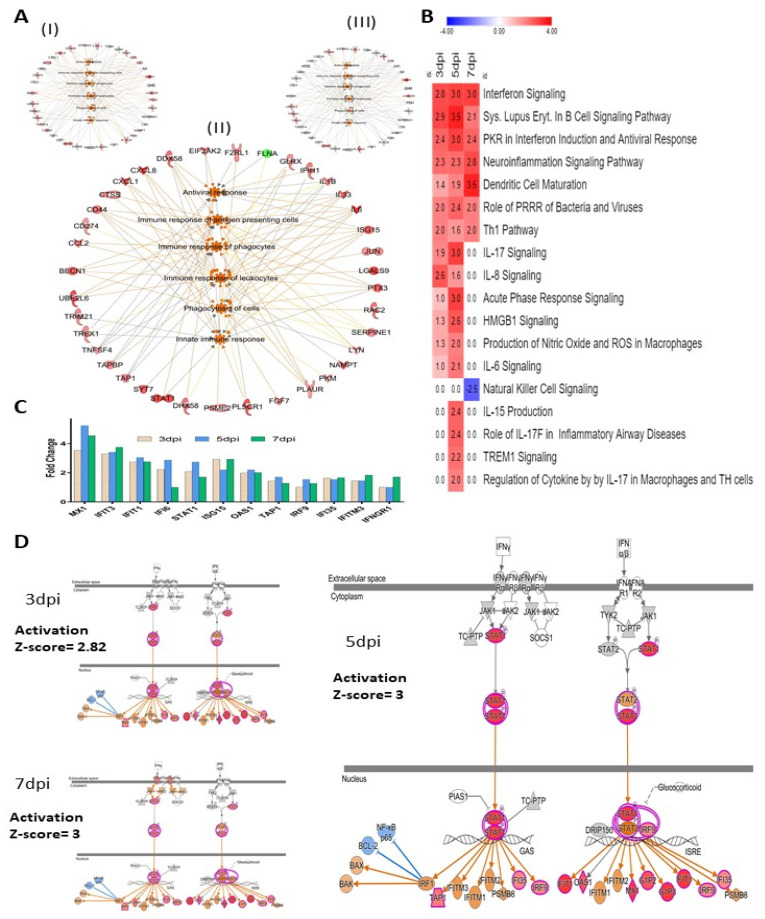
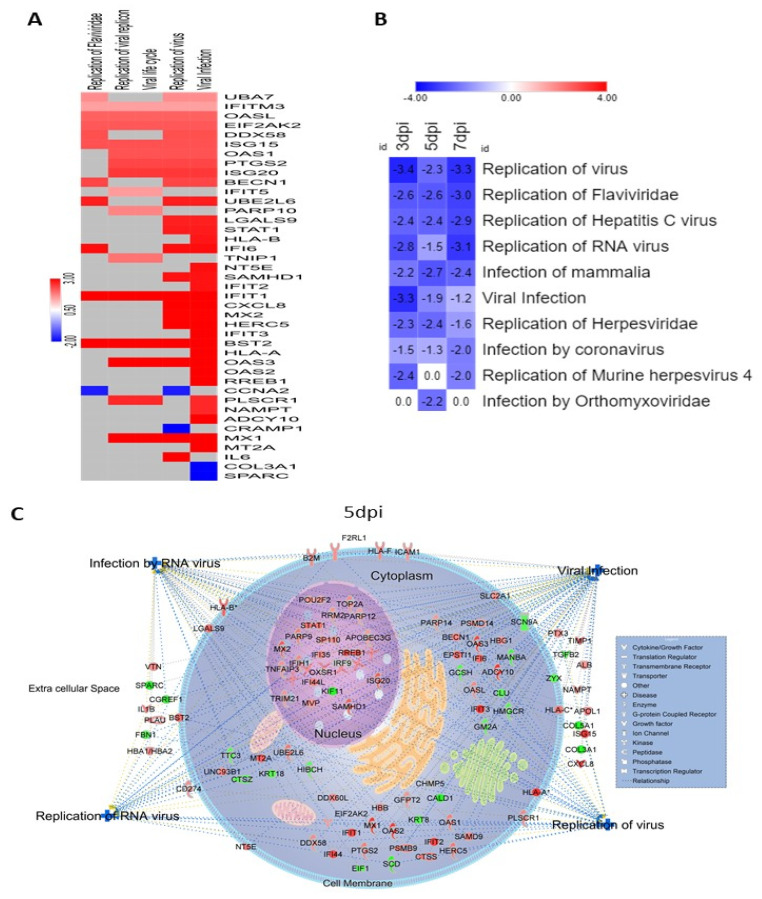
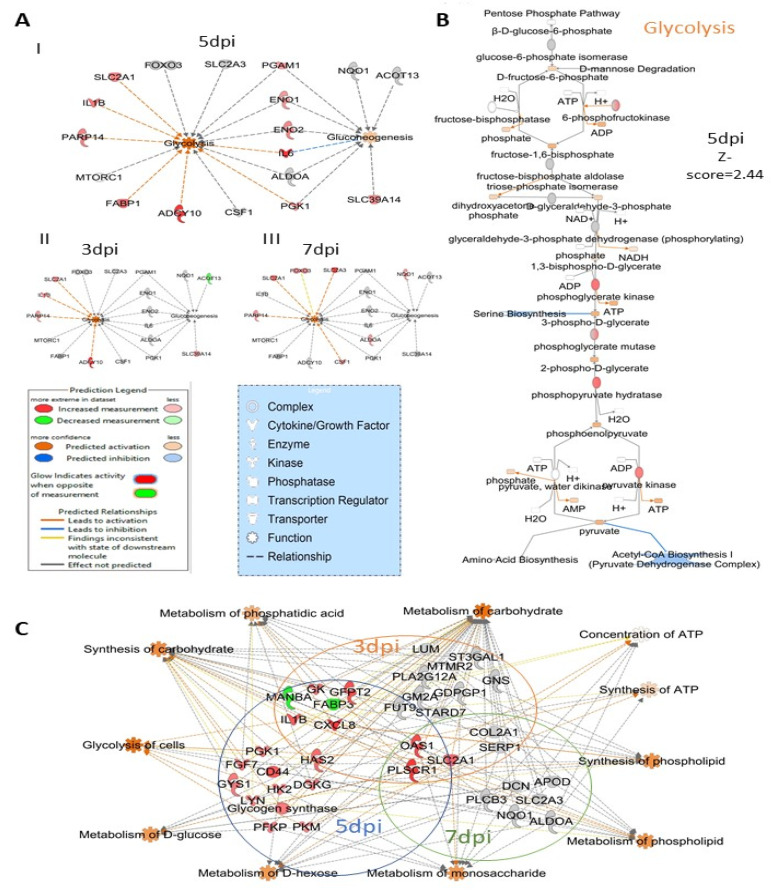
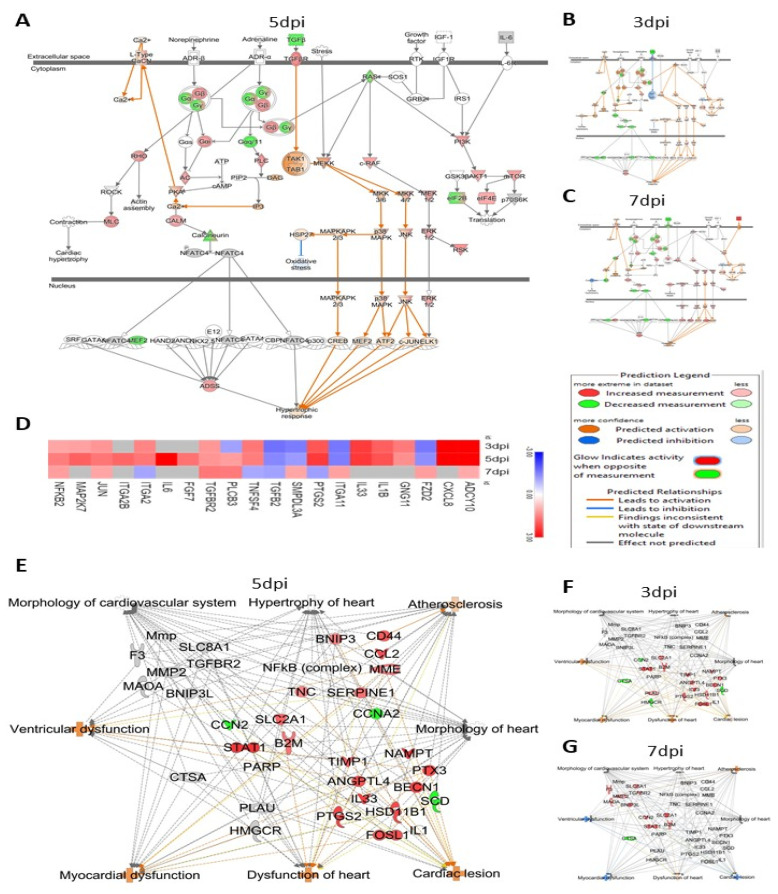
Zika virus (ZIKV), a re-emerging virus, causes congenital brain abnormalities and Guillain-Barré syndrome. It is mainly transmitted by Aedes mosquitoes, but infections are also linked to sexual transmissions. Infectious ZIKV has been isolated, and viral RNA has been detected in semen over a year after the onset of initial symptoms, but the mode of long-term persistence is not yet understood. ZIKV can proliferate in human Sertoli cells (HSerC) for several weeks in vitro, suggesting that it might be a reservoir for persistent ZIKV infection. This study determined proteomic changes in HSerC during ZIKV infections by TMT-mass spectrometry analysis. Levels of 4416 unique Sertoli cell proteins were significantly altered at 3, 5, and 7 days after ZIKV infection. The significantly altered proteins include enzymes, transcription regulators, transporters, kinases, peptidases, transmembrane receptors, cytokines, ion channels, and growth factors. Many of these proteins are involved in pathways associated with antiviral response, antigen presentation, and immune cell activation. Several immune response pathway proteins were significantly activated during infection, e.g., interferon signaling, T cell receptor signaling, IL-8 signaling, and Th1 signaling. The altered protein levels were linked to predicted activation of immune response in HSerC, which was predicted to suppress ZIKV infection. ZIKV infection also affected the levels of critical regulators of gluconeogenesis and glycolysis pathways such as phosphoglycerate mutase, phosphoglycerate kinase, and enolase. Interestingly, many significantly altered proteins were associated with cardiac hypertrophy, which may induce heart failure in infected patients. In summary, our research contributes to a better understanding of ZIKV replication dynamics and infection in Sertoli cells.

Keywords: Sertoli cells; Zika virus; carbohydrate metabolism; cardiovascular disease; glycolysis; immune response; persistence in semen; sexual transmission.


Conflict of interest statement

The authors declare they have no conflicts of interest with this study.

Figures

Figure 1
Figure 1
Cytopathic impact of ZIKV infection on HSerC and viral protein expression. HSerC were infected with ZIKV an MOI of 3. (A) Cytopathic impact of ZIKV infection was observed at 3, 5 and 7 days post infection (dpi) under bright−field microscopy at 200× magnification. Scale bar is 50 μm. (B) Viral protein expression was determined by Western blot using ZIKV-NS1, NS3 and ENV monoclonal antibodies at 3, 5 and 7 dpi. (C) Quantitative expression of ZIKV viral proteins determined by densitometry analysis of Western blot images using Image J and normalized to B-actin expression. (D) ZIKV proteins expression detected after 3, 5 and 7 dpi by mass spectrometry. Log2 expressions of ZIKV proteins were compared with mock-treated cells and converted to Fold Change (FC) Abbreviations. dpi = Days post infection. Exp = Expression. RFU = Relative fluorescence units.
Figure 2
Figure 2
Detection of cellular protein level alterations in ZIKV-infected Sertoli cells by mass spectrometry. (A) Schematic flow diagram of the study design. (B) Heatmap of most affected proteins (Fold change ≥ 2.5 or ≤−2.5; p value < 0.05) by ZIKV infection in Sertoli cells. Red and blue colors indicate up-regulation and down-regulation, respectively. (C) PCA plot of proteomic data from mock- and ZIKV-infected cells, from all three replicates. Volcano plots displaying the protein level alterations after ZIKV infection at 3 dpi (D), 5 dpi (E), and 7 dpi (F). Red = significantly up-regulated (FC > 1.5; p-value < 0.05), blue = significantly down-regulated (FC < −1.5; p-value < 0.05), green = significantly affected (p-value < 0.05, but FC < ±1.5), black = not significantly affected (p-value > 0.05). (G) Classification of significantly altered (Fold change ≥ 1.5 or ≤ −1.5; p value < 0.05) protein types at different time points after ZIKV infection. Abbreviations. FC = Fold change; dpi = Days post infection; inf = Infected.
Figure 3
Figure 3
IPA-predicted activation and inhibition of bio-functions, canonical pathways, protein–protein networks, and upstream molecules after ZIKV infection in HSerC. (A) Top-most canonical pathways predicted to be significantly activated or inhibited by IPA at 5 days post ZIKV infection. (B) Top bio-functions and predicted activation or inhibition Z-scores indicated at 5 dpi. Activation is indicated by a positive Z-score and the inhibited bio-functions are indicated by negative Z-scores. (C) The top 25 upstream regulators, predicted to be affected at 3, 5 and 7 dpi after ZIKV infection in HSerC. Red indicates up-regulation, blue indicates down-regulation. Numbers in boxes show the significance of alteration measured by Z-score. (D) The most affected protein networks at 5 dpi by ZIKV infection in HSerC. Red and green represent up-regulation and down-regulation, respectively; gray proteins denote that they were recognized in the present study, but not significantly regulated; colorless proteins interact with molecules in the network, but were not identified in our study. Abbreviations. dpi = Days post infection.
Figure 4
Figure 4
Impact of commonly affected proteins in HSerC by ZIKV on cellular functions and diseases. (A) Venn diagram of altered proteins at 3, 5 and 7 dpi. (B) Summary of IPA analysis showing the most affected bio-functions, canonical pathways and affected protein networks and their relationship by the commonly affected proteins. (C) Heatmap of the 50 commonly affected proteins at 3, 5 and 7 dpi. Red/orange and blue represent up-regulation and down-regulation, respectively. (D) Heat map of the disease and biofunctions affected by the commonly affected proteins. (E) The protein–protein interaction networks affected by the commonly altered proteins. Red and green represent up-regulation and down-regulation, respectively; gray proteins denote that they were recognized in the present study, but not significantly regulated; colorless proteins interact with molecules in the network, but were not identified in our study. Abbreviations. dpi = Days post infection.
Figure 5
Figure 5
Immune response in HSerC after ZIKV infection. (A) Bio-functions related to immune response pathways affected at (I) 3 dpi, (II) 5 dpi, and (III) 7 dpi. (B) Canonical pathways associated with immune response pathways affected by ZIKV infection in Sertoli cells. Red and blue represent up-regulation and down-regulation, respectively. The number in each box shows the activation Z-score predicted by IPA. (C) Proteins in Interferon signaling pathways affected by ZIKV infection. (D) Activation of Interferon signaling pathway by ZIKV infection. Red and green represent up-regulation and down-regulation, respectively; gray proteins denote that they were recognized in the present study, but not significantly regulated; colorless proteins interact with molecules in the network, but were not identified in our study. Abbreviations. dpi = Days post infection.
Figure 6
Figure 6
Viral replication was suppressed by the cellular response in HSerC after ZIKV infection. (A). Heat map of the proteins involved in virus infection, lifecycle and replication at 5 dpi. Red and blue represent up-regulation and down-regulation of protein expression, respectively. (B) Replication of different family of viruses were predicted to be inhibited by the significantly affected proteins at 3, 5 and 7 dpi. The number in the box indicates the Z-score of the representative function or disease. (C) Cellular localization of the altered proteins predicted to be involved in the regulation of viral infection and in infection by, and replication of, RNA viruses. Red and green represent up-regulation and down-regulation of protein expression, respectively. Abbreviations. dpi = Days post infection.
Figure 7
Figure 7
ZIKV infection impacts carbohydrate metabolism in HSerC. (A) Proteins and enzymes involved in glycolysis and gluconeogenesis pathways affected by ZIKV infection at I. 5 dpi, II. 3 dpi and III. 7 dpi. IPA predicted the impact of ZIKV infection on (B) glycolysis pathway at 5 dpi in Sertoli cells. (C) Proteins involved in carbohydrate metabolism and energy production in cells affected by ZIKV infection. Red and green represent up-regulation and down-regulation of protein levels, respectively. Abbreviations. Dpi = Days post infection.
Figure 8
Figure 8
ZIKV infection significantly affects the levels of proteins involved in the cardiac hypertrophy pathway. IPA predicted activation of the cardiac hypertrophy pathway by Zika virus infection by (A) 3 dpi, (B) 7 dpi and (C) 5 dpi. (D). Heatmap of the proteins involved in cardiac hypertrophy pathway altered by ZIKV infection in HSerC. In the heatmap, red and blue represent up-regulation and down-regulation, respectively. Gray indicates the proteins were not detected at the respective time point. HSerC proteins associated with pathways that increase cardiovascular disease, that are affected by ZIKV infection at (E) 5 dpi (F) 3 dpi and (G) 7 dpi. Red and green represent up-regulation and down-regulation of protein expression, respectively. Abbreviations. dpi = Days post infection.
Figure 9
Figure 9
Western blot validation of proteomic changes detected by mass spectrometry (MS) analysis. Sertoli cell lysates were collected after ZIKV infection (MOI:3) at 3, 5 and 7 dpi. In total, 20 µg of proteins were separated by SDS-PAGE gel electrophoresis. (A) Expression of CLIC1, SPARC, STAT1, STAT3 and PSMA2 were detected by Western blot using specific antibodies. (B) Expression values of the proteins from Western-blot were quantified by ImageJ V1.8.0 from three replicates and plotted side-by-side to MS expression values. Expression of protein by Western blot was normalized to B-actin expression. Abbreviations: dpi = Days post infection; WB = Western blot; MS = Mass spectrometry; ZIKV = Zika virus.

Similar articles

Cited by

References

    1. Dick G.W.A., Kitchen S.F., Haddow A.J. Zika Virus (I). Isolations and serological specificity. Trans. R. Soc. Trop. Med. Hyg. 1952;46:509–520. doi: 10.1016/0035-9203(52)90042-4. - DOI - PubMed
    1. Shuaib W., Stanazai H., Abazid A.G., Mattar A.A. Re-Emergence of Zika Virus: A Review on Pathogenesis, Clinical Manifestations, Diagnosis, Treatment, and Prevention. Am. J. Med. 2016;129:879.e7–879.e12. doi: 10.1016/j.amjmed.2016.02.027. - DOI - PubMed
    1. Petersen L.R., Jamieson D.J., Powers A.M., Honein M.A. Zika Virus. N. Eng. J. Med. 2016;374:1552–1563. doi: 10.1056/NEJMra1602113. - DOI - PubMed
    1. Ferraris P., Yssel H., Missé D. Zika virus infection: An update. Microbes Infect. 2019;21:353–360. doi: 10.1016/j.micinf.2019.04.005. - DOI - PubMed
    1. Lessler J., Chaisson L.H., Kucirka L.M., Bi Q., Grantz K., Salje H., Carcelen A.C., Ott C.T., Sheffield J.S., Ferguson N.M., et al. Assessing the global threat from Zika virus. Science. 2016;353:6300. doi: 10.1126/science.aaf8160. - DOI - PMC - PubMed

Publication types