. 2022 Feb 15;14(2):403.
doi: 10.3390/v14020403.

Sensitivity of SARS-CoV-2 Life Cycle to IFN Effects and ACE2 Binding Unveiled with a Stochastic Model

Affiliations

Sensitivity of SARS-CoV-2 Life Cycle to IFN Effects and ACE2 Binding Unveiled with a Stochastic Model

Igor Sazonov et al. Viruses. .

Abstract

Mathematical modelling of infection processes in cells is of fundamental interest. It helps to understand the SARS-CoV-2 dynamics in detail and can be useful to define the vulnerability steps targeted by antiviral treatments. We previously developed a deterministic mathematical model of the SARS-CoV-2 life cycle in a single cell. Despite answering many questions, it certainly cannot accurately account for the stochastic nature of an infection process caused by natural fluctuation in reaction kinetics and the small abundance of participating components in a single cell. In the present work, this deterministic model is transformed into a stochastic one based on a Markov Chain Monte Carlo (MCMC) method. This model is employed to compute statistical characteristics of the SARS-CoV-2 life cycle including the probability for a non-degenerate infection process. Varying parameters of the model enables us to unveil the inhibitory effects of IFN and the effects of the ACE2 binding affinity. The simulation results show that the type I IFN response has a very strong effect on inhibition of the total viral progeny whereas the effect of a 10-fold variation of the binding rate to ACE2 turns out to be negligible for the probability of infection and viral production.

Keywords: Markov Chain Monte Carlo method; SARS-Cov-2; mathematical model; sensitivity analysis; stochastic processes; the ACE2 receptor; type I interferon (IFN); virus dynamics.


Conflict of interest statement

The authors declare no conflict of interest.

Figures

Figure 1
Figure 1
Biochemical scheme of the SARS-CoV-2 replication cycle. Targets of type I IFN-mediated inhibition of virus replication are marked.
Figure 2
Figure 2
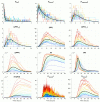
Examples of stochastic realisations for [Vfree](0)=10. The black curves indicate the solution of the deterministic model.
Figure 3
Figure 3
Normalised histograms for the released virions number for [Vfree](0)=5 (left) and [Vfree](0)=10 (right). The red line shows the approximation of the histogram by the Gamma distribution fitted to the histogram by the least squares method.
Figure 4
Figure 4
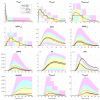
Evolution of the confidence intervals for all 12 species participating in the SARS-CoV-2 replication for [Vfree](0)=5. The green, red, and black lines indicate the mean, median, and the deterministic solution, respectively.
Figure 5
Figure 5
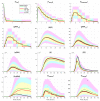
Evolution of the confidence intervals for all 12 components participating in the SARS-CoV-2 replication for [Vfree](0)=10. The green, red, and black lines indicate the mean, median, and the deterministic solution, respectively.
Figure 6
Figure 6
(Left) Dependence of confidence intervals, sample mean (green) and median (red) estimates, and the deterministic solution (black) on the initial number of free virions per cell [Vfree](0) at t=24 h. (Right) Probability for productive infection of the target cell in relation to the initial number of free virions per cell (MOI).
Figure 7
Figure 7
(Left) Kinetics of the total number of new virions secreted by an infected cell (dotted lines) for different MOIs (explained by the colour code) and the kinetics of virions release (solid lines) computed by the deterministic model [19]. (Right) The life cycle efficiency computed by the deterministic model (the red curve with circles). The mean, median, and the confidence intervals of the life cycle efficiency computed by the stochastic model (explained in the legend).
Figure 8
Figure 8
Local sensitivity indices for the number of released virions at 24 h computed with the stochastic model. The significant indices with greater values than the self-distance for the sets with baseline model parameters are marked by red.
Figure 9
Figure 9
Type I IFN-mediated effects on the probability of non-degenerate infection (left) and the efficient reproduction number for MOI ranging from 1 to 15 (right). The ascending/descending arrows in the legend show the four-fold increase/decrease in the indicated parameters.
Figure 10
Figure 10
Effect of binding of SARS-CoV-2 to ACE2 on the probability of non-degenerate infection (left) and the efficient reproduction number (right) for MOI ranging from 1 to 15. The ascending/descending arrows in the legend show the 10-fold increase/decrease in the indicated parameters.

References

    1. Bost P., Giladi A., Liu Y., Bendjelal Y., Xu G., David E., Blecher-Gonen R., Cohen M., Medaglia C., Li H., et al. Host-Viral Infection Maps Reveal Signatures of Severe COVID-19 Patients. Cell. 2020;181:1475–1488.e12. doi: 10.1016/j.cell.2020.05.006. - DOI - PMC - PubMed
    1. Vabret N., Britton G.J., Gruber C., Hegde S., Kim J., Kuksin M., Levantovsky R., Malle L., Moreira A., Park M.D., et al. Immunology of COVID-19: Current State of the Science. Immunity. 2020;52:910–941. doi: 10.1016/j.immuni.2020.05.002. - DOI - PMC - PubMed
    1. Raoult D., Zumla A., Locatelli F., Ippolito G., Kroemer G. Coronavirus infections: Epidemiological, clinical and immunological features and hypotheses. Cell Stress. 2020;4:66–75. doi: 10.15698/cst2020.04.216. - DOI - PMC - PubMed
    1. Ostaszewski M., Niarakis A., Mazein A., Kuperstein I., Phair R., Orta-Resendiz A., Singh V., Aghamiri S.S., Acencio M.L., Glaab E., et al. COVID-19 Disease Map Community, a computational knowledge repository of virus-host interaction mechanisms. Mol. Syst. Biol. 2021;17:e10387. doi: 10.15252/msb.202110387. - DOI - PMC - PubMed
    1. Bocharov G., Casella V., Argilaguet J., Grebennikov D., Güerri-Fernandez R., Ludewig B., Meyerhans A. Numbers Game and Immune Geography as Determinants of Coronavirus Pathogenicity. Front. Cell. Infect. Microbiol. 2020;10:559209. doi: 10.3389/fcimb.2020.559209. - DOI - PMC - PubMed

Publication types

Substances

LinkOut - more resources