. 2022 Feb 17;14(2):412.
doi: 10.3390/v14020412.

Phenotypic and Genetic Characterization of Aeromonas hydrophila Phage AhMtk13a and Evaluation of Its Therapeutic Potential on Simulated Aeromonas Infection in Danio rerio

Affiliations

Phenotypic and Genetic Characterization of Aeromonas hydrophila Phage AhMtk13a and Evaluation of Its Therapeutic Potential on Simulated Aeromonas Infection in Danio rerio

Nino Janelidze et al. Viruses. .

Abstract

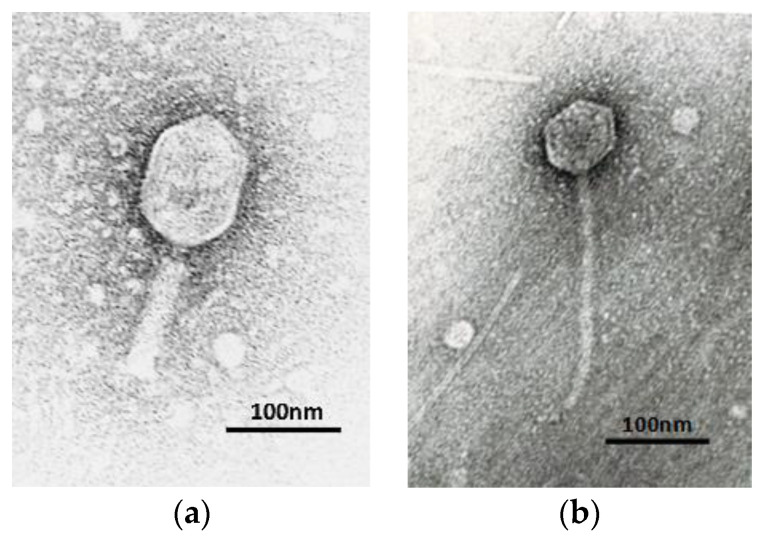
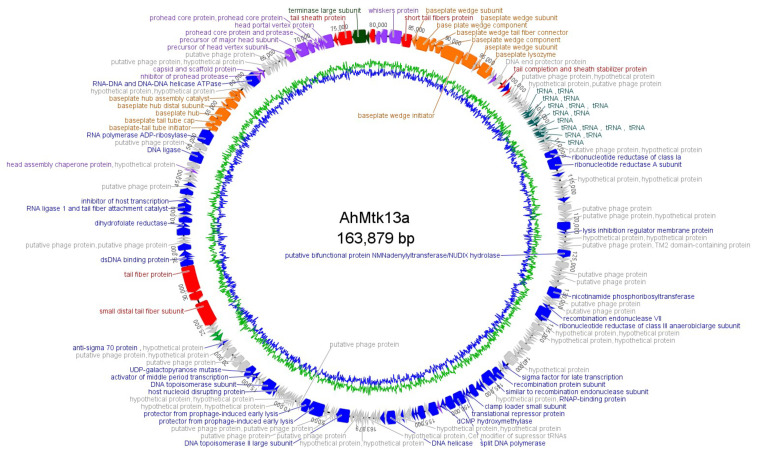
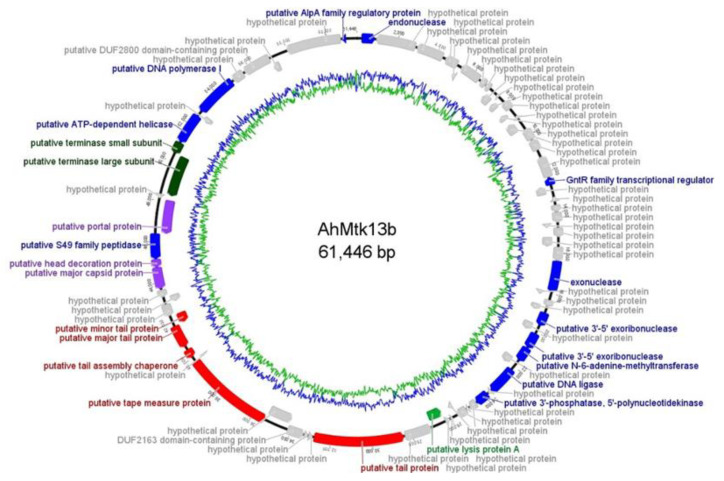
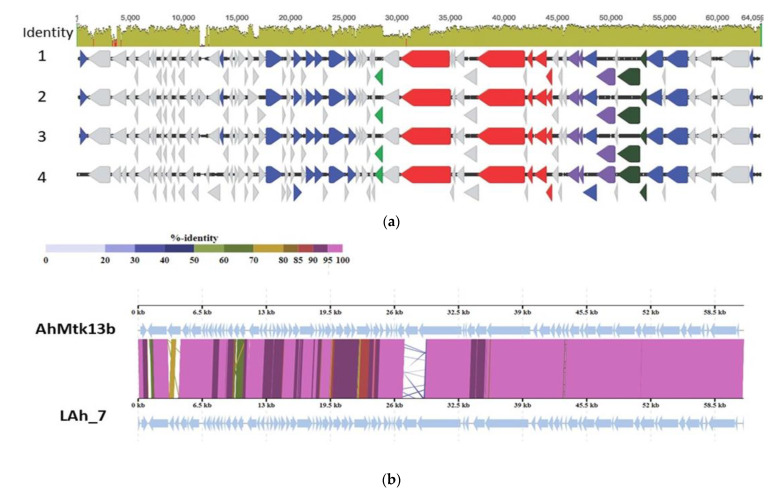
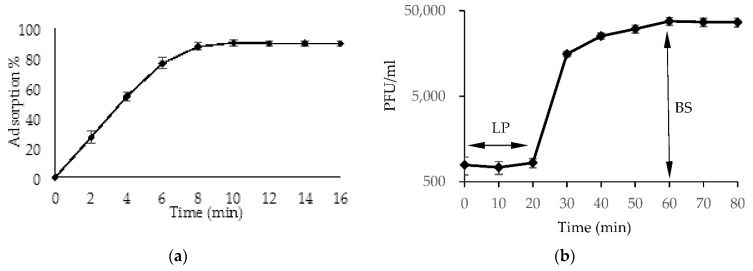
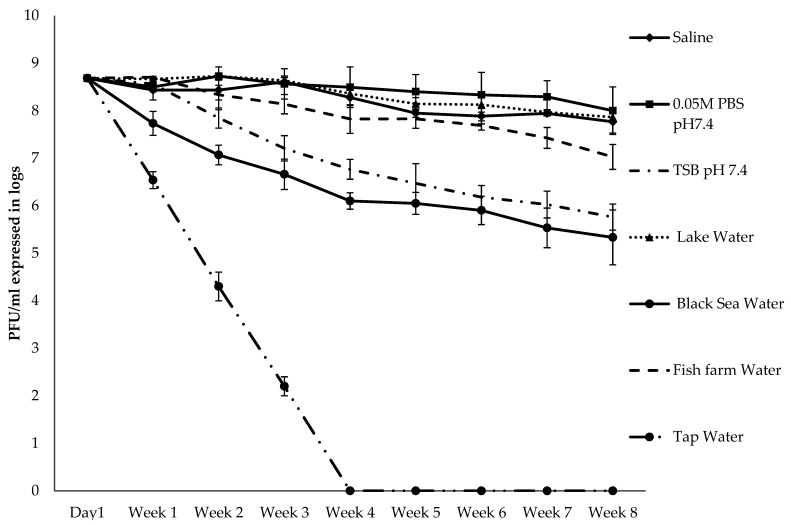
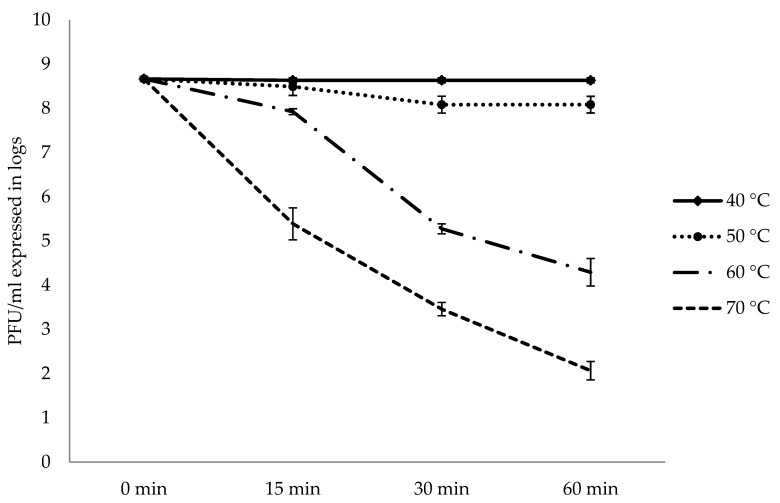
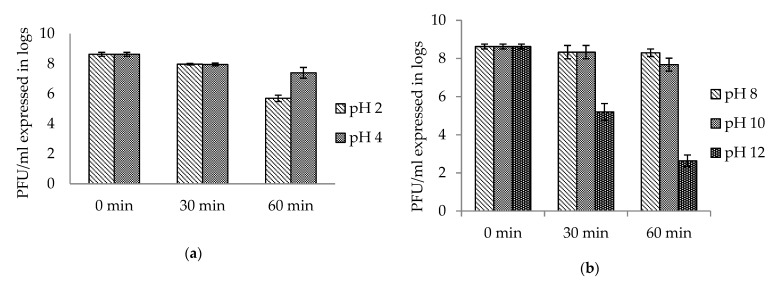
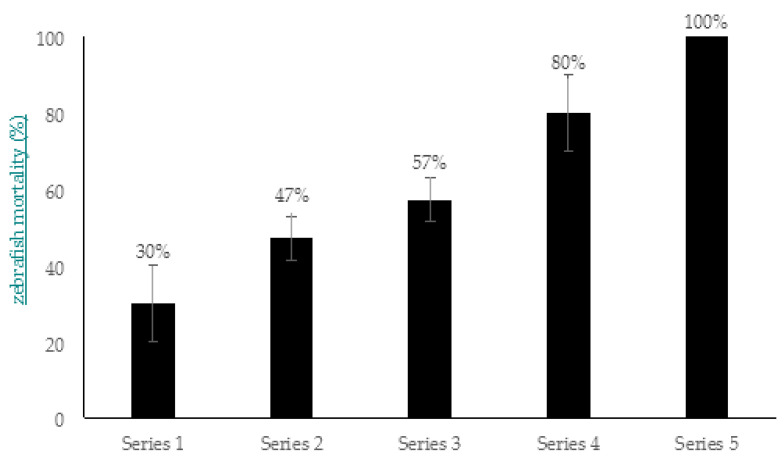
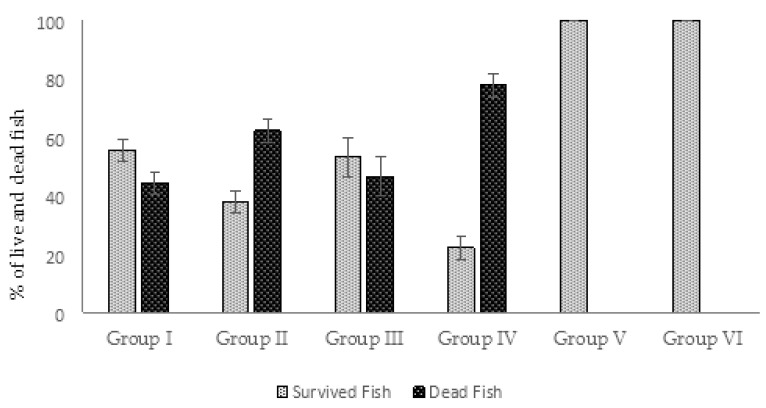
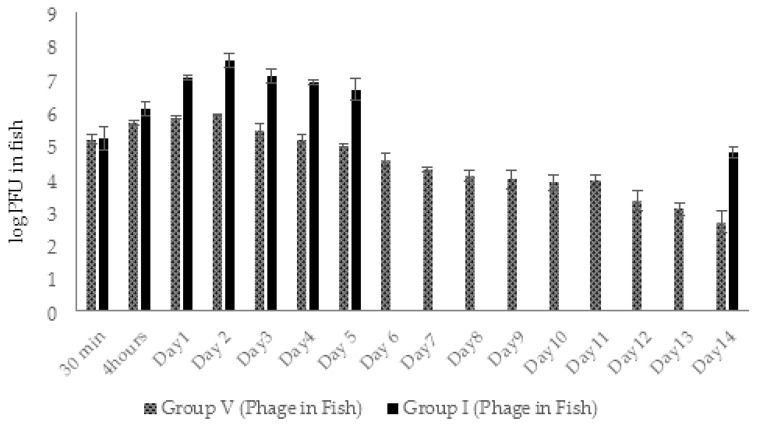
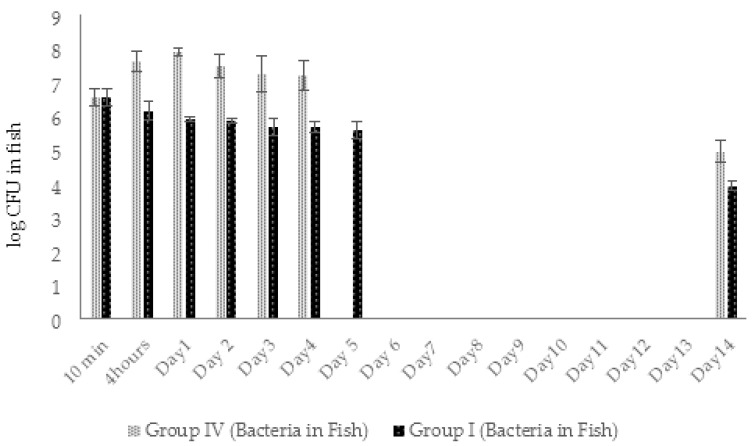
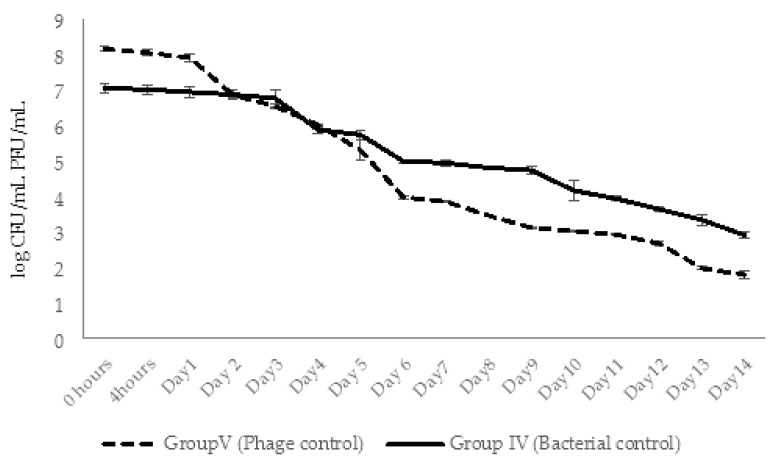
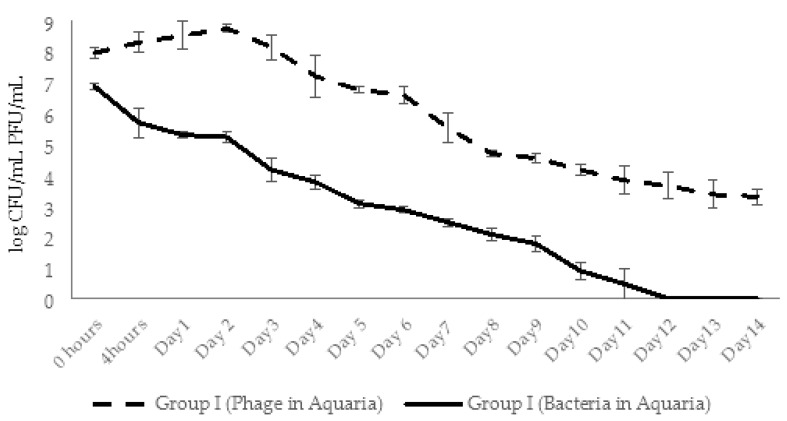
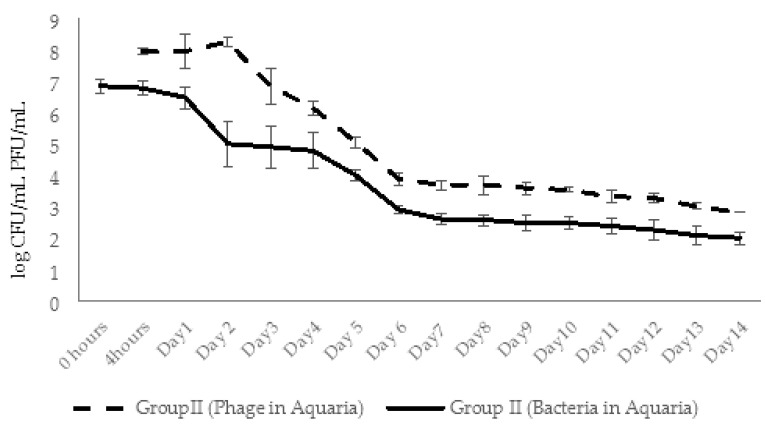
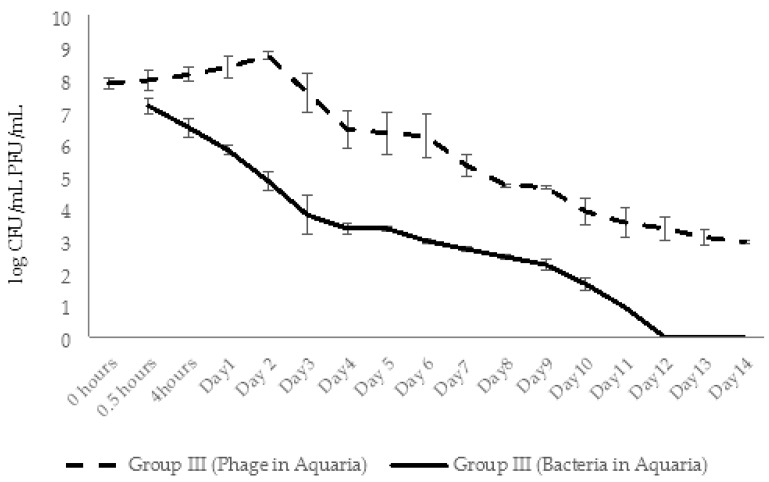
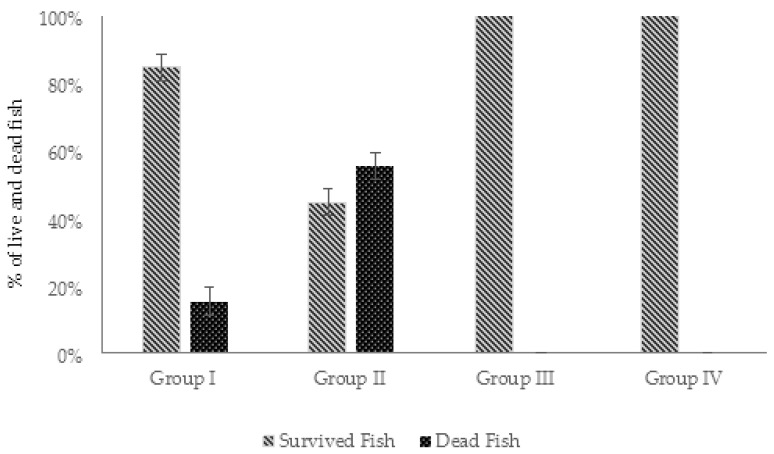
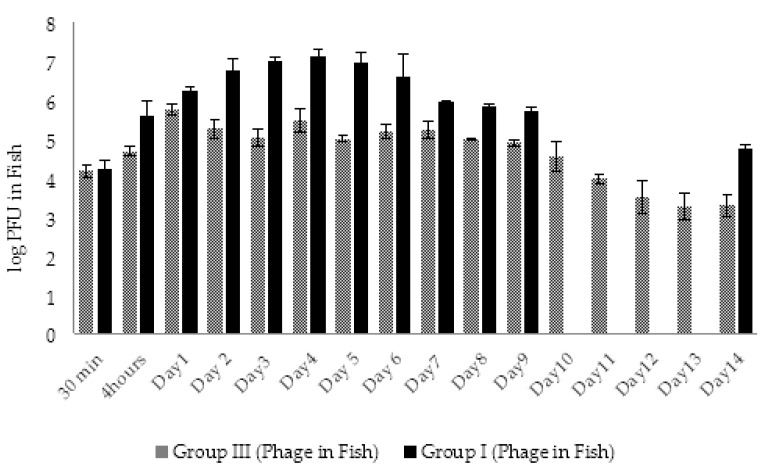
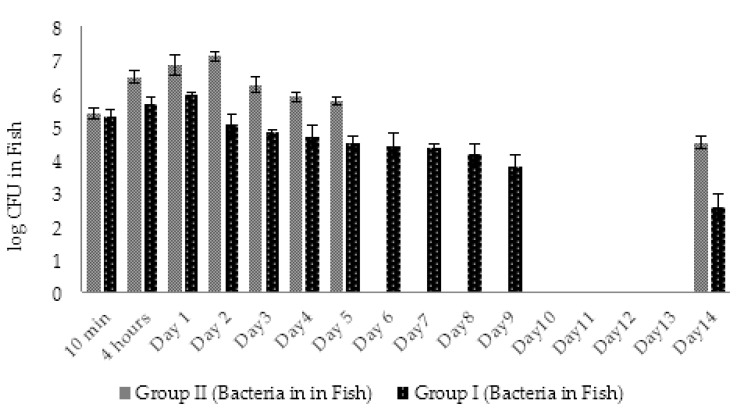
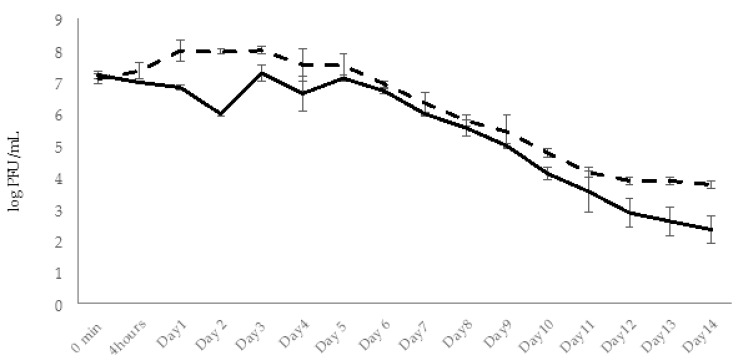
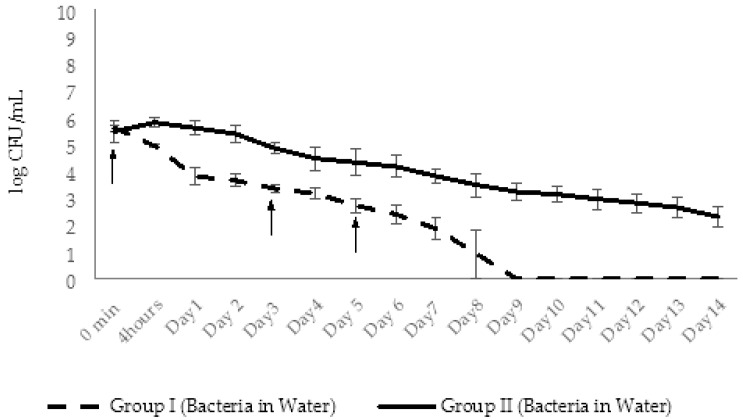
Phage therapy can be an effective alternative to standard antimicrobial chemotherapy for control of Aeromonas hydrophila infections in aquaculture. Aeromonas hydrophila-specific phages AhMtk13a and AhMtk13b were studied for basic biological properties and genome characteristics. Phage AhMtk13a (Myovirus, 163,879 bp genome, 41.21% CG content) was selected based on broad lytic spectrum and physiologic parameters indicating its lytic nature. The therapeutic potential of phage AhMtk13a was evaluated in experimental studies in zebrafish challenged with A. hydrophila GW3-10 via intraperitoneal injection and passive immersion in aquaria water. In experimental series 1 with single introduction of AhMtk13a phage to aquaria water at phage-bacteria ratio 10:1, cumulative mortality 44% and 62% was registered in fish exposed to phage immediately and in 4 h after bacterial challenge, correspondingly, compared to 78% mortality in the group with no added phage. In experimental series 2 with triple application of AhMtk13a phage at ratio 100:1, the mortality comprised 15% in phage-treated group compared to the 55% in the control group. Aeromonas hydrophila GW3-10 was not detectable in aquaria water from day 9 but still present in fish at low concentration. AhMtk13a phage was maintained in fish and water throughout the experiment at the higher concentration in infected fish.

Keywords: Aeromonas hydrophila; aquaculture; bacteriophage; phage genome; phage therapy; zebrafish.


Conflict of interest statement

The authors declare no conflict of interest.

Figures

Figure 1
Figure 1
Virion morphology of A. hydrophila-specific bacteriophages: (a) phage AhMtk13a; (b) phage AhMtk13b.
Figure 2
Figure 2
Phage AhMtk13a genome map.
Figure 3
Figure 3
Phylogenetic tree based on protein level constructed by VIP tree [24].
Figure 4
Figure 4
Phylogenetic trees of terminase large subunit, constructed with AhMtk13b, AhMtk13a and reference phages identified by BLASTP hits (e-value 0.0, identity >70%).
Figure 5
Figure 5
Genome map of AhMtk13b.
Figure 6
Figure 6
Genome comparison: (a) Comparative genome maps of AhMtk13b (1) and three Aeromonas phages ((2) BUCT551 (GeneBank: MT952005.1); (3) vB_AhyS-A18P4 (GeneBank: MN317029.1); (4) LAh_7 (GeneBank: MK838113.1)) ORFs are colored according to functions of the gene products: green—packaging module; purple—capsid morphogenesis module, red—tail morphogenesis module; light green—lysis module; blue—DNA metabolism and replication; (b) genome alignments of AhMtk13b and LAh_7 (GeneBank: MK838113.1).
Figure 7
Figure 7
(a) Adsorption curve of AhMtk13a phage. (b) Single-step growth curve of AhMtk13a phage. The results are the mean values of three independent tests. Standard deviations (SD) are indicated.
Figure 8
Figure 8
The survival of AhMtk13a phage in different liquid environments: saline, PBS, TSB, lake water, Black Sea water, fish farm water, and tap water. The results are the averages of three parallel experiments with geometric SD shown as the vertical lines.
Figure 9
Figure 9
The survival of AhMtk13a phage at different temperatures. The results are the averages of three parallel experiments with geometric SD shown as the vertical lines.
Figure 10
Figure 10
(a) Survival of AhMtk13a phage in acidic environment. (b) The survival of AhMtk13a phage in alkaline environment. The results are the averages of three parallel experiments with geometric SD shown as the vertical lines.
Figure 11
Figure 11
Mortality in zebrafish caused by different concentrations of A. hydrophila GW3-10 inoculated by intraperitoneal injection (0.1 mL) and exposed to the aquaria water containing ×107 CFU/mL A. hydrophila GW3-10. Series 1—fish engrafted with ×103 CFU/mL A. hydrophila GW3-10; Series 2—fish engrafted with ×105 CFU/mL A. hydrophila GW3-10; Series 3—fish engrafted with ×106 CFU/mL A. hydrophila GW3-10; Series 4—fish engrafted with ×107 CFU/mL A. hydrophila GW3-10; Series 5—fish engrafted with ×108 CFU/mL A. hydrophila GW3-10. The results are the averages of three parallel experiments with SD shown as the vertical lines.
Figure 12
Figure 12
Protective effect of AhMtk13a phage on zebrafish infected with A. hydrophila 3–10: survival and death rates (%) in different experimental groups. Group I—fish injected with A. hydrophila GW3-10, placed in the aquaria with the same bacteria added and immediately treated with the phage; Group II—fish injected with A. hydrophila GW3-10, placed in the aquaria with the same bacteria added and treated with the phage in 4 h after infection; Group III—fish exposed to phage AhMtk13a containing aquaria 30 min before intraperitoneal injection with A. hydrophila GW3-10 and adding the same pathogen to the aquaria water; Group IV (bacterial control)—fish injected with the A. hydrophila GW3-10 and kept in the aquaria containing the same bacterial pathogen; Group V (phage control)—fish injected with saline and placed in the aquaria containing the experimental phage only; Group VI (vehicle control)—fish received saline only through intraperitoneal injection. Neither phage nor bacteria were added to these aquaria. The results are the averages of three parallel experiments with SD shown as the vertical lines.
Figure 13
Figure 13
Dynamic changes in AhMtk13a phage concentration in phage-treated fish: Group I—fish injected with A. hydrophila GW3-10, placed in the aquaria with the same bacteria added and immediately treated with the phage; Group V (phage control)—fish injected with saline and placed in the aquaria containing the phage only. The results are the averages of three parallel experiments with geometric SD shown as the vertical lines.
Figure 14
Figure 14
Dynamic changes in A. hydrophila GW3-10 concentration in fish: Group I—fish injected with A. hydrophila GW3-10, placed in the aquaria with the same bacteria added and immediately treated with the AhMtk13a phage; Group IV (bacterial control)—fish injected with the A. hydrophila GW3-10 and kept in the aquaria containing the same bacterial pathogen. The results are the averages of three parallel experiments with geometric SD shown as the vertical lines.
Figure 15
Figure 15
Dynamic changes in the concentration of AhMtk13a phage in aquaria water: Group V (phage control)—fish injected with saline and placed in the aquaria containing the phage only; Group IV (bacterial control)—fish injected with the A. hydrophila GW3-10 and kept in the aquaria containing the same bacterial pathogen. The results are the averages of three parallel experiments with geometric SD shown as the vertical lines.
Figure 16
Figure 16
Dynamic changes in the concentration of AhMtk13a phage and A. hydrophila GW3-10 in aquaria water of experimental Group I—fish injected with A. hydrophila GW3-10, placed in the aquaria with the same bacteria added and immediately treated with the phage. The results are the averages of three parallel experiments with geometric SD shown as the vertical lines.
Figure 17
Figure 17
Dynamic changes in the concentration of AhMtk13a phage and A. hydrophila GW3-10 in aquaria water of experimental Group II—fish injected with A. hydrophila GW3-10, placed in the aquaria with the same bacteria added and treated with the phage in 4 h after infection. The results are the averages of three parallel experiments with geometric SD shown as the vertical lines.
Figure 18
Figure 18
Dynamic changes in the concentration of AhMtk13a phage and A. hydrophila GW3-10 in aquaria water of experimental Group III—fish exposed to phage AhMtk13a containing aquaria 30 min before intraperitoneal injection with A. hydrophila GW3-10 and adding the same pathogen to the aquaria water. The results are the averages of three parallel experiments with geometric SD shown as the vertical lines.
Figure 19
Figure 19
Protective effect of AhMtk13a phage on zebrafish infected with A. hydrophila 3-10. Survival and death rates (%) in different experimental groups: Group I—fish injected with A. hydrophila GW3-10, placed in the aquaria with the same bacteria added and immediately treated with the phage; Group II (bacterial control)—fish injected with the A. hydrophila GW3-10 and kept in the aquaria containing the same bacterial pathogen; Group III (phage control)—fish injected with saline and placed in the aquaria containing the AhMtk13a phage only; Group IV (vehicle control)—fish received saline only through intraperitoneal injection. Neither phage nor bacteria were added to these aquaria. The results are the averages of three parallel experiments with SD shown as the vertical lines.
Figure 20
Figure 20
Dynamic changes in AhMtk13a phage concentration in phage-treated fish: Group I—fish injected with A. hydrophila GW3-10, placed in the aquaria with the same bacteria added and immediately treated with the phage; Group III (phage control)—fish injected with saline and placed in the aquaria containing the phage only. The results are the averages of three parallel experiments with geometric SD shown as the vertical lines.
Figure 21
Figure 21
Dynamic changes in A. hydrophila GW3-10 concentration in fish: Group I—fish injected with A. hydrophila GW3-10, placed in the aquaria with the same bacteria added and immediately treated with the AhMtk13a phage; Group II (bacterial control)—fish injected with the A. hydrophila GW3-10 and kept in the aquaria containing the same bacterial pathogen. The results are the averages of three parallel experiments with geometric SD shown as the vertical lines.
Figure 22
Figure 22
Dynamic changes in AhMtk13a phage survival in aquaria water: Group I—fish injected with A. hydrophila GW3-10, placed in the aquaria with the same bacteria added and immediately treated with the phage; Group III—fish injected with saline and placed in the aquaria containing the experimental phage only. The results are the averages of three parallel experiments with geometric SD shown as the vertical lines.
Figure 23
Figure 23
Dynamic changes in A. hydrophila GW3-10 counts in aquaria water: Group I—fish injected with A. hydrophila GW3-10, placed in the aquaria with the same bacteria added and immediately treated with the phage; Group II (bacterial control)—fish injected with the A. hydrophila GW3-10 and kept in the aquaria containing the same bacterial pathogen. The arrows indicate the application of AhMtk13a phage to group I aquaria. The results are the averages of three parallel experiments with geometric SD shown as the vertical lines.

References

    1. FAO . The State of World Fisheries and Aquaculture. FAO; Rome, Italy: 2018. Meeting the Sustainable Development Goals.
    1. EUGeorgia Fisheries and Aquaculture in Georgia (Industry Research) 2020. [(accessed on 13 December 2021)]. Available online: http://eugeorgia.info/en/article/832/fisheries-and-aquaculture-in-georgi....
    1. Aly D.S.M. A Review of Fish Diseases in the Egyptian Aquaculture Sector. CGIAR; Montpellier, France: 2013. Working Report. 41.
    1. Chandrarathna H.P.S.U., Nikapitiya C., Dananjaya S.H.S., De Silva B.C.J., Heo G.-J., De Zoysa M., Lee J. Isolation and Characterization of Phage AHP-1 and Its Combined Effect with Chloramphenicol to Control, Aeromonas hydrophila. Braz. J. Microbiol. 2020;51:409–416. doi: 10.1007/s42770-019-00178-z. - DOI - PMC - PubMed
    1. Chandrarathna H.P.S.U., Nikapitiya C., Dananjaya S.H.S., Wijerathne C.U.B., Wimalasena S.H.M.P., Kwun H.J., Heo G.-J., Lee J., De Zoysa M. Outcome of Co-Infection with Opportunistic and Multidrug Resistant Aeromonas hydrophila and A. veronii in Zebrafish: Identification, Characterization, Pathogenicity and Immune Responses. Fish Shellfish Immunol. 2018;80:573–581. doi: 10.1016/j.fsi.2018.06.049. - DOI - PubMed

Publication types

LinkOut - more resources