. 2022 Feb 10;23(4):1967.
doi: 10.3390/ijms23041967.

Lysophosphatidic Acid Promotes the Expansion of Cancer Stem Cells via TRPC3 Channels in Triple-Negative Breast Cancer

Affiliations

Lysophosphatidic Acid Promotes the Expansion of Cancer Stem Cells via TRPC3 Channels in Triple-Negative Breast Cancer

Naoya Hirata et al. Int J Mol Sci. .

Abstract

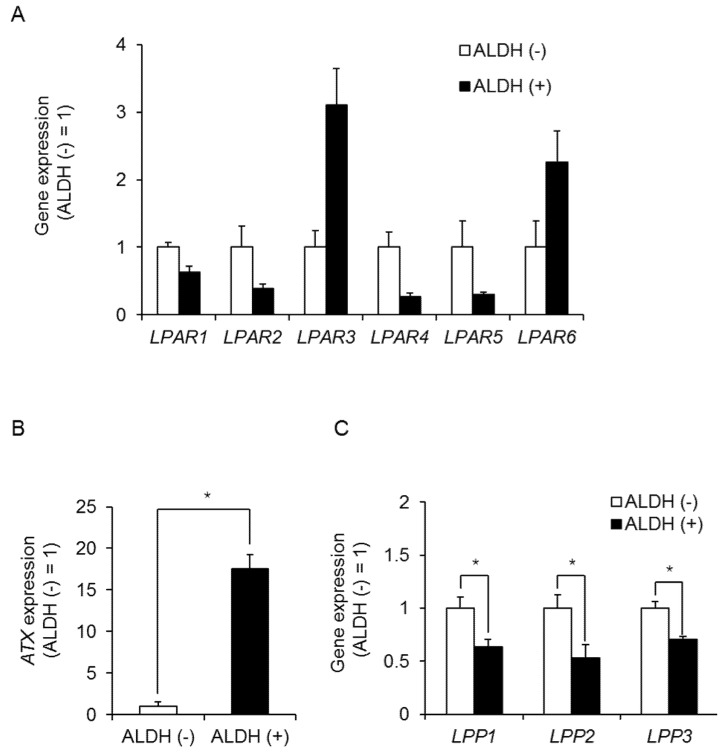
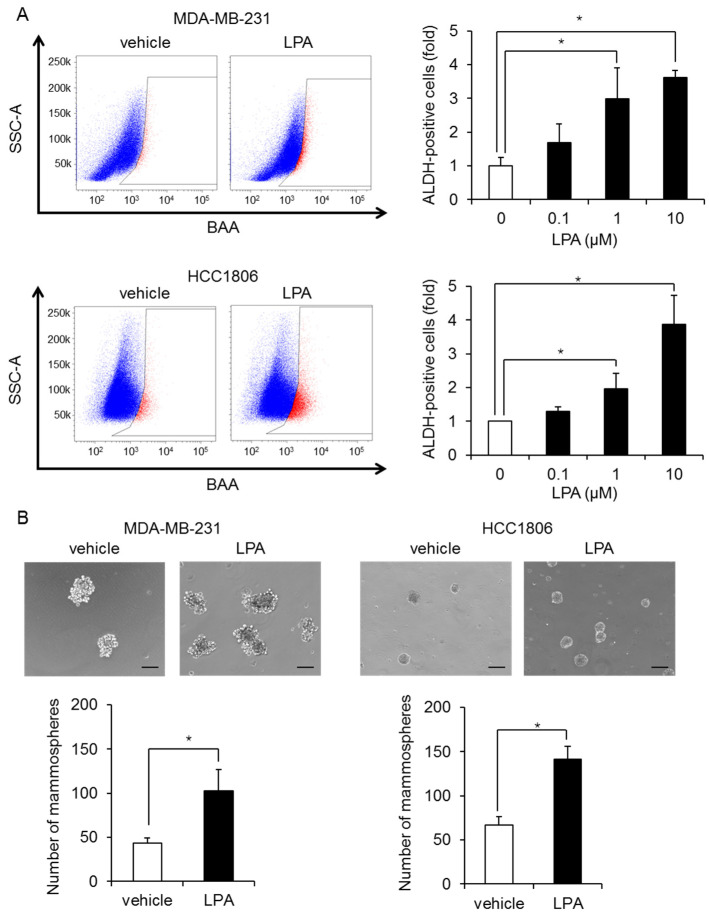
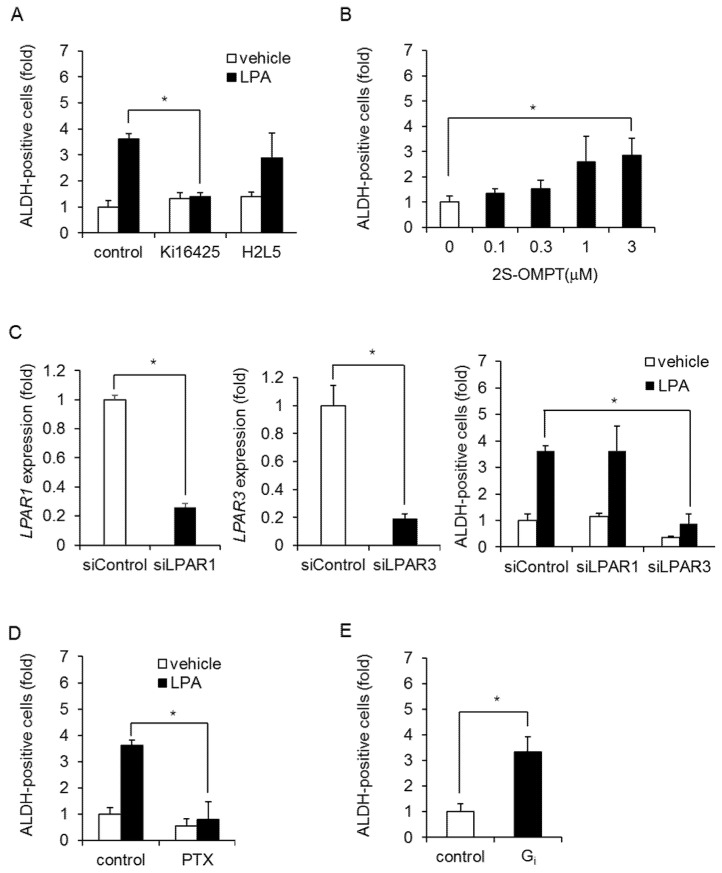
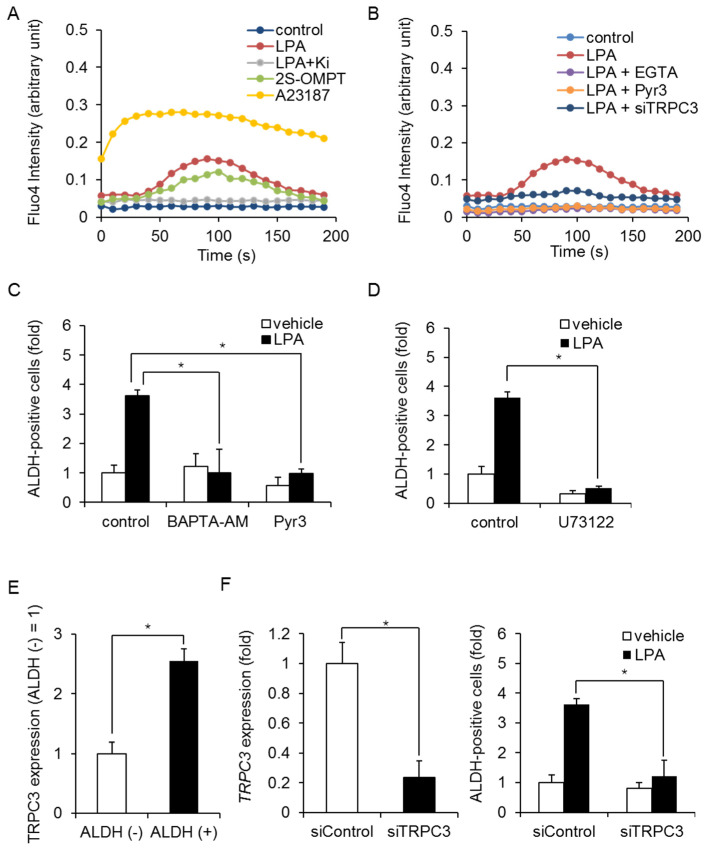
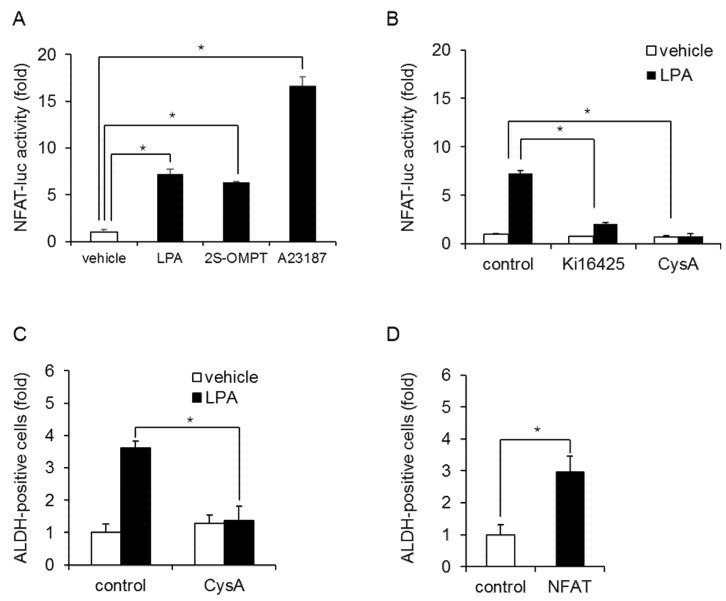
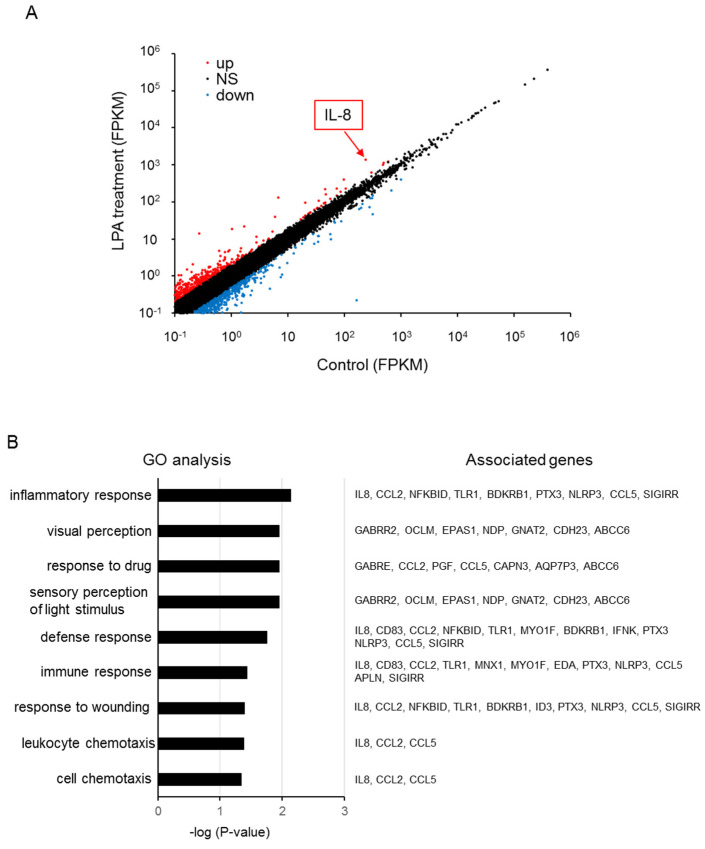
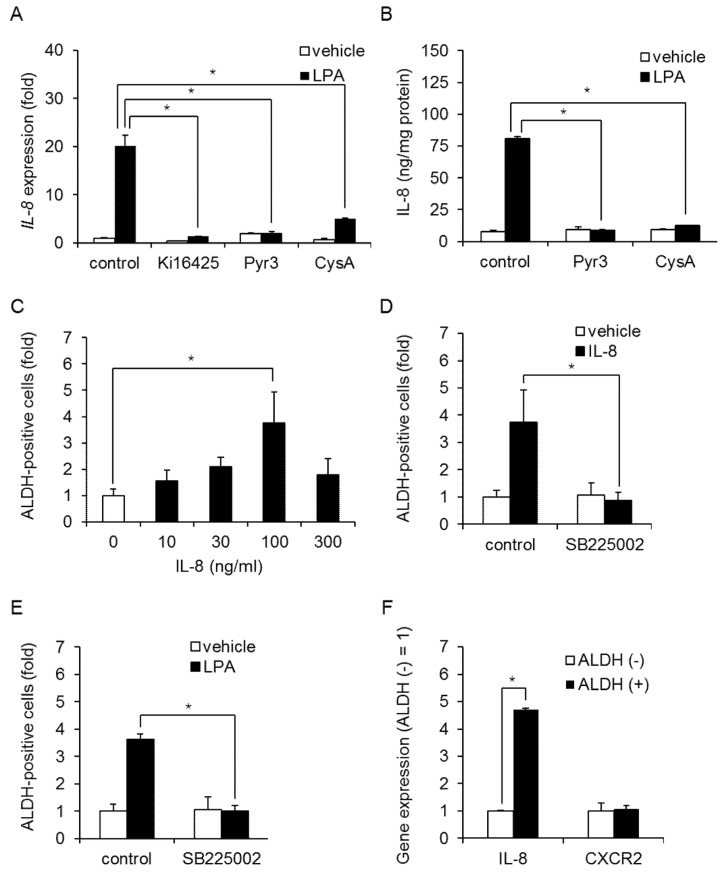
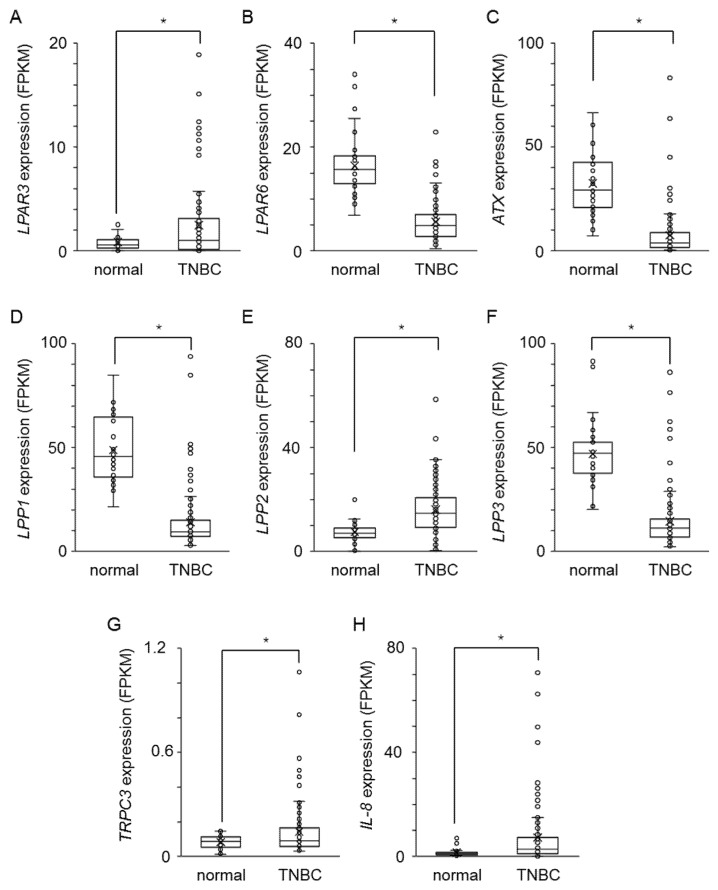
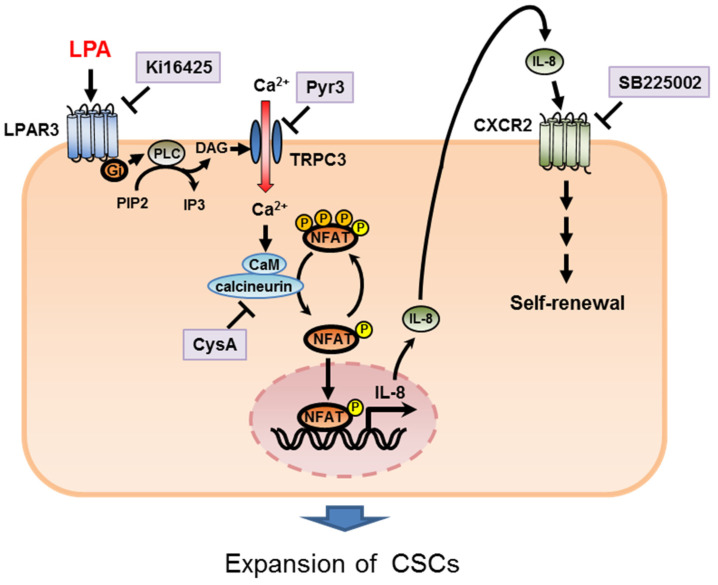
Triple-negative breast cancer (TNBC) is a highly aggressive cancer for which targeted therapeutic agents are limited. Growing evidence suggests that TNBC originates from breast cancer stem cells (BCSCs), and elucidation of the molecular mechanisms controlling BCSC proliferation will be crucial for new drug development. We have previously reported that the lysosphingolipid sphingosine-1-phosphate mediates the CSC phenotype, which can be identified as the ALDH-positive cell population in several types of human cancer cell lines. In this study, we have investigated additional lipid receptors upregulated in BCSCs. We found that lysophosphatidic acid (LPA) receptor 3 was highly expressed in ALDH-positive TNBC cells. The LPAR3 antagonist inhibited the increase in ALDH-positive cells after LPA treatment. Mechanistically, the LPA-induced increase in ALDH-positive cells was dependent on intracellular calcium ion (Ca2+), and the increase in Ca2+ was suppressed by a selective inhibitor of transient receptor potential cation channel subfamily C member 3 (TRPC3). Moreover, IL-8 production was involved in the LPA response via the activation of the Ca2+-dependent transcriptional factor nuclear factor of activated T cells. Taken together, our findings provide new insights into the lipid-mediated regulation of BCSCs via the LPA-TRPC3 signaling axis and suggest several potential therapeutic targets for TNBC.

Keywords: cancer stem cells; lysophosphatidic acid; nuclear factor of activated T cells; transient receptor potential cation channel subfamily C member 3; triple-negative breast cancer.


Conflict of interest statement

The authors declare that there are no conflict of interest.

Figures

Figure 1
Figure 1
Role of the LPA receptor in ALDH-positive MDA-MB-231 cells. (A) LPA receptor expression in ALDH-positive and -negative MDA-MB-231 cells by qPCR. Data represent the mean ± s.d. (n = 3). (B) ATX expression in ALDH-positive and ALDH-negative cells in MDA-MB-231 cells by qPCR. Data represent the mean ± s.d. (n = 3). (C) LPP expression in ALDH-positive and ALDH-negative cells in MDA-MB-231 cells by qPCR. Data represent the mean ± s.d. (n = 3). * p < 0.05.
Figure 2
Figure 2
LPA increases the number of BCSCs in MDA-MB-231 cells and HCC1806 cells. (A) Representative flow data from MDA-MB-231 cells and HCC1806 cells treated for 3 days with or without 10 µM LPA (left). Dose-dependent effect of LPA on ALDH-positive cells (right). Data represent the mean ± s.d. (n = 3). (B) Effects of 10 µM LPA on the mammosphere-forming efficiency of MDA-MB-231 cells and HCC1806 cells. The number of mammospheres was counted using a microscope. The scale bar indicates 100 µm. Data represent the mean ± s.d. (n = 3). * p < 0.05.
Figure 3
Figure 3
LPA increases ALDH-positive cells via LPAR3/Gi signaling in MDA-MB-231 cells. (A) Effects of LPAR1/3 and LPAR2 antagonists (Ki16425 and H2L5186303, respectively; both 10 µM) on the number of ALDH-positive cells after LPA treatment. Data represent the mean ± s.d. (n = 3). (B) Effect of the LPAR3 agonist 2S-OMPT on the number of ALDH-positive cells. Data represent the mean ± s.d. (n = 3). (C) Depletion of LPAR1 or LPAR3 with siRNA. Effect of LPAR1 or LPAR3 siRNA on the LPA-induced increase in ALDH-positive cells. Data represent the mean ± s.d. (n = 3). (D) Effect of PTX (100 ng/mL) on the number of ALDH-positive cells after LPA treatment. Data represent the mean ± s.d. (n = 3). (E) Effects of constitutively active mutants of Gi on the number of ALDH-positive cells. Data represent the mean ± s.d. (n = 3). * p < 0.05.
Figure 4
Figure 4
LPA-induced Ca2+ signaling in MDA-MB-231 cells. (A) After stimulation with LPA (10 µM) or 2S-OMPT (3 µM), intracellular Ca2+ in bulk cells was measured using Fluo-4. Effect of Ki16425 (Ki; 10 µM) on the LPA-induced increase in Ca2+ influx. A23187 (10 µM) was used as positive control. (B) Effects of EGTA (1 mM), Pyr3 (1 µM), and TRPC3 siRNA on the LPA-induced increase in Ca2+ influx. (C) Effects of BAPTA-AM (1 µM) and Pyr3 (1 µM) on the LPA-induced increase in ALDH-positive cells. Data represent the mean ± s.d. (n = 3). (D) Effect of U73122 (3 µM) on the LPA-induced increase in ALDH-positive cells. Data represent the mean ± s.d. (n = 3). (E) TRPC3 expression in ALDH-positive and ALDH-negative cells by qPCR. Data represent the mean ± s.d. (n = 3). (F) Depletion of TRPC3 with siRNA (left). Effect of TRPC3 siRNA on the LPA-induced increase in ALDH-positive cells (right). Data represent the mean ± s.d. (n = 3). * p < 0.05.
Figure 5
Figure 5
LPA-induced NFAT activation in MDA-MB-231 cells. (A) MDA-MB-231 cells transfected with a reporter plasmid encoding NFAT-luc were cultured with or without LPA (10 µM) or 2S-OMPT (3 µM) for 24 h and then analyzed by luciferase assays. A23187 (10 µM, 24 h) was used as positive control. Data represent the mean ± s.d. (n = 3). (B) Effect of Ki16425 (10 µM) or CysA (10 µM) on LPA-induced NFAT activation. Data represent the mean ± s.d. (n = 3). (C) Effect of CysA (10 µM) on LPA-induced increases in ALDH-positive cells. Data represent the mean ± s.d. (n = 3). (D) Effects of overexpression of NFAT on the number of ALDH-positive cells. Data represent the mean ± s.d. (n = 3). * p < 0.05.
Figure 6
Figure 6
RNA-seq analysis of LPA-treated MDA-MB-231 cells. (A) Scatterplot showing the LPA-upregulated (red) and downregulated (blue) transcripts. (B) Gene ontology enrichment analysis of upregulated protein-coding genes.
Figure 7
Figure 7
Role of IL-8 on LPA-induced increases in ALDH-positive cells in TNBC cells. (A) Effect of Ki16425 (10 µM), Pyr3 (1 µM), or CysA (10 µM) on LPA-induced IL-8 expression in MDA-MB-231 cells. Data represent the mean ± s.d. (n = 3). (B) Effect of Pyr3 (1 µM) or CysA (10 µM) on LPA-induced IL-8 secretion in MDA-MB-231 cells. The IL-8 content of the conditioned medium was measured by ELISA. Data represent the mean ± s.d. (n = 3). (C) Effect of IL-8 on the proportion of ALDH-positive cells in MDA-MB-231 cells. Data represent the mean ± s.d. (n = 3). (D) Effect of the IL-8 receptor antagonist SB225002 (1 µM) on the IL-8-induced proportion of ALDH-positive cells in MDA-MB-231 cells. Data represent the mean ± s.d. (n = 3). (E) Effect of the IL-8 receptor antagonist SB225002 (1 µM) on the LPA-induced proportion of ALDH-positive cells in MDA-MB-231 cells. Data represent the mean ± s.d. (n = 3). (F) IL-8 and CXCR2 expression in ALDH-positive and ALDH-negative cells by qPCR. Data represent the mean ± s.d. (n = 3). * p < 0.05.
Figure 8
Figure 8
The clinical relevance of LPA signaling factors in human TNBC tissues. Expression level (FPKM) of LPAR3 (A), LPAR6 (B), ATX (C), LPP1 (D), LPP2 (E), LPP3 (F), TRPC3 (G), and IL-8 (H) in normal breast tissues (n = 38) and TNBC tissues (n = 115). * p < 0.05.
Figure 9
Figure 9
The effect of LPA signaling factors on the prognosis of TNBC patients. Distant metastasis free-survival of TNBC patients (n = 424) was analyzed using Kaplan–Meier Plotter (https://kmplot.com/analysis/index.php?p=background, accessed on 7 February 2022) according to expression of LPAR3 (A), LPAR6 (B), ATX (C), LPP1 (D), LPP2 (E), LPP3 (F), TRPC3 (G) and IL8 (H). The TNBC patient samples were divided into high expression and low expression groups by median. Hazard ratio (HR) and logrank P value are indicated in each panel.
Figure 10
Figure 10
A working model of the functions of LPA/LPAR3/TRPC3 in CSC regulation.

Similar articles

Cited by

References

    1. Ferlay J., Soerjomataram I., Dikshit R., Eser S., Mathers C., Rebelo M., Parkin D.M., Forman D., Bray F. Cancer Incidence and Mortality Worldwide: Sources, methods and major patterns in GLOBOCAN 2012. Int. J. Cancer. 2015;136:E359–E386. doi: 10.1002/ijc.29210. - DOI - PubMed
    1. Yeh J., Chun J., Schwartz S., Wang A., Kern E., Guth A.A., Axelrod D., Shapiro R., Schnabel F. Clinical Characteristics in Patients with Triple Negative Breast Cancer. Int. J. Breast Cancer. 2017;2017:1–5. doi: 10.1155/2017/1796145. - DOI - PMC - PubMed
    1. Dagogo-Jack I., Shaw A.T. Tumour heterogeneity and resistance to cancer therapies. Nat. Rev. Clin. Oncol. 2018;15:81–94. doi: 10.1038/nrclinonc.2017.166. - DOI - PubMed
    1. Bonnet D., Dick J.E. Human acute myeloid leukemia is organized as a hierarchy that originates from a primitive hematopoietic cell. Nat. Med. 1997;3:730–737. doi: 10.1038/nm0797-730. - DOI - PubMed
    1. Al-Hajj M., Wicha M.S., Benito-Hernandez A., Morrison S.J., Clarke M.F. Prospective identification of tumorigenic breast cancer cells. Proc. Natl. Acad. Sci. USA. 2003;100:3983–3988. doi: 10.1073/pnas.0530291100. - DOI - PMC - PubMed

MeSH terms

LinkOut - more resources