. 2022 Feb 14;23(4):2099.
doi: 10.3390/ijms23042099.

Conservation and Divergence of SQUAMOSA-PROMOTER BINDING PROTEIN-LIKE (SPL) Gene Family between Wheat and Rice

Affiliations

Conservation and Divergence of SQUAMOSA-PROMOTER BINDING PROTEIN-LIKE (SPL) Gene Family between Wheat and Rice

Li Li et al. Int J Mol Sci. .

Abstract

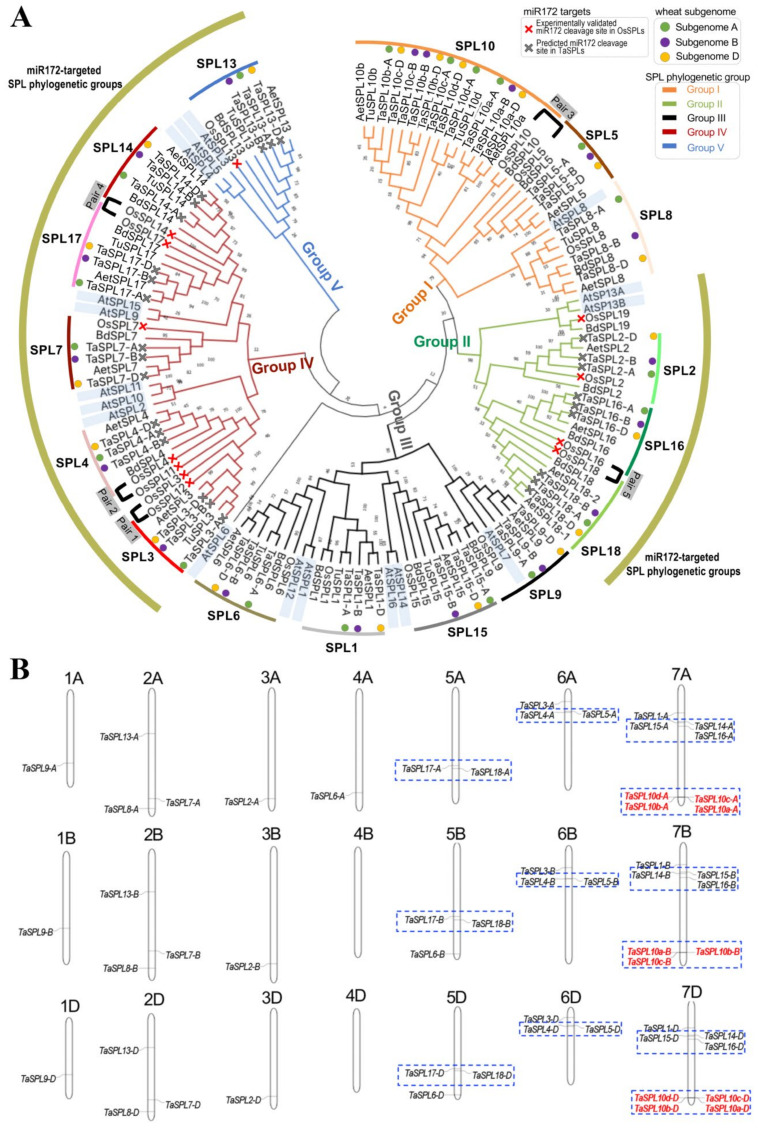
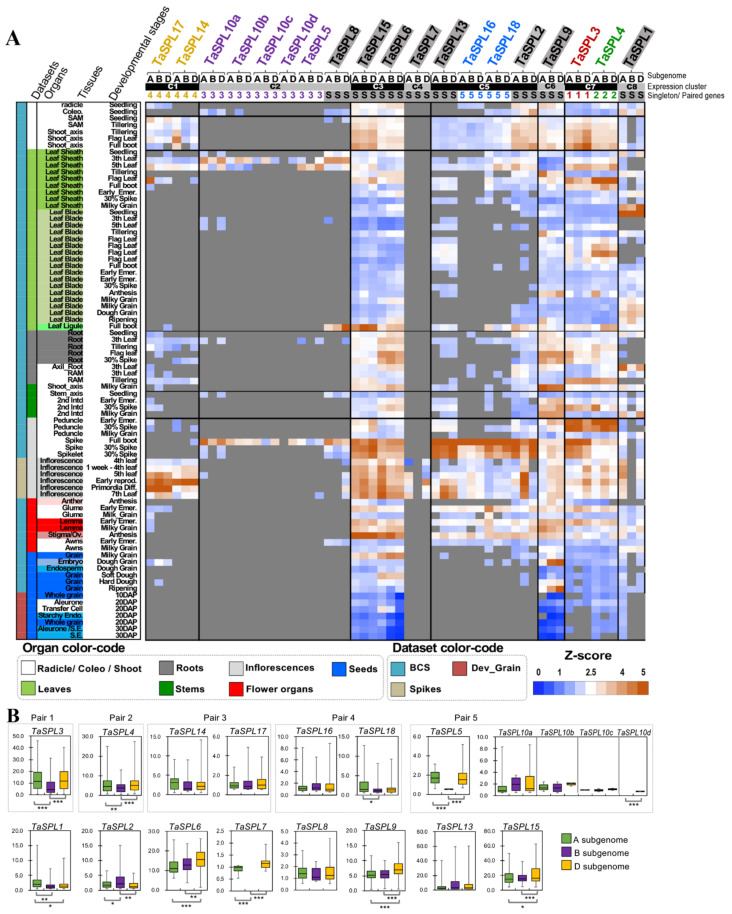
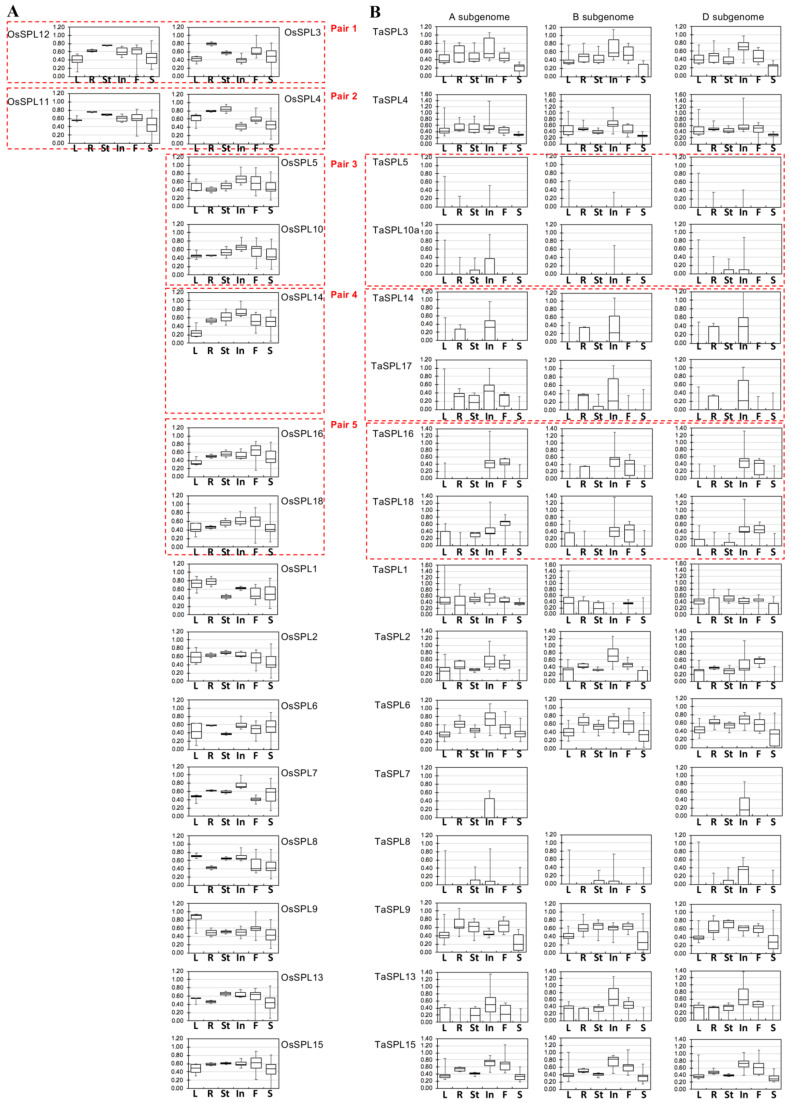
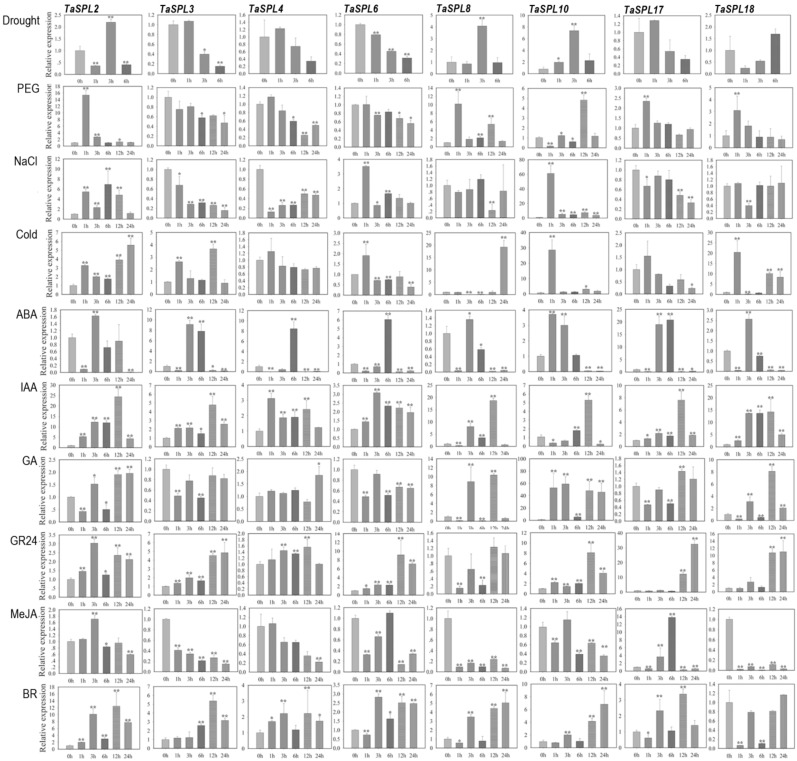
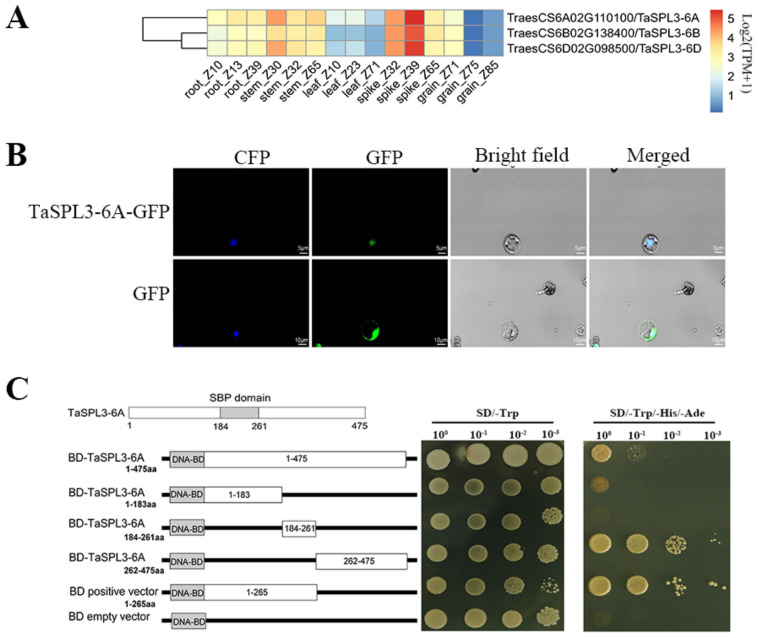
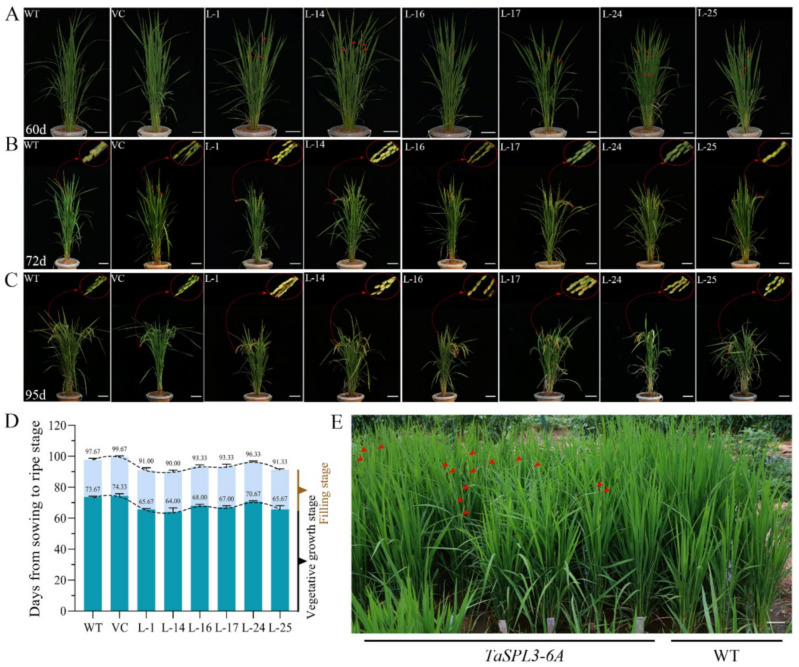
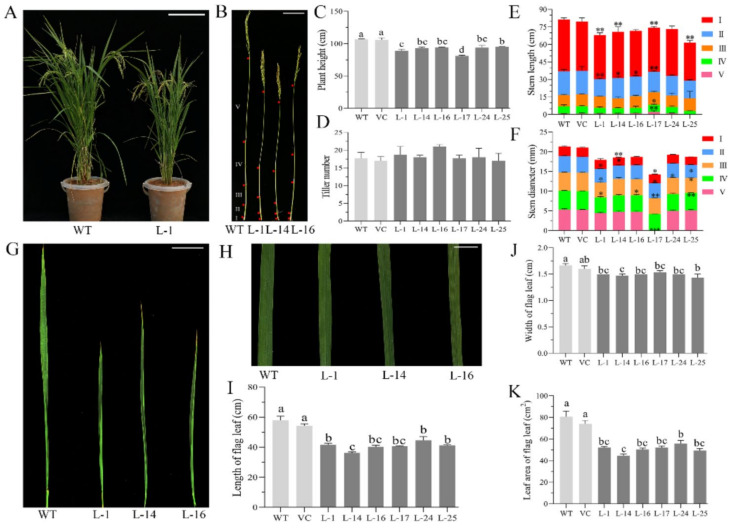
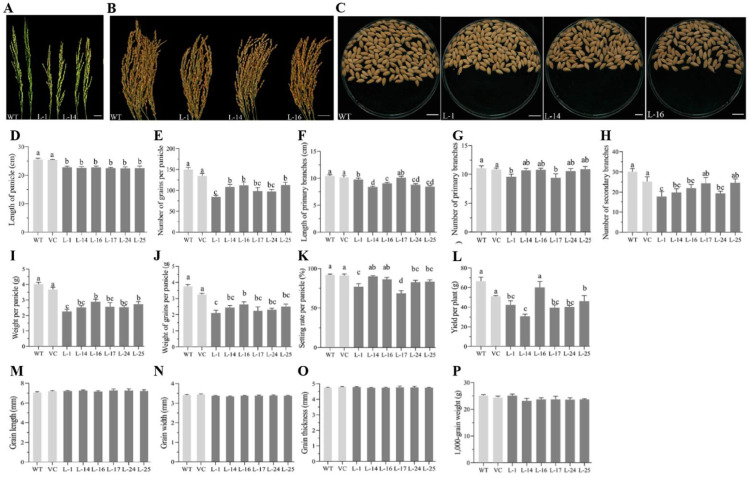
The SQUAMOSA-PROMOTER BINDING PROTEIN-LIKE (SPL) gene family affects plant architecture, panicle structure, and grain development, representing key genes for crop improvements. The objective of the present study is to utilize the well characterized SPLs' functions in rice to facilitate the functional genomics of TaSPL genes. To achieve these goals, we combined several approaches, including genome-wide analysis of TaSPLs, comparative genomic analysis, expression profiling, and functional study of TaSPL3 in rice. We established the orthologous relationships of 56 TaSPL genes with the corresponding OsSPLs, laying a foundation for the comparison of known SPL functions between wheat and rice. Some TaSPLs exhibited different spatial-temporal expression patterns when compared to their rice orthologs, thus implicating functional divergence. TaSPL2/6/8/10 were identified to respond to different abiotic stresses through the combination of RNA-seq and qPCR expression analysis. Additionally, ectopic expression of TaSPL3 in rice promotes heading dates, affects leaf and stem development, and leads to smaller panicles and decreased yields per panicle. In conclusion, our work provides useful information toward cataloging of the functions of TaSPLs, emphasized the conservation and divergence between TaSPLs and OsSPLs, and identified the important SPL genes for wheat improvement.

Keywords: Oryza sativa; SQUAMOSA-PROMOTER BINDING PROTEIN-LIKE (SPL) gene; Triticum aestivum; conservation and divergence; expression patterns; genome-wide analysis.


Conflict of interest statement

The authors declare no conflict of interest. The funders had no role in the design of the study; in the collection, analyses, or interpretation of data; in the writing of the manu-script, or in the decision to publish the results.

Figures

Figure 1
Figure 1
Phylogenetic analysis of TaSPLs highlighting the orthologous relationship between OsSPLs and TaSPLs: (A) Phylogenetic tree constructed by maximum-likelihood method grouped TaSPLs together with their orthologs in rice, providing results consistent with the syntenic analysis of SPL genes between rice and wheat (Figure S2, Table S1); (B) diagram of the chromosomal locations of TaSPL genes, identifying several TaSPL clusters and gene expansion at the TaSPL10 locus driven by tandem duplications. TaSPL gene clusters are shown by blue boxes and the tandemly duplicated genes of TaSPL10 are highlighted in red.
Figure 2
Figure 2
Expression analyses of TaSPLs emphasizing the divergence of some TaSPLs, in terms of spatial–temporal expression patterns: (A) RNA-seq based expression of TaSPLs. Each column represents a TaSPL gene, and each row represents an RNA-seq sample, with the RNA-seq data sets, tissues, and stages labeled on the left. A, B, D indicate the sub-genome that each TaSPL gene is located on. In Figure 1A, singleton TaSPLs are shaded in gray, while evolutionarily paired TaSPLs are highlighted using colors, with red, green, gold, blue, and purple indicating Pair 1, Pair 2, Pair 3, Pair 4, and Pair 5, respectively. The TaSPL genes are row-clustered into eight clusters (namely, C1–C8) based on their expression similarity, as determined by the k-mean clustering method; (B) comparison of expression between each set of TaSPL homeologous copies, identifying multiple TaSPL genes with sub-genome expression biases. The Y-axis indicates the gene expression levels (as TPM). Statistical significance of sub-genome expression biases (SEB) for each TaSPL gene was determined by two-tailed Student’s t-test, with *, **, and *** representing p < 0.05, p < 0.01, and p < 0.005, respectively (details in Method Section 4.5).
Figure 3
Figure 3
Summarized expression patterns of OsSPLs (A) and their orthologous TaSPLs (B). The SPL genes are listed first by paleoduplicated pairs and then singletons, with the duplicated pairs of SPLs indicated in red boxes. OsSPL expression profiles are from microarray data (Figure S7) and summarized in terms of tissues (L: leaves; R: roots; St: stems; In: inflorescence; F: flower organs; S: seed tissues), while the TaSPL expression profiles were retrieved from publicly available RNA-seq results (details in Methods section).
Figure 4
Figure 4
Spatial–temporal expression preference of TaSPLs and their responses to abiotic and phytohormone treatments, as determined by qPCR. Temporal expression profiles of TaSPL2, TaSPL3, TaSPL4, TaSPL6, TaSPL8, TaSPL10, TaSPL17, and TaSPL18 at 0, 1, 3, 6, 12, and 24 h after the treatments of abiotic stresses or phytohormones. Significant differences in expression levels were determined by comparing each treatment at each time point with that at 0 h for each gene per treatment using Student’s t-test (p < 0.05). * and ** indicates significant difference at p < 0.05 and p < 0.01, respectively, in gene expression levels compared to that at 0 h for each treatment.
Figure 5
Figure 5
Characterization of the TaSPL3 expression patterns (A), sub-cellular localization (B), and transactivation ability (C). (A) RNA-seq analysis demonstrates that all of the three TaSPL3 homeologous genes are highly expressed in spike tissues, followed by stem and developing grain tissues; (B) a sub-cellular localization assay was performed in isolated rice protoplasts with transient expression of TaSPL3-6A gene fused with GFP. CFP is a marker plasmid with nuclear localization as positive control; and (C) transcription activity analysis of TaSPL3-6A. In the left panel, the schematic diagram shows that the TaSPL3-6A protein is separated into three parts by the SBP domain (from 184 to 261 amino acid residues). In addition, the left panel shows a series of TaSPL3-6A full-length and truncated proteins that were constructed on the pGBKT7 vector, respectively, to identify the region of TaSPL3 with transactivation ability. In the right panel, the yeast colonies with four different gradients, 10−1, 10−2, 10−3, 10−4, were plated on the screening medium SD/−Trp and SD/−Trp/−His/−Ade, respectively. The empty pGBKT7 vector and positive vector were used as the negative and positive controls, respectively. SD: Synthetic dropout medium; SD/−Trp: Trp-defective SD; SD/−Trp/−Ade/−His: Trp-, Ade-, and His-defective SD.
Figure 6
Figure 6
Ectopic expression of TaSPL3 in transgenic rice exhibited early heading phenotype in both greenhouse (AD) and fields (E). TaSPL3-OE lines headed earlier than the WT plants in 60 days (A), with the TaSPL3-OE panicles becoming mature earlier, as seen at 72 (B) and 95 (C) days of development. Statistical analysis revealed that the vegetative phase, rather than the reproductive phase, was shorter in the TaSPL3-OE lines than in the WT (D). The early heading phenotype was observed for the TaSPL3-OE lines in the T2 generation in experimental fields. Heading panicles are indicated by red arrows (E).
Figure 7
Figure 7
Ectopic expression of TaSPL3 affected stem and leaf development in transgenic rice plants: (A) Morphological differences were observed between TaSPL3-OE transgenic lines (here, line L-1 as a representative) and wild-type rice (WT). Plant height and flag leaf size of TaSPL3-OE transgenic rice plants. (BF) Detailed comparison of stem length and the number of internodes between TaSPL3-OE transgenic lines and WT shows that both the internode lengths (E) and stem diameters (F) in transgenic rice plants were significantly shorter than those in WT, leading to shorter plant heights of the transgenic plants (C). Tiller numbers of the TaSPL3-OE transgenic lines did not differ from WT (D). The length (E) and diameter (F) of each internode (I to V) were compared. Morphological comparison and detailed measurements showed that both the flag leaf length (G, I) and flag leaf width (H, J) in TaSPL3-OE transgenic lines were significantly lower than those in WT, leading to decreased flag leaf areas (K) in TaSPL3-OE transgenic lines. Statistical differences of the traits were determined using Tukey’s test, with mean values marked with different letters differing significantly (p < 0.05) among the lines. For figure (E) and F, * and ** indicates significant differences in stem lengths or diamters at p < 0.05 and p < 0.01, respectively, compared to those of the wildtype plants (determined by Student’s t-test).
Figure 8
Figure 8
Ectopic expression of TaSPL3 significantly affected panicle and yield traits in transgenic rice lines. Comparison of panicle morphology at immature (A) and mature stages (B), as well as grains per panicle (C) between TaSPL3-OE transgenic lines and wild-type plants, showed that ectopic expression of TaSPL3 led to shorter panicles with fewer secondary branches. (DP) Detailed analyses of panicle traits and grain traits demonstrated that ectopic expression of TaSPL3 affected some panicle traits, but not grain traits (MO) and thousand kernel weight (P). The analyzed panicle traits included length of primary branches (F), number of primary branches (G), number of secondary branches (H), weight per panicle (I), weight of grains per panicle (J), number of vacant grains per panicle (K), and yield per plant (L). The bar plots show mean values and standard error of the mean (S.E.M.), with mean values marked by different letters differing significantly (p < 0.05) among the lines. Statistical differences were determined by Tukey’s test.

References

    1. Tu M., Li Y. Toward the genetic basis and multiple QTLs of kernel hardness in wheat. Plants. 2020;9:1631. doi: 10.3390/plants9121631. - DOI - PMC - PubMed
    1. Sun Z., Su C., Yun J., Jiang Q., Wang L., Wang Y., Cao D., Zhao F., Zhao Q., Zhang M., et al. Genetic improvement of the shoot architecture and yield in soya bean plants via the manipulation of GmmiR156b. Plant Biotechnol. J. 2019;17:50–62. doi: 10.1111/pbi.12946. - DOI - PMC - PubMed
    1. Gou J., Fu C., Liu S., Tang C., Debnath S., Flanagan A., Ge Y., Tang Y., Jiang Q., Larson P.R. The miR156-SPL4 module predominantly regulates aerial axillary bud formation and controls shoot architecture. New Phytol. 2017;216:829–840. doi: 10.1111/nph.14758. - DOI - PubMed
    1. Gallavotti A., Zhao Q., Kyozuka J., Meeley R.B., Ritter M.K., Doebley J.F., Pe M.E., Schmidt R.J. The role of barren stalk1 in the architecture of maize. Nature. 2004;432:630–635. doi: 10.1038/nature03148. - DOI - PubMed
    1. Jiao Y., Wang Y., Xue D., Wang J., Yan M., Liu G., Dong G., Zeng D., Lu Z., Zhu X., et al. Regulation of OsSPL14 by OsmiR156 defines ideal plant architecture in rice. Nat. Genet. 2010;42:541–544. doi: 10.1038/ng.591. - DOI - PubMed

MeSH terms

LinkOut - more resources