. 2022 Feb 14;23(4):2112.
doi: 10.3390/ijms23042112.

Selenium-Rich Yeast Peptide Fraction Ameliorates Imiquimod-Induced Psoriasis-like Dermatitis in Mice by Inhibiting Inflammation via MAPK and NF-κB Signaling Pathways

Affiliations

Selenium-Rich Yeast Peptide Fraction Ameliorates Imiquimod-Induced Psoriasis-like Dermatitis in Mice by Inhibiting Inflammation via MAPK and NF-κB Signaling Pathways

Hengke Guo et al. Int J Mol Sci. .

Abstract

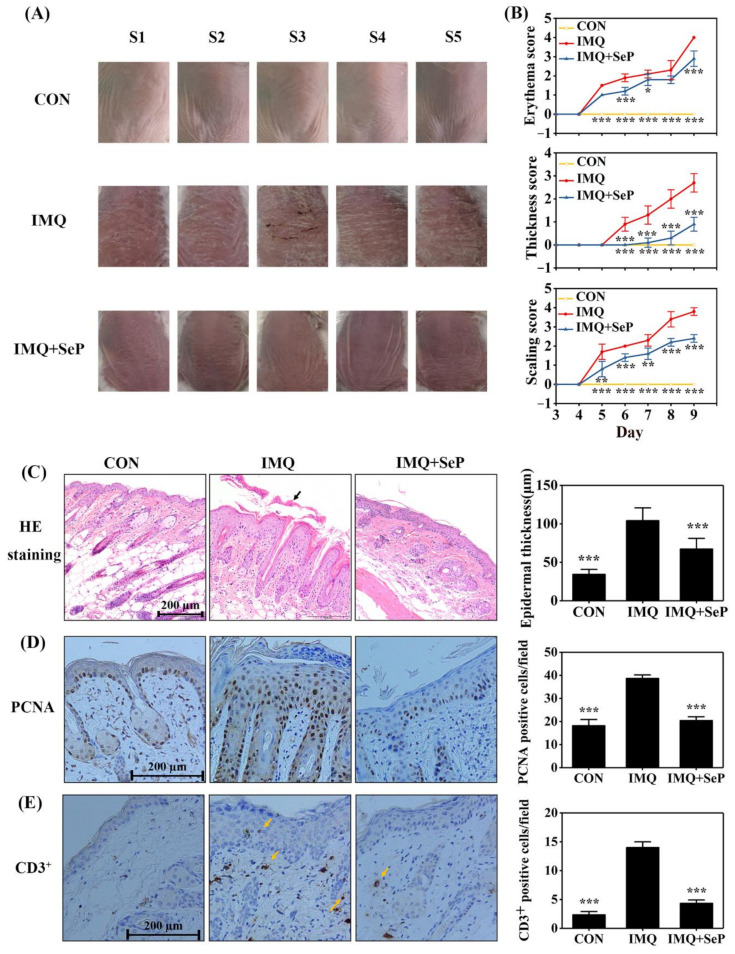
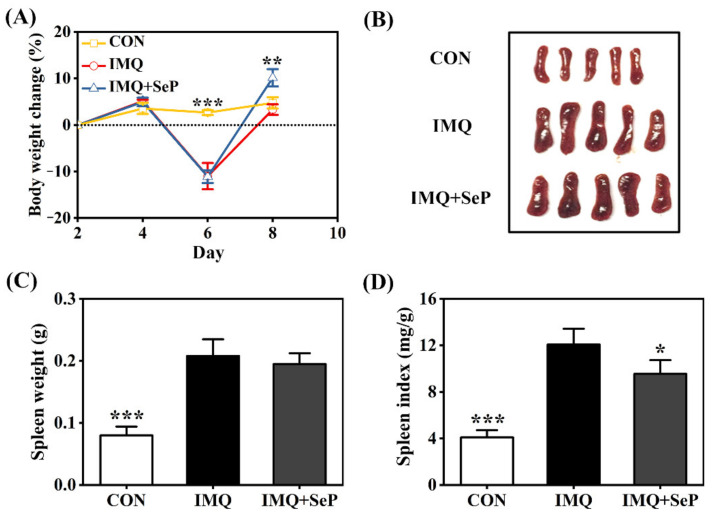
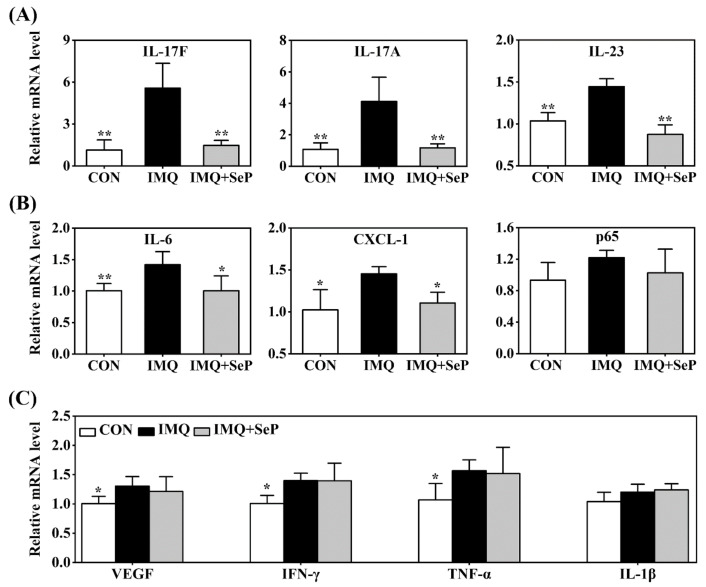
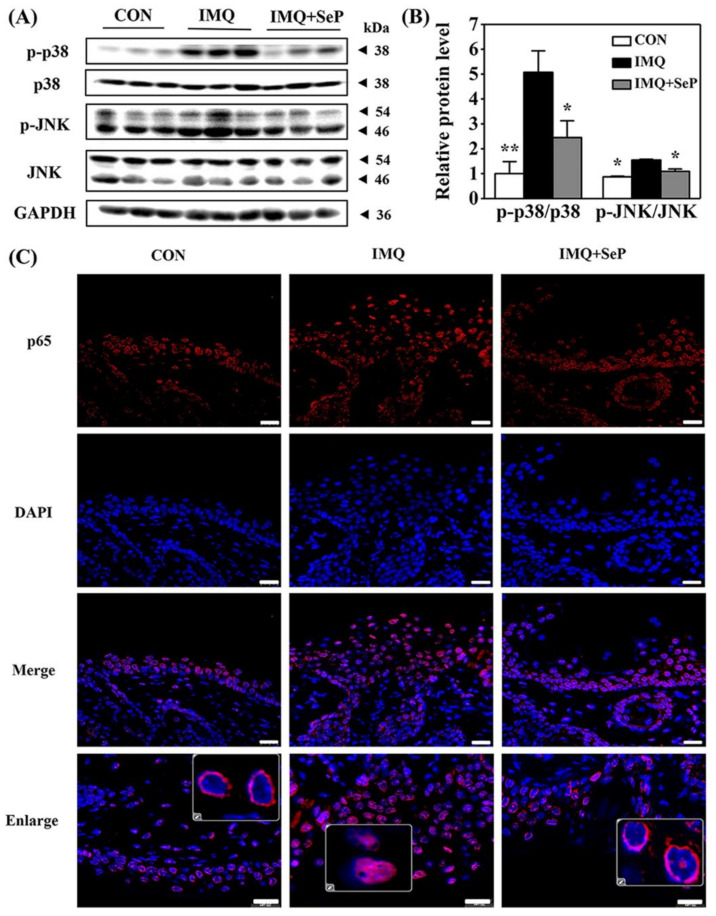
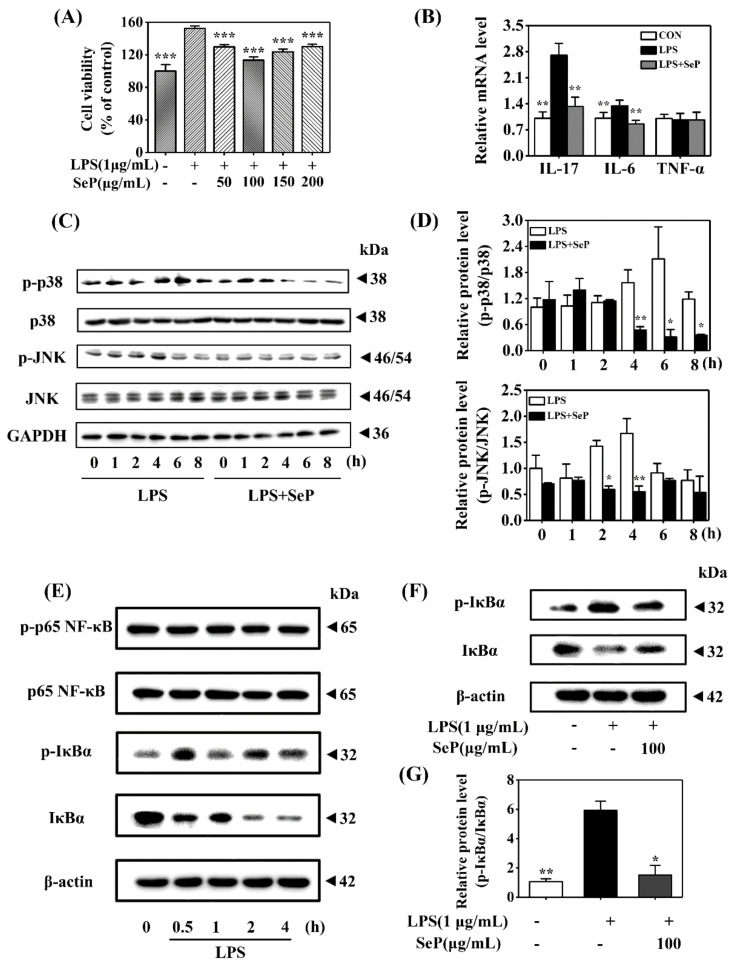
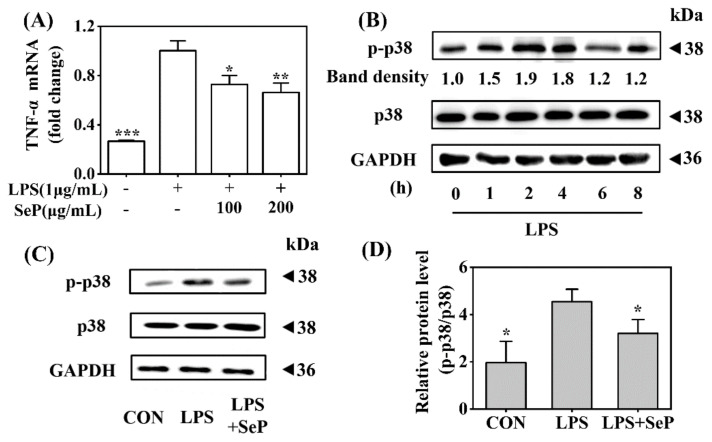
Psoriasis, a chronic and immune-mediated inflammatory disease, adversely affects patients' lives. We previously prepared selenium-rich yeast peptide fraction (SeP) from selenium-rich yeast protein hydrolysate and found that SeP could effectively alleviate ultraviolet radiation-induced skin damage in mice and inhibited H2O2-induced cytotoxicity in cultured human epidermal keratinocyte (HaCaT) cells. This study aimed to investigate whether SeP had a protective effect on imiquimod (IMQ)-induced psoriasis-like dermatitis in mice and the underlying mechanisms. Results showed that SeP significantly ameliorated the severity of skin lesion in IMQ-induced psoriasis-like mouse model. Moreover, SeP treatment significantly attenuated the expression of key inflammatory cytokines, including interleukin (IL)-23, IL-17A, and IL-17F, in the dorsal skin of mice. Mechanistically, SeP application not only inhibited the activation of JNK and p38 MAPK, but also the translocation of NF-κB into the nucleus in the dorsal skin. Furthermore, SeP treatment inhibited the levels of inflammatory cytokines and the activation of MAPK and NF-κB signaling induced by lipopolysaccharide in HaCaT cells and macrophage cell line RAW264.7. Overall, our findings showed that SeP alleviated psoriasis-like skin inflammation by inhibiting MAPK and NF-κB signaling pathways, which suggested that SeP would have a potential therapeutic effect against psoriasis.

Keywords: MAPK; NF-κB; inflammation; psoriasis; selenium-rich yeast peptide fraction.


Conflict of interest statement

The authors declare no conflict of interest.

Figures

Figure 1
Figure 1
Effect of SeP on the IMQ-induced psoriasis-like dermatitis in mice. (A) The macroscopic appearance of mice back skin on day 9. The back skin of 5 mice (S1–5) were shown in each group. (B) The symptoms of erythema, skin thickness, and scaling were scored on day 3 to day 9 based on the PASI. (C) Hematoxylin-eosin (HE) staining of dorsal skin on day 9 (left panel) and quantification of the epidermal thickness (right panel). The black arrow indicated the sloughed scales. (D,E) Immunohistochemical staining for PCNA (D) and CD3 (E) in mouse dorsal skin on day 9. Representative images were shown in left panel and quantification of PCNA or CD3+ positive cells were shown in right panel. Quantification of the epidermal thickness, PCNA-positive cells and CD3+ positive cells of mouse back skin were obtained from 5 to 8 sites per mouse per group. Data were expressed as mean ± SD (n = 6). * p < 0.05, ** p < 0.01, *** p < 0.001, compared with the IMQ group.
Figure 2
Figure 2
Influence of SeP on the IMQ-induced systemic side effects in mice. (A) Percent change of body weight of mice from day 2 to day 8. The body weight of mice on day 2 was used as baseline initial values in each group. (B) The photos of spleen tissues of each group (5 mice) on day 9. (C) Spleen weight. (D) Spleen index (spleen weight/body weight). Data were expressed as mean ± SD (n = 6). * p < 0.05, ** p < 0.01, *** p < 0.001, compared with the IMQ group.
Figure 3
Figure 3
Effect of SeP on the expression of psoriasis-associated molecules in dorsal skin. The mRNA levels of IL-17F, IL-17A, IL-23 (A), IL-6, CXCL-1, p65 (B), VEGF, IFN-γ, TNF-α and IL-1β (C) were detected by RT-qPCR. Glyceraldehyde-3-phosphate dehydrogenase (GAPDH) was served as an internal reference. Data were expressed as the mean ± SD (n = 6). * p < 0.05, ** p < 0.01, compared with the IMQ group.
Figure 4
Figure 4
Effect of SeP on the activation of MAPK and NF-κB pathways in dorsal skin of IMQ-treated mice. (A,B) SeP inhibited the activation of MAPK induced by IMQ in the dorsal skin of mice. Western blot analysis was performed to measure the protein levels of p-p38, p38, p-JNK and JNK. (A) Representative image of bands. (B) Semi-quantification analysis of p-p38 normalized to p38 and p-JNK normalized to JNK (mean ± SD, n = 3). * p < 0.05, ** p < 0.01, compared with the IMQ group. (C) SeP inhibited the p65 translocation into the nucleus induced by IMQ in the dorsal skin of mice. Representative images of immunofluorescent staining of NF-κB p65. NF-κB p65 was stained in red with Cy3 and nucleus was stained blue with DAPI. Enlarge images showed the localization of p65. Scale bar = 20 µm.
Figure 5
Figure 5
Effect of SeP on cell viability, pro-inflammatory cytokines expression, and the activation of MAPK and NF-κB signaling pathways in LPS-stimulated HaCaT cells. (A) SeP pretreatment suppressed the cell proliferation induced by LPS. After pretreated with indicated dose of SeP for 24 h, HaCaT cells were exposed to LPS (1 µg/mL) for another 24 h. MTT assay was used to determine the cell viability (means ± SD, n = 4). (B) SeP reduced the expression of IL-17A and IL-6 induced by LPS. Cells were pretreated with SeP (100 µg/mL) for 24 h and then exposed to LPS (1 µg/mL) for another 12 h. RT-qPCR assay was performed to measure the mRNA level of pro-inflammatory cytokines (means ± SD, n = 4). (C,D) SeP suppressed LPS-induced the activation of p38 and JNK MAPK in HaCaT cells. After pretreatment with or without SeP (100 µg/mL) for 12 h, cells were stimulated with LPS for another indicated times (0, 1, 2, 4, 6 and 8 h). Western blot analysis was used to determine the protein levels of p-p38, p38, p-JNK and JNK. (C) Representative Western blot bands of p-p38, p38, p-JNK and JNK. (D) Semi-quantification analysis of p-p38 MAPK normalized to p38 MAPK (upper panel) and p-JNK normalized to JNK (lower panel) (mean ± SD, n = 3). (E) LPS activated NF-κB signaling pathway in HaCaT cells. Cells were stimulated by LPS (1 µg/mL) for indicated times (0, 0.5, 1, 2 and 4 h), and the protein levels of phosphorylated p65 (p-p65), p65, p-IκBα and IκBα were detected by Western blot analysis. Representative Western blot bands were shown. (F,G) SeP suppressed LPS-induced the activation of NF-κB signaling pathway in HaCaT cells. Cells were pretreated with or without SeP (100 µg/mL) for 12 h and then stimulated with LPS (1 µg/mL) for another 0.5 h. Western blot analysis was done to measure the protein levels of p-IκBα and IκBα. (F) Representative Western blot bands. (G) Semi-quantification analysis of p-IκBα normalized to IκBα (mean ± SD, n = 3). Each band image was representative of three experiments. * p < 0.05, ** p < 0.01, *** p < 0.001, compared with cells treated with LPS only.
Figure 6
Figure 6
Effect of SeP on TNF-α expression and the activation of p38 MAPK signaling pathway in LPS-stimulated RAW264.7 cells. (A) SeP decreased LPS-induced TNF-α expression. After pretreated with SeP (100 and 200 µg/mL) for 4 h, HaCaT cells were exposed to LPS (1 µg/mL) for another 20 h. The mRNA expression level of TNF-α was measured by using RT-qPCR (means ± SD, n = 3). (B) LPS activated p38 MAPK signaling pathway. Cells were stimulated by LPS (1 µg/mL) for indicated times (0, 1, 2, 4, 6 and 8 h) and then the protein levels of p-p38 and p38 were measured by Western blot. Representative Western blot bands were shown. (C,D) SeP suppressed LPS-induced activation of p38 MAPK. Cells were pretreated with or without SeP (100 µg/mL) for 10 h and then stimulated with LPS (1 µg/mL) for another 2 h. Western blot analysis were performed to determine protein levels of p-p38 and p38. (C) Representative Western blot bands. (D) Semi-quantification analysis of p-p38 normalized to p38 (mean ± SD, n = 3). Each band image was representative of three experiments. * p < 0.05, ** p < 0.01, *** p < 0.001, compared with cells treated with LPS only.

References

    1. Griffiths C.E.M., Armstrong A.W., Gudjonsson J.E., Barker J.N.W.N. Psoriasis. Lancet. 2021;397:1301–1315. doi: 10.1016/S0140-6736(20)32549-6. - DOI - PubMed
    1. WHO Global Report on Psoriasis. [(accessed on 26 October 2016)]. Available online: https://www.who.int/publications/i/item/global-report-on-psoriasis.
    1. Kim J., Krueger J.G. Highly effective new treatments for psoriasis target the IL-23/Type 17 T cell autoimmune axis. Annu Rev. Med. 2017;68:255–269. doi: 10.1146/annurev-med-042915-103905. - DOI - PubMed
    1. Lowes M.A., Bowcock A.M., Krueger J.G. Pathogenesis and therapy of psoriasis. Nature. 2007;445:866–873. doi: 10.1038/nature05663. - DOI - PubMed
    1. Dainichi T., Kitoh A., Otsuka A., Nakajima S., Nomura T., Kaplan D.H., Kabashima K. The epithelial immune microenvironment (EIME) in atopic dermatitis and psoriasis. Nat. Immunol. 2018;19:1286–1298. doi: 10.1038/s41590-018-0256-2. - DOI - PubMed

MeSH terms