

Investigation of Metabolome Underlying the Biological Mechanisms of Acute Heat Stressed Granulosa Cells
- PMID: 35216260
- PMCID: PMC8879866
- DOI: 10.3390/ijms23042146
Investigation of Metabolome Underlying the Biological Mechanisms of Acute Heat Stressed Granulosa Cells
Abstract
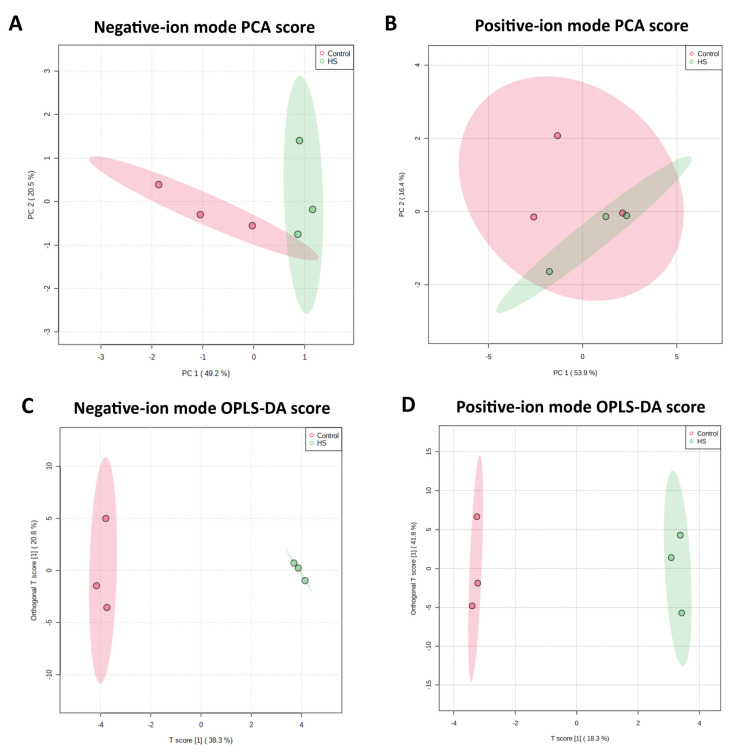
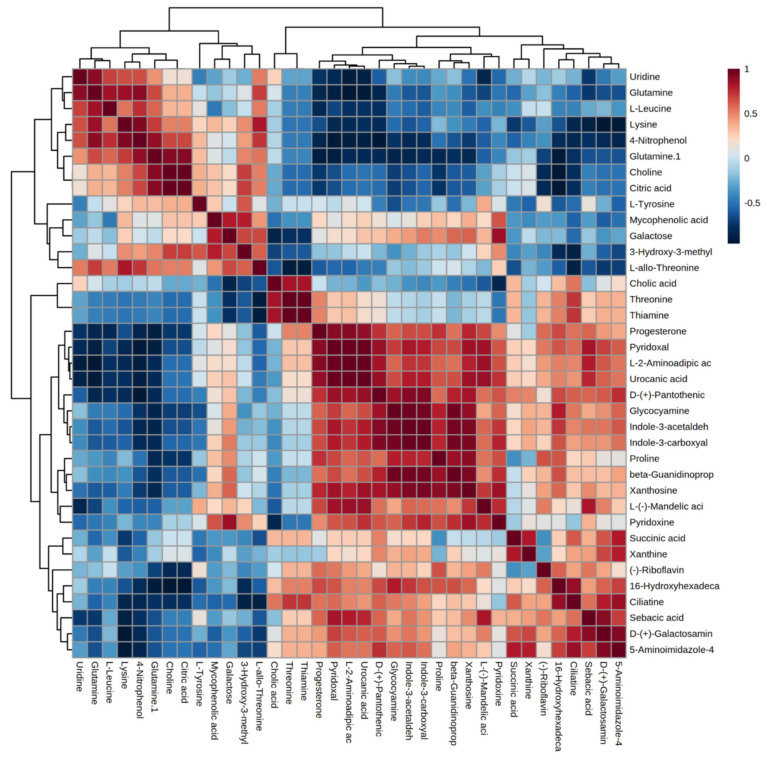
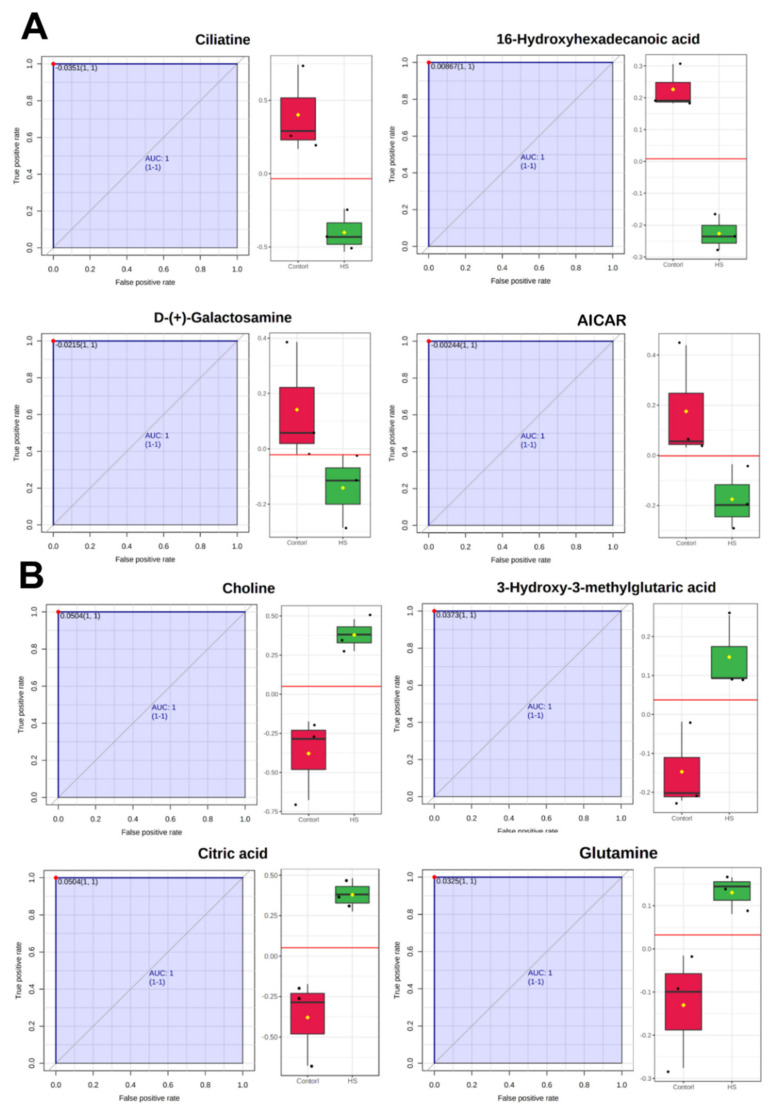
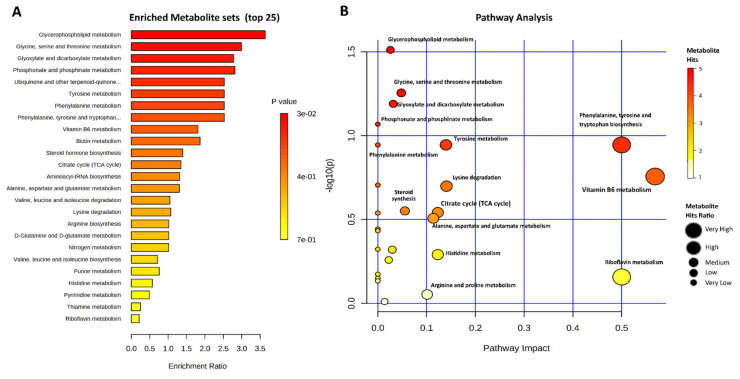
Heat stress affects granulosa cells and the ovarian follicular microenvironment, ultimately resulting in poor oocyte developmental competence. This study aims to investigate the metabo-lomics response of bovine granulosa cells (bGCs) to in vitro acute heat stress of 43 °C. Heat stress triggers oxidative stress-mediated apoptosis in cultured bGCs. Heat-stressed bGCs exhibited a time-dependent recovery of proliferation potential by 48 h. A total of 119 metabolites were identified through LC-MS/MS-based metabolomics of the spent culture media, out of which, 37 metabolites were determined as differentially involved in metabolic pathways related to bioenergetics support mechanisms and the physical adaptations of bGCs. Multiple analyses of metabolome data identified choline, citric acid, 3-hydroxy-3-methylglutaric acid, glutamine, and glycocyamine as being upregulated, while galactosamine, AICAR, ciliatine, 16-hydroxyhexadecanoic acid, lysine, succinic acid, uridine, xanthine, and uraconic acid were the important downregulated metabolites in acute heat stress. These differential metabolites were implicated in various important metabolic pathways directed towards bioenergetics support mechanisms including glycerophospholipid metabolism, the citrate cycle (TCA cycle), glyoxylate and dicarboxylate metabolism, and serine, threonine, and tyrosine metabolism. Our study presents important metabolites and metabolic pathways involved in the adaptation of bGCs to acute heat stress in vitro.
Keywords: bioenergetics; granulosa cells; heat stress; metabolites; metabolomics; pathways.
Conflict of interest statement
Authors declare no conflict of interests. Funders had no role in the design of the study; in the collection, analyses, or interpretation of data; in the writing of the manuscript, or in the decision to publish.
Figures
Similar articles
-
Transcriptome Reveals Granulosa Cells Coping through Redox, Inflammatory and Metabolic Mechanisms under Acute Heat Stress.Cells. 2022 Apr 25;11(9):1443. doi: 10.3390/cells11091443. Cells. 2022. PMID: 35563749 Free PMC article.
-
Joint Transcriptome and Metabolome Analysis Prevails the Biological Mechanisms Underlying the Pro-Survival Fight in In Vitro Heat-Stressed Granulosa Cells.Biology (Basel). 2022 May 30;11(6):839. doi: 10.3390/biology11060839. Biology (Basel). 2022. PMID: 35741360 Free PMC article.
-
Heme oxygenase 1 regulates apoptosis induced by heat stress in bovine ovarian granulosa cells via the ERK1/2 pathway.J Cell Physiol. 2019 Apr;234(4):3961-3972. doi: 10.1002/jcp.27169. Epub 2018 Sep 7. J Cell Physiol. 2019. PMID: 30191981
-
The interactions and biological pathways among metabolomics products of patients with coronary heart disease.Biomed Pharmacother. 2024 Apr;173:116305. doi: 10.1016/j.biopha.2024.116305. Epub 2024 Feb 29. Biomed Pharmacother. 2024. PMID: 38422653 Review.
-
Cellular and functional adaptation to thermal stress in ovarian granulosa cells in mammals.J Therm Biol. 2020 Aug;92:102688. doi: 10.1016/j.jtherbio.2020.102688. Epub 2020 Aug 12. J Therm Biol. 2020. PMID: 32888576 Review.
Cited by
-
Plasma metabolomic characterization of premature ovarian insufficiency.J Ovarian Res. 2023 Jan 5;16(1):2. doi: 10.1186/s13048-022-01085-y. J Ovarian Res. 2023. PMID: 36600288 Free PMC article.
-
Integrated Multi-Omics Analysis Reveals the Mechanisms of Intestinal Cell Injury Under Different Levels of Heat Stress.Int J Mol Sci. 2025 Jun 17;26(12):5798. doi: 10.3390/ijms26125798. Int J Mol Sci. 2025. PMID: 40565262 Free PMC article.
-
Incorporation of L-Carnitine in the OvSynch protocol enhances the morphometrical and hemodynamic parameters of the ovarian structures and uterus in ewes under summer climatic conditions.BMC Vet Res. 2023 Nov 24;19(1):246. doi: 10.1186/s12917-023-03814-x. BMC Vet Res. 2023. PMID: 37996926 Free PMC article.
-
Transcriptome Reveals Granulosa Cells Coping through Redox, Inflammatory and Metabolic Mechanisms under Acute Heat Stress.Cells. 2022 Apr 25;11(9):1443. doi: 10.3390/cells11091443. Cells. 2022. PMID: 35563749 Free PMC article.
-
Analysis of CircRNA Expression in Peripheral Blood of Holstein Cows in Response to Heat Stress.Int J Mol Sci. 2023 Jun 15;24(12):10150. doi: 10.3390/ijms241210150. Int J Mol Sci. 2023. PMID: 37373298 Free PMC article.
References
-
- Collier R.J., Collier J.L. Environmental Physiology of Livestock. John Wiley & Sons, Inc.; Hoboken, NJ, USA: 2012.
MeSH terms
Grants and funding
LinkOut - more resources
Full Text Sources
