. 2022 Feb 21;23(4):2398.
doi: 10.3390/ijms23042398.

Statins Aggravate the Risk of Insulin Resistance in Human Muscle

Affiliations

Statins Aggravate the Risk of Insulin Resistance in Human Muscle

Stefanie A Grunwald et al. Int J Mol Sci. .

Abstract

Beside their beneficial effects on cardiovascular events, statins are thought to contribute to insulin resistance and type-2 diabetes. It is not known whether these effects are long-term events from statin-treatment or already triggered with the first statin-intake. Skeletal muscle is considered the main site for insulin-stimulated glucose uptake and therefore, a primary target for insulin resistance in the human body. We analyzed localization and expression of proteins related to GLUT4 mediated glucose uptake via AMPKα or AKT in human skeletal muscle tissue from patients with statin-intake >6 months and in primary human myotubes after 96 h statin treatment. The ratio for AMPKα activity significantly increased in human skeletal muscle cells treated with statins for long- and short-term. Furthermore, the insulin-stimulated counterpart, AKT, significantly decreased in activity and protein level, while GSK3ß and mTOR protein expression reduced in statin-treated primary human myotubes, only. However, GLUT4 was normally distributed whereas CAV3 was internalized from plasma membrane around the nucleus in statin-treated primary human myotubes. Statin-treatment activates AMPKα-dependent glucose uptake and remains active after long-term statin treatment. Permanent blocking of its insulin-dependent counterpart AKT activation may lead to metabolic inflexibility and insulin resistance in the long run and may be a direct consequence of statin-treatment.

Keywords: AKT; AMPK; human skeletal muscle; insulin resistance; primary human muscle cells; statins.


Conflict of interest statement

The authors declare no conflict of interest.

Figures

Figure 1
Figure 1
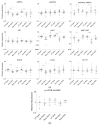
Proteins involved in glucose uptake and signaling in human skeletal muscle tissue from controls and statin-treated patients. (a). Immunohistochemistry staining for glucose transporter GLUT4 distribution. Images shown are representative data. (control female (C5), control male (C12), statin patient female (S1), statin patient male (S4)). (b). Western blot of human skeletal muscle tissue from statin-treated patients (right panel) and controls (left panel). Each lane corresponds to another sample (left panel = C1–C3, C5–C9, C11, and C12; right panel = S1–S8; see Table 1). PPIA is the reference protein. mTOR, AMPKα, and GSK3ß were probed on the same blot. Phosphorylated AMPKα, AKT, and phosphorylated AKT were analyzed on separate immunoblots. GLUT4 was probed on the same membrane as phosphorylated AMPKα. Signals shown are derived with an LI-COR-Odyssey infra-red scanner, except for GLUT4, and quantified using Image Studio Lite ver5.2. (c). Ratio of phosphorylated AMPKα and phosphorylated AKT to total AMPKα and AKT protein, respectively, to control for differences in total protein level. (Results obtained from controls C1–C3, C5–C9, C11, C12 and statin-treated patients S1–S8 (see Table 1); f = female; m = male; dotted line at 2- and 0.5-fold; p < 0.05, ** p < 0.005; *** p < 0.0005, Mann–Whitney test; plot shows single data points with median 95% confidence interval for the median). (d). Relative expression level of proteins relevant for glucose uptake regulation and metabolism in human muscle tissue.
Figure 1
Figure 1
Proteins involved in glucose uptake and signaling in human skeletal muscle tissue from controls and statin-treated patients. (a). Immunohistochemistry staining for glucose transporter GLUT4 distribution. Images shown are representative data. (control female (C5), control male (C12), statin patient female (S1), statin patient male (S4)). (b). Western blot of human skeletal muscle tissue from statin-treated patients (right panel) and controls (left panel). Each lane corresponds to another sample (left panel = C1–C3, C5–C9, C11, and C12; right panel = S1–S8; see Table 1). PPIA is the reference protein. mTOR, AMPKα, and GSK3ß were probed on the same blot. Phosphorylated AMPKα, AKT, and phosphorylated AKT were analyzed on separate immunoblots. GLUT4 was probed on the same membrane as phosphorylated AMPKα. Signals shown are derived with an LI-COR-Odyssey infra-red scanner, except for GLUT4, and quantified using Image Studio Lite ver5.2. (c). Ratio of phosphorylated AMPKα and phosphorylated AKT to total AMPKα and AKT protein, respectively, to control for differences in total protein level. (Results obtained from controls C1–C3, C5–C9, C11, C12 and statin-treated patients S1–S8 (see Table 1); f = female; m = male; dotted line at 2- and 0.5-fold; p < 0.05, ** p < 0.005; *** p < 0.0005, Mann–Whitney test; plot shows single data points with median 95% confidence interval for the median). (d). Relative expression level of proteins relevant for glucose uptake regulation and metabolism in human muscle tissue.
Figure 2
Figure 2
Caveolin 3 (CAV3) and glucose transporter GLUT4 immunofluorescence staining for non-stimulated statin-treated primary human myotubes and controls. Images shown are representative data. CAV3 (green) accumulates around the nucleus (arrow) and is less at the plasma membrane (arrow) after simvastatin treatment. GLUT4 (red) is normally distributed in vesicular structures around the nucleus (arrow) and at the plasma membrane (arrow). After simvastatin, GLUT4 signals are less punctuated (arrow) as expected for vesicular structures and observed for controls (arrow). Images shown are representative data. (Results obtained from C3–C5, C10–C12, and S8; see Table 1) UT = untreated; Sim = simvastatin; Rosu = rosuvastatin; scale bar = 50 µm.
Figure 3
Figure 3
Expression of proteins relevant for glucose-uptake regulation and metabolism in human primary myotubes non-stimulated and stimulated with glucose and insulin under statin treatment. (a). Relative expression level of proteins relevant for glucose uptake regulation and metabolism under statin-treatment compared to its untreated control w/o glucose and insulin stimulation. Ratios of pAMPKα and pAKT to total AMPKα and AKT protein, respectively to control for differences in total protein levels. (b). mTOR phosphorylation at Ser2448 was detected using sandwich ELISA method. Values are protein level corrected. (ci). Western blot of statin-treated human primary myotubes unstimulated and stimulated with insulin and glucose. PPIA and GAPDH were used as reference proteins. mTOR, AMPKα, and GSK3ß were probed on the same blot. Phosphorylated AMPKα, AKT, and phosphorylated AKT were analyzed on separate immunoblots. GLUT4 was probed on the same membrane as phosphorylated AMPKα. Signals shown are derived using an LI-COR-Odyssey infra-red scanner, except for GLUT4, and quantified via Image Studio Lite ver5.2. Protein ladder lanes separate each myotube cell line data set (C = C11; D = C5; E = C12; F = C4; G = C3; H = C10; I = S8; see Table 1). Each data set includes untreated, DMSO, simvastatin, rosuvastatin non-stimulated and stimulated with glucose and insulin, respectively. Western blotting was repeated twice. (Results obtained from C3–C5, C10–C12, and S8; see Table 1; GAPDH–bands derived with ECL method only) [UT = untreated; Sim = simvastatin; Rosu = rosuvastatin; Starv = starving condition only; Stim = insulin/glucose stimulation after starving; dotted line at 2- and 0.5-fold; * p < 0.05, ** p < 0.005; *** p < 0.0005, **** p < 0.00005; one-way ANOVA corrected for Dunn’s multiple comparison testing; plots show single data points with 95% confidence interval for the median].
Figure 3
Figure 3
Expression of proteins relevant for glucose-uptake regulation and metabolism in human primary myotubes non-stimulated and stimulated with glucose and insulin under statin treatment. (a). Relative expression level of proteins relevant for glucose uptake regulation and metabolism under statin-treatment compared to its untreated control w/o glucose and insulin stimulation. Ratios of pAMPKα and pAKT to total AMPKα and AKT protein, respectively to control for differences in total protein levels. (b). mTOR phosphorylation at Ser2448 was detected using sandwich ELISA method. Values are protein level corrected. (ci). Western blot of statin-treated human primary myotubes unstimulated and stimulated with insulin and glucose. PPIA and GAPDH were used as reference proteins. mTOR, AMPKα, and GSK3ß were probed on the same blot. Phosphorylated AMPKα, AKT, and phosphorylated AKT were analyzed on separate immunoblots. GLUT4 was probed on the same membrane as phosphorylated AMPKα. Signals shown are derived using an LI-COR-Odyssey infra-red scanner, except for GLUT4, and quantified via Image Studio Lite ver5.2. Protein ladder lanes separate each myotube cell line data set (C = C11; D = C5; E = C12; F = C4; G = C3; H = C10; I = S8; see Table 1). Each data set includes untreated, DMSO, simvastatin, rosuvastatin non-stimulated and stimulated with glucose and insulin, respectively. Western blotting was repeated twice. (Results obtained from C3–C5, C10–C12, and S8; see Table 1; GAPDH–bands derived with ECL method only) [UT = untreated; Sim = simvastatin; Rosu = rosuvastatin; Starv = starving condition only; Stim = insulin/glucose stimulation after starving; dotted line at 2- and 0.5-fold; * p < 0.05, ** p < 0.005; *** p < 0.0005, **** p < 0.00005; one-way ANOVA corrected for Dunn’s multiple comparison testing; plots show single data points with 95% confidence interval for the median].

Similar articles

Cited by

References

    1. Ward N.C., Watts G.F., Eckel R.H. Statin Toxicity. Mechanistic Insights and Clinical Implications. Circ. Res. 2019;124:328–350. doi: 10.1161/CIRCRESAHA.118.312782. - DOI - PubMed
    1. Thakker D., Nair S., Pagada A., Jamdade V., Malik A. Statin use and the risk of developing diabetes: A network meta-analysis. Pharmacoepidemiol. Drug Saf. 2016;25:1131–1149. doi: 10.1002/pds.4020. - DOI - PubMed
    1. Khan S.U., Rahman H., Okunrintemi V., Riaz H., Khan M.S., Sattur S., Kaluski E., Lincoff A.M., Martin S.S., Blaha M.J. Association of Lowering Low-Density Lipoprotein Cholesterol With Contemporary Lipid-Lowering Therapies and Risk of Diabetes Mellitus: A Systematic Review and Meta-Analysis. J. Am. Heart Assoc. 2019;8:e011581. doi: 10.1161/JAHA.118.011581. - DOI - PMC - PubMed
    1. Brinton E.A. Statin-Related New-Onset Diabetes Appears Driven by Increased Insulin Resistance: Are There Clinical Implications? Arter. Thromb. Vasc. Biol. 2021;41:2798–2801. doi: 10.1161/ATVBAHA.121.316893. - DOI - PubMed
    1. Ko M.J., Jo A.J., Kim Y.J., Kang S.H., Cho S., Jo S., Park C., Yun S., Lee W.J., Park D. Time- and Dose-Dependent Association of Statin Use With Risk of Clinically Relevant New-Onset Diabetes Mellitus in Primary Prevention: A Nationwide Observational Cohort Study. J. Am. Heart Assoc. 2019;8:e011320. doi: 10.1161/JAHA.118.011320. - DOI - PMC - PubMed

MeSH terms