. 2022 May 4;110(9):1516-1531.e9.
doi: 10.1016/j.neuron.2022.01.035. Epub 2022 Feb 24.

Neuronal mitochondria transport Pink1 mRNA via synaptojanin 2 to support local mitophagy

Affiliations

Neuronal mitochondria transport Pink1 mRNA via synaptojanin 2 to support local mitophagy

Angelika B Harbauer et al. Neuron. .

Abstract

PTEN-induced kinase 1 (PINK1) is a short-lived protein required for the removal of damaged mitochondria through Parkin translocation and mitophagy. Because the short half-life of PINK1 limits its ability to be trafficked into neurites, local translation is required for this mitophagy pathway to be active far from the soma. The Pink1 transcript is associated and cotransported with neuronal mitochondria. In concert with translation, the mitochondrial outer membrane proteins synaptojanin 2 binding protein (SYNJ2BP) and synaptojanin 2 (SYNJ2) are required for tethering Pink1 mRNA to mitochondria via an RNA-binding domain in SYNJ2. This neuron-specific adaptation for the local translation of PINK1 provides distal mitochondria with a continuous supply of PINK1 for the activation of mitophagy.

Keywords: OMP25; PINK1; Parkinson disease; RNA transport; SYNJ2BP; hitchhiking; local translation; mitophagy; synaptojanin2.


Conflict of interest statement

Declaration of interests Z.H. is a co-founder of Rugen Therapeutics and Myro Therapeutics. All other authors declare no competing interests.

Figures
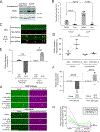
Figure 1.
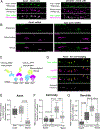
Figure 1.. Local translation is required for PINK1 activity in axons
(A) Representative Western Blot showing of PINK1 levels in response to CCCP (20 μM 2h) and CHX (5 uM 30 min prior to CCCP) in human iPSC-derived cortical neurons. (B) Quantification of PINK1 stabilization as in (A) normalized to GAPDH signal. Data is shown as mean ± SEM; ANOVA with Tukey’s multiple comparisons test, n=6 biological repeats per condition. (C) Neurons grown in a microfluidic chambers transfected with YFP-Parkin and a mitochondrial marker were treated with 40 μM AA. The recruitment of Parkin to mitochondria (yellow arrowheads) was monitored with live cell imaging prior (start) and after 20 min addition of AA. (D) Quantification of mitochondria colocalizing with Parkin before and after AA treatment in the presence/absence of 35 μM CHX in the axonal compartment. Data is shown as mean ± SEM; Student’s t-test was performed on the mean fold increase, n=3 biological repeats per condition. (E) RNA isolated from somatic or axonal compartments of microfluidic devices was analyzed by qPCR. The abundance of the transcripts was normalized to mitochondrial rRNA. Data are shown on a log scale as mean ± SEM; Student’s t-test; n=3 independent microfluidic devices. (F) After intraorbital injection of AAV encoding either GFP or tagged PINK1 transcripts, retinal and optic nerve RNA was collected and the abundance of the exogenous transcripts analyzed by qPCR and normalized to β-actin. Data are shown on a log scale as mean ± SEM; Student’s t-test, n = 4 retina/optic nerve pairs. (G) Representative images and (H) quantification of the photoconvertible fluorescent protein Kaede fused to PINK1-N (Amino acids 1–225, PINK1-N-Kaede) or Cox8 (Amino acids 1–36, mito-Kaede). The mitochondrial mean signal intensity of the non-photoconverted Kaede was quantified. Student’s t-test, n = 3–5 axons. p<0.01 (**) and p<0.0001 (****). Scale bars = 10 μm. For further verification of microfluidic devices see Figure S1.
Figure 2.
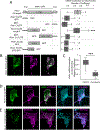
Figure 2.. Pink1 mRNA localizes to mitochondria in neurons
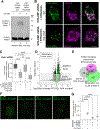
(A) RNAscope in situ hybridization reveals Pink1 mRNA localization to mitochondria in axons and dendrites. Scale bar = 10 μm. (B) Representative superresolution STED images for endogenous Pink1 and β-actin RNA by in situ hybridization (RNAscope) and mitochondria detected by immunostaining for ATP5b. Scale bar = 2 μm. (C) Schematic of MS2/PP7-splitVenus method for mRNA imaging. (D-G) Live cell imaging of Pink1 and β-actin RNA in hippocampal neurons using the MS2/PP7-splitVenus method. (D) Representative image of colocalization of the tagged RNA with mitoBFP in axons marked by AnkyrinG-mCherry. Scale bar = 10 μm. (E) Manders coefficient for RNA and mitochondrial channels. “Venus-flip” indicates that the mitochondrial channel, after digital straightening of the axon, had been flipped horizontally before quantification. Student’s t-test, n = 10 axons; p<0.0001 (****). (F and G) Manders coefficient analysis between RNA and mitochondrial channels in cell bodies and dendrites. ANOVA with Tukey’s HSD multiple comparisons test, n = 39–43 cell bodies, 24–28 dendrites; p<0.0001 (****). Scale bar = 10 μm. For representative images, colocalization with endosomes and further detail on the MS2/PP7-splitVenus method see Figure S2.
Figure 3.
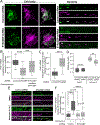
Figure 3.. Pink1 mRNA is cotransported with mitochondria
(A) Still-images and kymograph from a dendrite showing Pink1 mRNA cotransported with moving (yellow arrowhead) and stationary (red arrowhead) mitochondria associated with PINK1 mRNA. Scale bar = 5 μm (B). Kymograph in which Pink1 mRNA appeared to transiently occur without an associated mitochondrion. While most mRNA particles were associated with mitochondria, including during transport (yellow arrowhead), particles without a mitochondrion were occasionally seen and might undergo short-range independent movement (blue and white arrowheads). A potential interpretation of this kymograph as indicating association/dissociation of the Pink1 mRNA from moving mitochondria is schematized in Figure S3. Scale bar = 10 μm. (C) Histogram depicting frequency of observed movements of 96 moving Pink1 mRNA particles from 46 dendrites over the indicated distances. (D) Overexpression of PINK1 WT decreases Pink1 mRNA motility relative to PINK1 K219M. Average time spent in motion per dendrite was analyzed in n = 26–29 dendrites from three independent experiments. Student’s t-test, p<0.01 (**).
Figure 4.
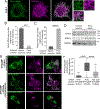
Figure 4.. Translation of the PINK1 mitochondrial targeting sequence is necessary but insufficient for Pink1 mRNA association with mitochondria
(A) Schematic representation of constructs used and Manders coefficients between the indicated Pink1/BFP chimeric constructs and mitochondria in hippocampal somata. The distribution of full length Pink1 was repeated from Figure 2F for comparison. One-way ANOVA with Bonferroni post-hoc test; n = 28–41 somas, p<0.001 (***), p>0.05 (#). (B) Representative images for Pink1 5’UTR+N-BFP. (C) Manders coefficient between Pink1 transcript (kinase dead) and mitochondria in the presence or absence of Puromycin. Student’s t-test, n = 26–28 cell bodies, p<0.001 (***). (D) Representative images of Pink1-N-Δatg-BFP RNA and protein. (E) Representative images for Pink1 5’UTR+MTS-BFP. Please note that the Pink1 5’UTR+MTS-BFP mRNA is largely cytosolic, although the encoded BFP protein localizes exclusively to mitochondria. Scale bars = 10 μm. For representative images see Figure S4.
Figure 5.
Figure 5.. SYNJ2BP knockdown redistributes Pink1 mRNA to RNA granules and inhibits local mitophagy
(A) Neurons were treated with either control or SYNJ2BP shRNA for imaging of Pink1 transcripts (kinase dead) by the splitVenus method. Representative images from the soma and dendrites are shown. (B) Colocalization in the soma as quantified with Manders coefficient. ANOVA with Tukey’s HSD multiple comparisons test, n = 23–31 somas, p<0.0001 (****). (C) Manders coefficient for colocalization in soma of Pink1 transcript and P-bodies marked with RFP-DDX. Student’s t-test, n = 16–20 cell bodies, p<0.0001 (****). (D) Mitophagy index of the pH-sensitive fluorophore mito-mKeima in axons from neurons also expressing either control or SYNJ2BP shRNA, with or without AA treatment. Student’s t-test, n = 9–10 axonal field of views, p<0.01 (**). (E) Representative images of neurites stained with an antibody against phosphoubiquitin expressing also mitoRaspberry (mitoRasp) and either control or SYNJ2BP shRNA, with or without AA treatment. (F) Quantification of neurites treated as shown in (E) using Manders coefficient, ANOVA with Tukey’s HSD multiple comparisons test, n = 16–17 neurites, p<0.0001. Scale bars = 10 μm. For the localization of β-actin mRNA and validation of the shRNA please refer to Figure S5.
Figure 6.
Figure 6.. Pink1 mRNA localization to mitochondria is neuron specific and depends on SYNJ2a
(A) Pink1 transcript is not localized to mitochondria in COS-7 cells. (B-C) qRT-PCR from primary fibroblasts and hippocampal neurons comparing the expression of the Synj2a splice variant or Rrbp1 transcript. Data are shown as mean ± SEM; Student’s t-test; n=3–5 cultures. (D) Western Blot of lysates from cortical neurons or mouse fibroblasts stained for SYNJ2, RRBP1 and GAPDH. (E) Representative images of Pink1 and β-actin mRNA localization in COS-7 cells with overexpression of the indicated proteins. (F) Manders coefficients of Pink1 and be β-actin RNA colocalization with mitochondria in COS-7 cells overexpressing the indicated proteins. Data are shown as mean ± SEM; Student’s t-test; n ≥ 3 experiments scoring ≥30 cells per condition total. p<0.01 (**). Scale bars = 10μm. For SYNJ2 knockdown in neurons, please refer to Figure S6.
Figure 7.
Figure 7.. RNA-binding by SYNJ2a is necessary for Pink1 mRNA localization to mitochondria
(A) Myc-tagged SYNJ2-RRM constructs expressed in HEK 293T cells and irradiated with 254 nm UV light. Lysates were immunoprecipitated with anti-myc and a representative anti-myc Western Blot is shown. (B) Representative images of soma expressing SYNJ2BP shRNA and either WT or VQL/AAA SYNJ2mito, in addition to the splitVenus reporter for Pink1 mRNA and mitoRasp. (C) Colocalization quantified with Manders coefficient between mitochondria and Pink1 (kinase dead) transcripts for cells as in (B). ANOVA with Tukey’s HSD multiple comparisons test, n = 20–23 soma; p<0.01 (**), p<0.0001 (****). (D) Relative enrichment by RNAseq of transcripts coisolated with SYNJ2mito WT over the RNA-binding VQL/AAA mutant. Mitochondrial transcripts as annotated by MitoCarta3.0 are indicated in green, transcripts analyzed in this manuscript in magenta. Significantly enriched genes were defined based on fold change > 2 and p value < 0.05. Two sided Welch’s t-test, n= 3 biological repeats. (E) Venn diagram detailing the overlap between the SYNJ2 and SYNJ2BP binding transcripts (Qin et al., 2021) and MitoCarta3.0 (Rath et al., 2021). See also Table S1. (F) Representative images displaying the PLA in the presence or absence of Puromycin. (G) Quantification of PLA results as in (F) ANOVA with Tukey’s HSD multiple comparisons test; n ≥ 3–5 experiments scoring ≥15 cells per condition total. p<0.0001 (****). Data are shown as mean ± SEM; scale bars = 10 μm. For β-actin imaging in SYNJ2BP shRNA with WT or VQL/AAA SYNJ2mito treated neurons see Figure S7.

Comment in

References

    1. Ando M, Fiesel FC, Hudec R, Caulfield TR, Ogaki K, Górka-Skoczylas P, Koziorowski D, Friedman A, Chen L, Dawson VL, et al. (2017). The PINK1 p.I368N mutation affects protein stability and ubiquitin kinase activity. Mol. Neurodegener. 12, 32. - PMC - PubMed
    1. Ashrafi G, Schlehe JS, LaVoie MJ, and Schwarz TL (2014). Mitophagy of damaged mitochondria occurs locally in distal neuronal axons and requires PINK1 and Parkin. J. Cell Biol. 206, 655–670. - PMC - PubMed
    1. Biever A, Glock C, Tushev G, Ciirdaeva E, Dalmay T, Langer JD, and Schuman EM (2020). Monosomes actively translate synaptic mRNAs in neuronal processes. Science 367. - PubMed
    1. Bolam JP, and Pissadaki EK (2012). Living on the edge with too many mouths to feed: why dopamine neurons die. Mov. Disord. 27, 1478–1483. - PMC - PubMed
    1. Briley WE, Bondy MH, Randeria PS, Dupper TJ, and Mirkin CA (2015). Quantification and real-time tracking of RNA in live cells using Sticky-flares. Proc. Natl. Acad. Sci. U. S. A. 112, 9591–9595. - PMC - PubMed

Publication types

MeSH terms