. 2022 Mar 8;55(3):475-493.e5.
doi: 10.1016/j.immuni.2022.01.018. Epub 2022 Feb 24.

Tfh-cell-derived interleukin 21 sustains effector CD8+ T cell responses during chronic viral infection

Affiliations

Tfh-cell-derived interleukin 21 sustains effector CD8+ T cell responses during chronic viral infection

Ryan Zander et al. Immunity. .

Abstract

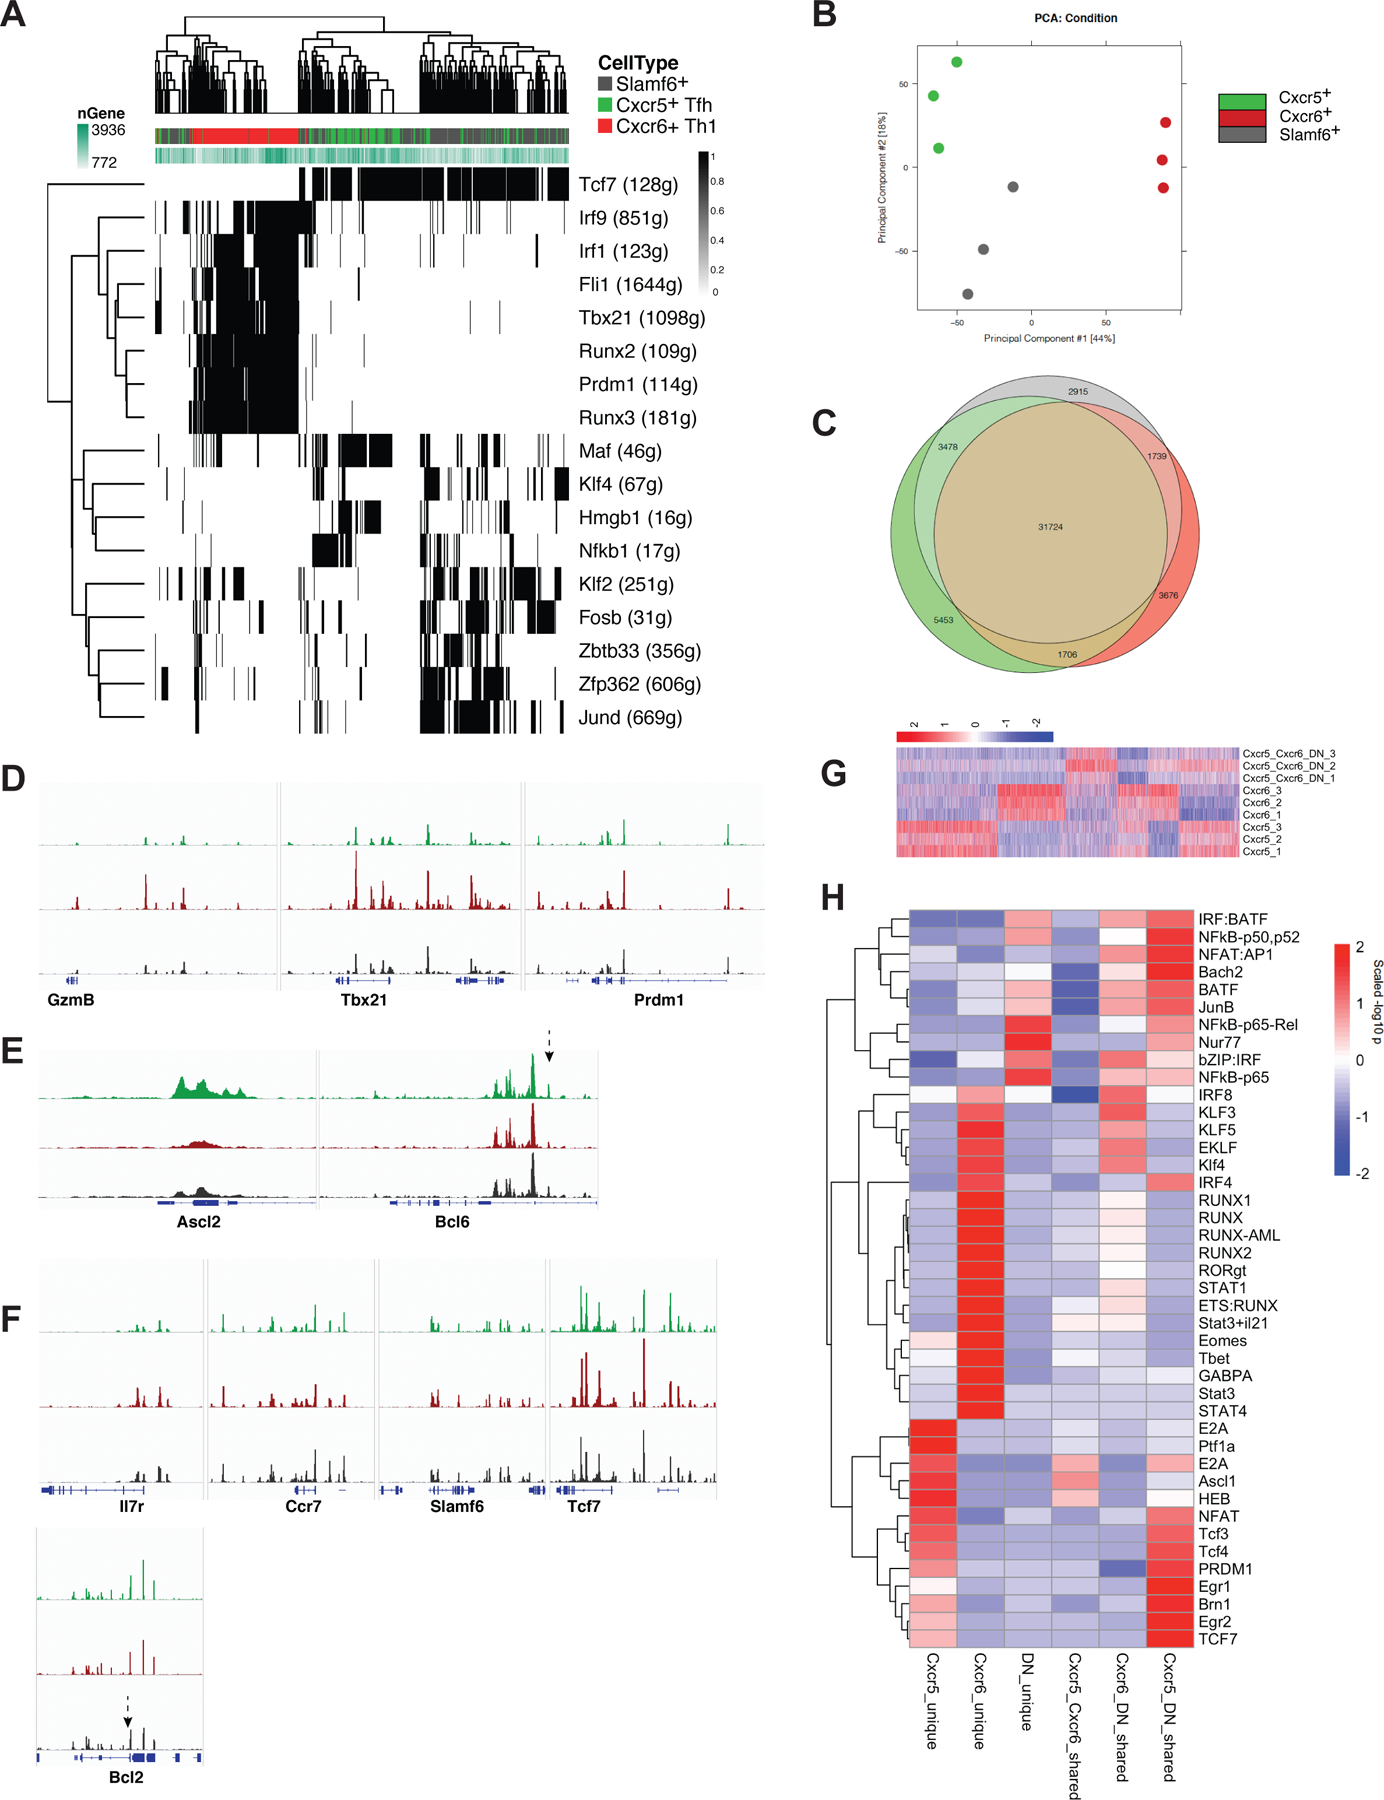
CD4+ T cell-derived interleukin 21 (IL-21) sustains CD8+ T cell responses during chronic viral infection, but the helper subset that confers this protection remains unclear. Here, we applied scRNA and ATAC-seq approaches to determine the heterogeneity of IL-21+CD4+ T cells during LCMV clone 13 infection. CD4+ T cells were comprised of three transcriptionally and epigenetically distinct populations: Cxcr6+ Th1 cells, Cxcr5+ Tfh cells, and a previously unrecognized Slamf6+ memory-like (Tml) subset. T cell differentiation was specifically redirected toward the Tml subset during chronic, but not acute, LCMV infection. Although this subset displayed an enhanced capacity to accumulate and some developmental plasticity, it remained largely quiescent, which may hinder its helper potential. Conversely, mixed bone marrow chimera experiments revealed that Tfh cell-derived IL-21 was critical to sustain CD8+ T cell responses and viral control. Thus, strategies that bolster IL-21+Tfh cell responses may prove effective in enhancing CD8+ T cell-mediated immunity.

Keywords: ATAC-seq; CD4 T cells; IL-21; LCMV Cl13; single-cell RNA sequencing.


Conflict of interest statement

Declaration of interests The authors declare no competing interests.

Figures

Figure 1:
Figure 1:. Sc-RNA-seq reveals heterogeneity among IL-21+ CD4+ T cells during chronic viral infection.
A. Experimental design. IL-21-tRFP 10bit reporter mice were infected with LCMV Cl13, and GP66+ IL-21-tRFP+ CD4+ T cells were sort-purified from these mice on days 7 and 14 p.i. (two mice per time point), and then loaded into the Chromium controller (10X genomics). A scRNAseq library was then prepared. B. UMAP displaying transcriptionally distinct clusters. C. Violin plots (left) and UMAP plots (right) showing expression of Th1-associated genes. D. Violin plots (left) and UMAP plots (right) showing expression of Tfh-associated genes. E. Violin plots (left) and UMAP plots (right) showing expression of memory-associated genes. F-H. Module scores comparing expression profile of Slamf6+, Cxcr5+, and Cxcr6+ subsets to indicated gene signature. See also Figure S1.
Figure 2:
Figure 2:. Differential expression of CXCR6 and CXCR5 defines three functionally distinct CD4+ T cell subsets.
A. Representative flow plots showing the subset distribution of GP66+ CD4+ T cells into CXCR6+, CXCR5+ and DN T cell subsets on day 14 post LCMV Cl13 infection. B-D. Representative flow histograms (B) and summary data (C-D) showing the relative expression of molecules in GP66+ T cell subsets from days 14–21 p.i. E. Summary graph showing the proportion of subsets expressing ki67 on day 10 p.i. F-G. Representative flow plots (F) and summary data (G) showing the proportion of CD4+ T cell subsets capable of producing IFNγ and TNFα after GP66–81 stimulation. H-K. Tri Reporter mice were infected with LCMV Cl13 and the relative expression of IFNγ-YFP, Thy1.1 (IL-10), and IL-21-tRFP was assessed among IL-21+ CD4+ T cell subsets directly ex vivo (without stimulation). H-I. Flow plots (H) and summary data (I) showing the proportion of IFNγ-YFP+ Thy1.1 (IL-10)+ producers among IL-21+CD4+ T cell subsets. J-K. Summary data displaying the per cell expression (gMFI) of Thy1.1 (IL-10), IFNγ-YFP, and IL-21-tRFP in polyclonal IL-21-tRFP+ (J) and GP66+ (K) T cell subsets. L. Bulk RNA-sequencing was performed on IL-21-tRFP+ CXCR6+, CXCR5+ and DN CD44hi CD4+ T cell subsets on day 14 post LCMV Cl13 infection. Heat map showing the relative expression of select genes that were among the top 500 DEGs. Summary data (mean + /− SEM in C-D,F, H-J) are from ≥ 3 mice/group per experiment and are representative of at least two independent experiments. *P < 0.05, **P < 0.01, ***P < 0.0001. See also Figure S2.
Figure 3:
Figure 3:. Th1, Tfh, and Tml subsets are regulated by distinct epigenetic and gene regulatory networks.
A. ScRNAseq data on IL-21-tRFP+ GP66+ CD4+ T cells (from Figure 1) was analyzed using SCENIC (Aibar et al., 2017). Heatmap shows binary regulon activity (black is active, white is inactive) of the 17 regulons found in at least 1% of cells and that correlated (absolute Pearson correlation >0.3) with at least one other regulon. The columns correspond to the cells; the rows correspond to the regulons with downstream target genes that are co-expressed with each TF. Cells were grouped by regulon activity. B-H. ATAC-seq was performed on 50,000 sort-purified CXCR6+, CXCR5+ and DN PD-1hi CD4+ T cell subsets. B. PCA of normalized ATAC-seq counts. C. Venn diagram showing the number of unique and overlapping ChARs between CXCR5+, CXCR6+ and DN subsets. D-F. ATAC-seq tracks at indicated Th1-associated loci (D), Tfh-associated loci (E), or memory gene loci (F). Arrows at Bcl-6 and Bcl2 loci indicate differentially accessible enhancer regions as indicated in text. G. Heatmap showing six epigenetically distinct clusters identified from unsupervised clustering. H. Heatmap showing the enrichment of TF binding motifs identified using HOMER motif analysis on the 6 ChARs sets identified in (G). See also Figure S3.
Figure 4:
Figure 4:. CD4+ T cell differentiation is redirected towards the Tml subset during chronic infection.
A. Summary data showing the kinetics of GP66+ and IL-21-tRFP+ CXCR6+, CXCR5+ and DN subsets during LCMV Cl13 infection. B. Representative flow plots showing the subset distribution of GP66+ CD4+ T cells in various tissues on day 14 p.i. C. Summary data showing the proportion of subsets in indicated tissues on day 14 or 40 p.i. D. Summary data showing the proportion of CD4+ T cell subsets that were intravascularly labeled with CD45.2 antibody. E-G. Representative flow plots (E) and summary data (F-G) showing the proportion of CXCR6+, CXCR5+, and DN subsets, or CXCR5+Ly108+, CXCR5Ly108+, CXCR5Ly108 GP66+ CD4+ T cell subsets on day 14 post LCMV Armstrong or LCMV Cl13 infection. H. Summary graphs showing the kinetics of GP66+ splenic CD4+ T cell subsets. Summary data (mean + /− S.D. in A,H) are from 3–5 mice per time point. Summary data (mean + /− SEM in C-D,F-G) are from 3 mice/group per experiment and are representative of three independent experiments. *P < 0.05, **P < 0.01, ***P < 0.0001. See also Figure S4.
Figure 5:
Figure 5:. Tml cells display an enhanced capacity to accumulate, whereas Tfh cells display an increased capacity to augment TEFF cell differentiation following adoptive transfer.
A. Monocle analysis. B. Experimental design. C-E. Representative flow plots (C) and summary data (D-E) showing the proportion of recovered donor cells and their phenotype. F-H. Representative flow plots (F) and summary data (G-I) showing the proportion, total number, and subset distribution of GP33+ CD8+ T cells into Tpro, Teff, and Texh CD8+ T cell subsets. J. Summary data showing the relative expression of inhibitory receptors on GP33+ CD8+ T cells from either control mice or mice that received either Cxcr6+, Cxcr5+ or DN CD4+ T cells. Summary data (mean + /− SEM in D-E, G-I) are pooled from 2 experiments with 3 mice/group per experiment. Data are representative of three independent experiments. *P < 0.05, **P < 0.01, ***P < 0.0001. See also Figure S5.
Figure 6:
Figure 6:. Sustained antigen presentation is essential to sustain IL-21+Tfh responses and Teff CD8+ T cell differentiation.
A-J. Tri Reporter mice were infected with LCMV Cl13 and treated with isotype control or α-MHC-II blocking antibodies on days 6, 11, and 15 p.i. Virus-specific CD4+ and CD8+ T cell responses were assessed using flow cytometry on day 18 p.i. A-C. Representative flow plots (A) and summary data (B-C) showing the proportion of IL-21+ CD4+ T cells and their distribution into CXCR6+, CXCR5+, and DN subsets. D-E. Summary data displaying the proportion and subset distribution of GP66+ CD4+ T cells in control and α-MHC-II-treated mice. F-G. Representative flow plots (F) and summary data (G) showing the proportion and total number of GCB cells in experimental mice. H-J. Representative flow plots (H) and summary data (I-J) showing the proportion of GP33+ CD8+ T cells and their subset distribution into Tpro, Teff, and Texh CD8+ T cell subsets. Summary data (mean + /− SEM in C-E, G, I-J) are pooled from 3 independent experiments with two experiments containing 3 mice/group, and the third experiment containing 2–3 mice/group. Data are representative of 4 independent experiments. See also Figure S6.
Figure 7:
Figure 7:. Tfh-derived IL-21 is critical to sustain CD8+ Teff responses during chronic viral infection.
A. Experimental design. B-E. Representative flow plots (B) and summary data (C-E) showing the proportion, subset distribution, and total number of GP33+ splenic CD8+ T cells in MBM chimera mice. F. Box and whisker plot displaying viral load in the sera from experimental mice. G. Experimental design. H-J. Representative flow plots (H) and summary data (I-J) showing the proportion and subset distribution of pooled GP33+ GP276+ NP396+-reactive CD8+ T cells in MBM chimera mice. Summary data (mean + /− SEM in C-E) are pooled from 2 experiments with at least 3 mice/group per experiment. Summary data (mean + /− SEM in I-J) is from one experiment with 4 mice/group. Data are representative of two independent experiments. *P < 0.05, **P < 0.01, ***P < 0.0001. See also Figure S7.

References

    1. Aibar S et al. (2017) ‘SCENIC: Single-cell regulatory network inference and clustering’, Nature Methods doi: 10.1038/nmeth.4463. - DOI - PMC - PubMed
    1. Arnold CN et al. (2007) ‘The germinal center response is impaired in the absence of T cell-expressed CXCR5’, European Journal of Immunology, 37(1), pp. 100–109. doi: 10.1002/eji.200636486. - DOI - PubMed
    1. Battegay M et al. (1994) ‘Enhanced establishment of a virus carrier state in adult CD4+T-cell-deficient mice’, Journal of Virology - PMC - PubMed
    1. Baumjohann D et al. (2013) ‘Persistent Antigen and Germinal Center B Cells Sustain T Follicular Helper Cell Responses and Phenotype’, Immunity Elsevier Inc., 38(3), pp. 596–605. doi: 10.1016/j.immuni.2012.11.020. - DOI - PubMed
    1. Beaulieu AM et al. (2014) ‘The transcription factor Zbtb32 controls the proliferative burst of virus-specific natural killer cells responding to infection’, Nature Immunology doi: 10.1038/ni.2876. - DOI - PMC - PubMed

Publication types