. 2022 Apr 11;40(4):365-378.e6.
doi: 10.1016/j.ccell.2022.02.003. Epub 2022 Feb 24.

CD8+ T cells and fatty acids orchestrate tumor ferroptosis and immunity via ACSL4

Affiliations

CD8+ T cells and fatty acids orchestrate tumor ferroptosis and immunity via ACSL4

Peng Liao et al. Cancer Cell. .

Abstract

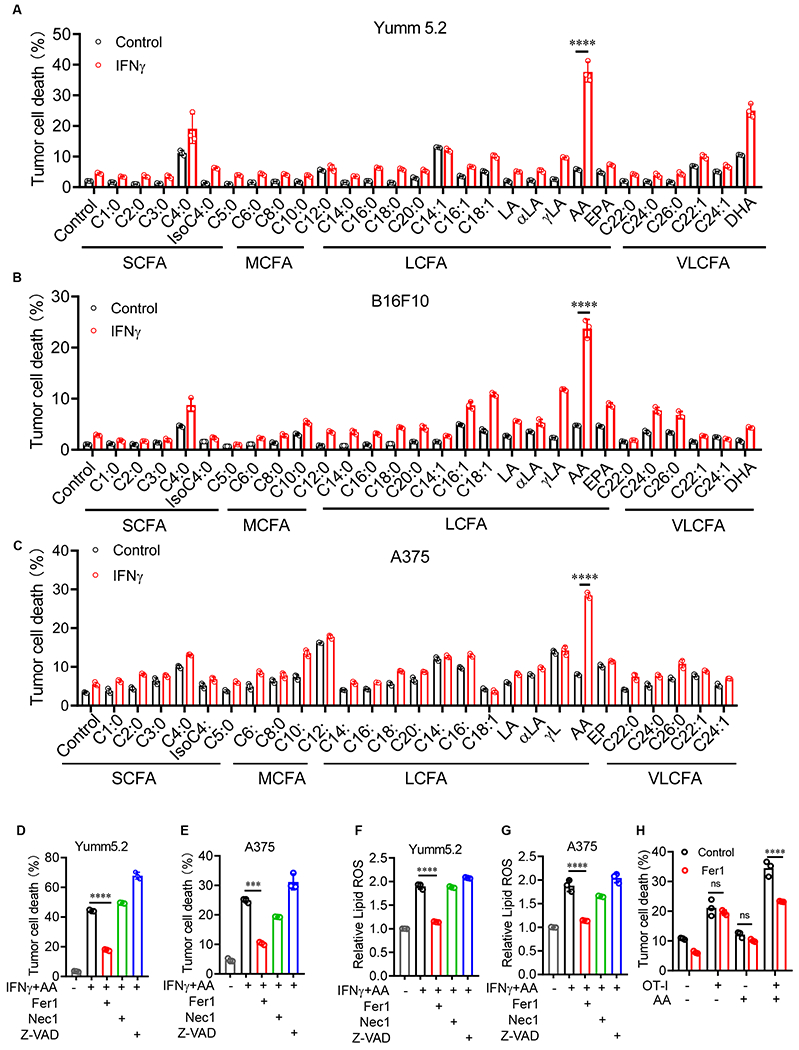
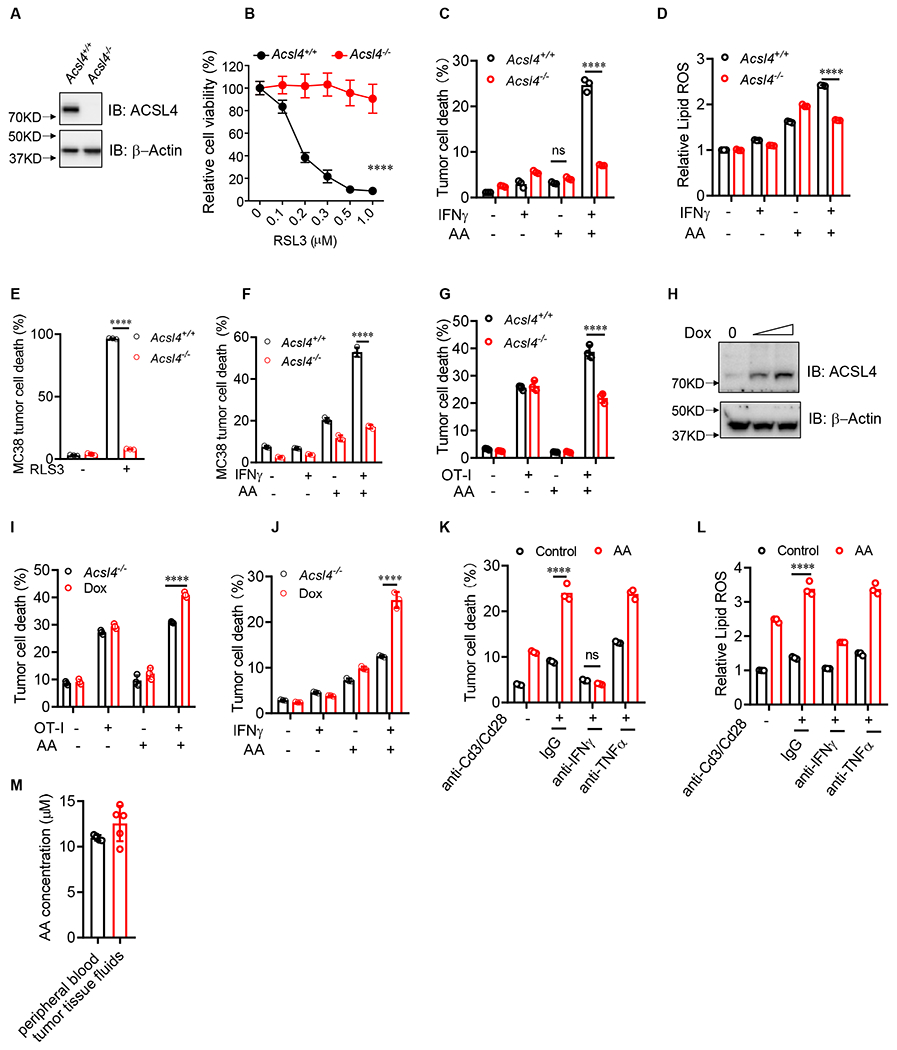
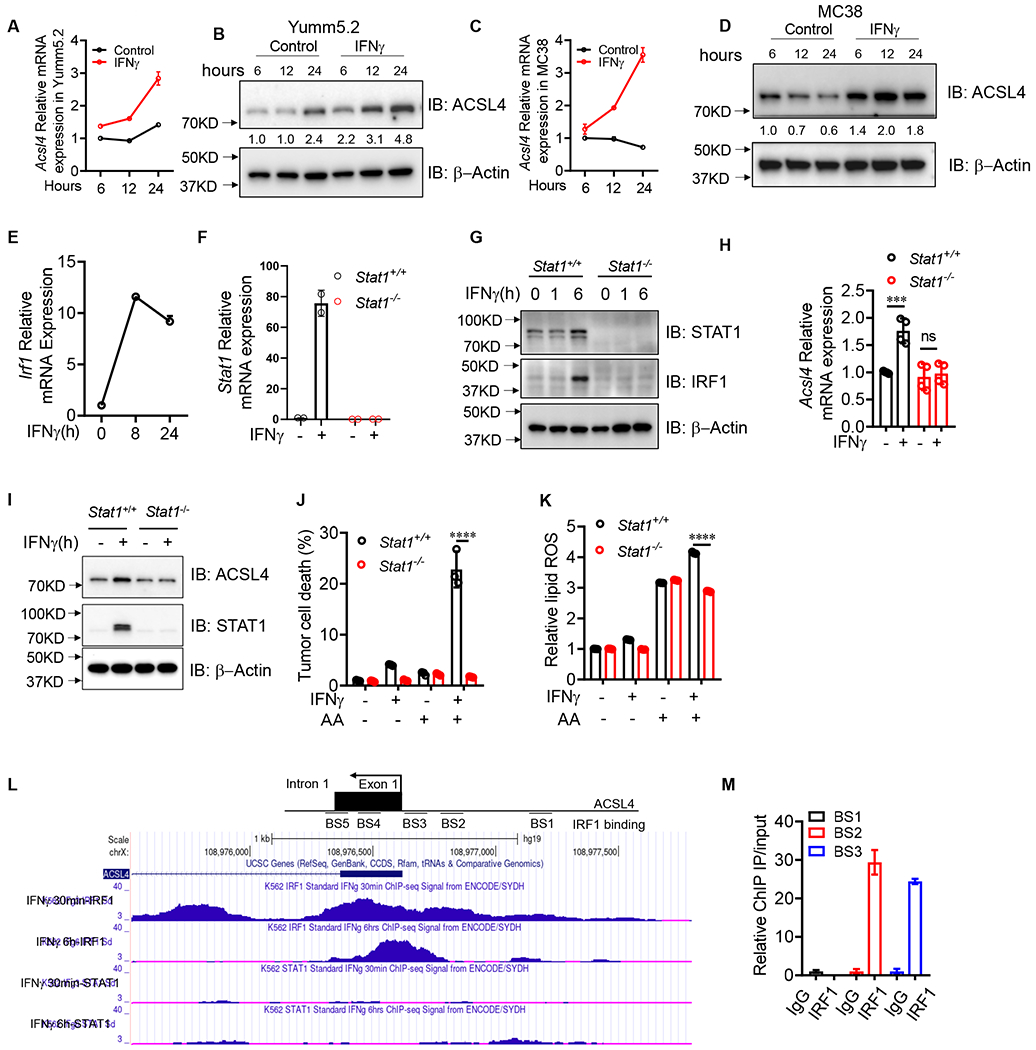
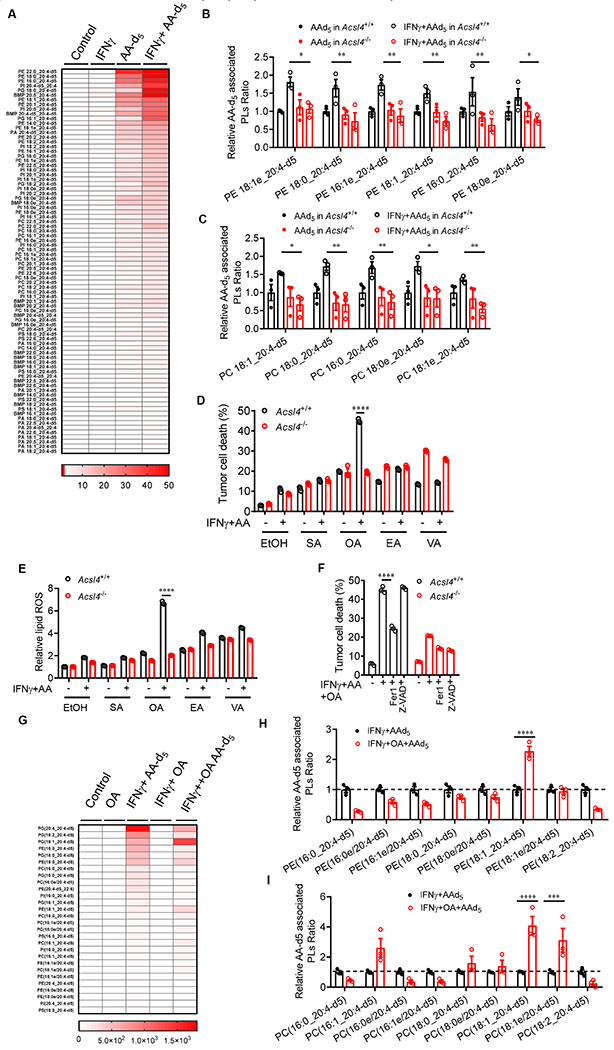
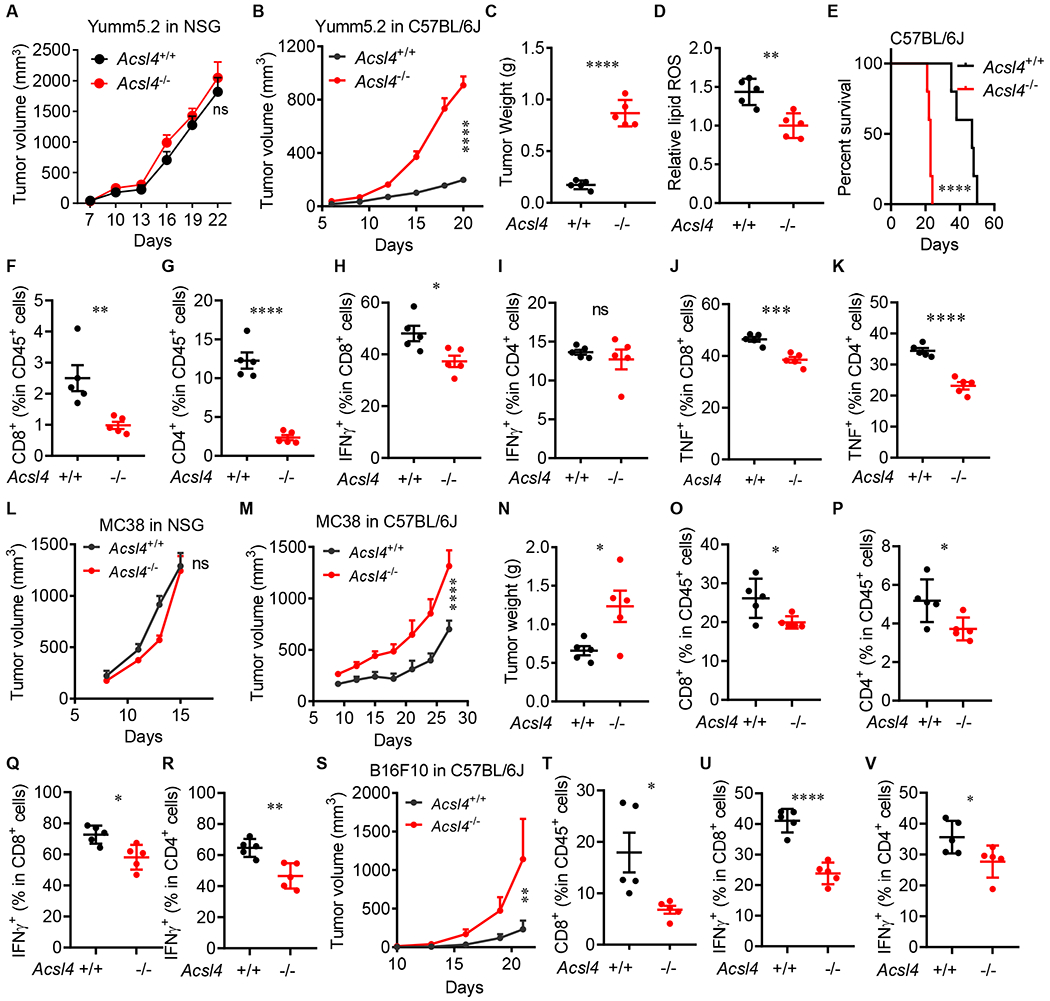
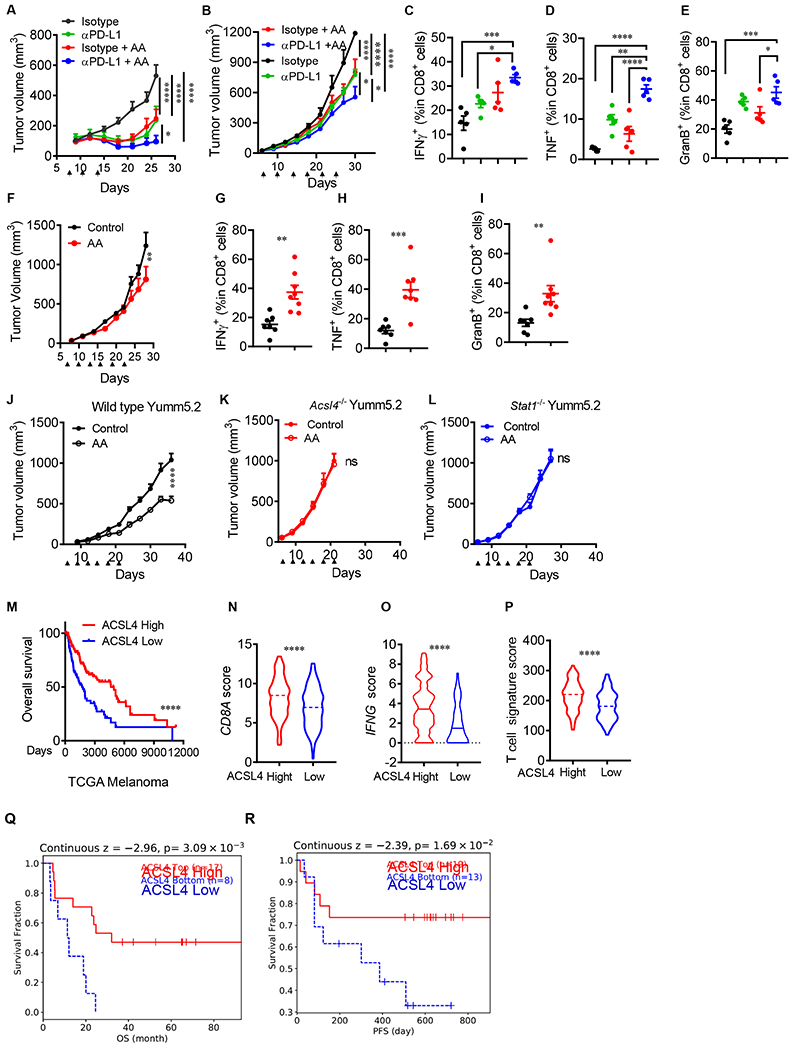
Tumor cell intrinsic ferroptosis-initiating mechanisms are unknown. Here, we discover that T cell-derived interferon (IFN)γ in combination with arachidonic acid (AA) induces immunogenic tumor ferroptosis, serving as a mode of action for CD8+ T cell (CTL)-mediated tumor killing. Mechanistically, IFNγ stimulates ACSL4 and alters tumor cell lipid pattern, thereby increasing incorporations of AA into C16 and C18 acyl chain-containing phospholipids. Palmitoleic acid and oleic acid, two common C16 and C18 fatty acids in blood, promote ACSL4-dependent tumor ferroptosis induced by IFNγ plus AA. Moreover, tumor ACSL4 deficiency accelerates tumor progression. Low-dose AA enhances tumor ferroptosis and elevates spontaneous and immune checkpoint blockade (ICB)-induced anti-tumor immunity. Clinically, tumor ACSL4 correlates with T cell signatures and improved survival in ICB-treated cancer patients. Thus, IFNγ signaling paired with selective fatty acids is a natural tumor ferroptosis-promoting mechanism and a mode of action of CTLs. Targeting the ACSL4 pathway is a potential anti-cancer approach.

Keywords: ACSL4; PD-L1; T cell; arachidonic acid; cancer; ferroptosis; immunotherapy; interferon; oleic acid; palmitoleic acid.


Conflict of interest statement

Declaration of interests The authors declare no competing interests.

Figures

Figure 1.
Figure 1.
Arachidonic acid (AA) and IFNγ coordinately induce tumor cell ferroptosis (A-C) Percentage of dead Yumm5.2 (A), B16F10 (B), and A375 (C) cells that were treated with IFNγ and common fatty acids for 3 days (n = 3), Table S1. (D and E) Percentage of dead Yumm5.2 (D) and A375 (E) cells treated with IFNγ and AA in the presence of ferrostatin-1 (Fer1; 2 μM), Necostatin-1 (Nec1; 1μM), or z-VAD-FMK (z-VAD; 10 μM) for 3 days. 10 (D) and 50 (E) ng/mL IFNγ, and 20 (D) and 30 (E) μM AA (n = 3). (F and G) Lipid ROS in Yumm5.2 (F) and A375 (G) cells treated with IFNγ and AA in the presence of ferrostatin-1 (Fer1; 2 μM) for 3 days. 10 (F) and 50 (G) ng/mL IFNγ, and 20 (F) and 30 (G) μM AA (n=3). (H) Percentage of dead OVA-pulsed Yumm5.2 cells in co-cultures with OT-I cells (tumor: OT-I ratio of 1:2) in the presence of AA (20 μM) and (Fer1; 2 μM) for 48 hours (n = 3). Data are shown as mean ± s.d., two-way ANOVA (A-C and H) or one-way ANOVA (D-G). ***P < 0.001, ****P < 0.0001, and ns, not significant. See also Figure S1 and Table S1.
Figure 2.
Figure 2.
Arachidonic acid and IFNγ induce tumor cell ferroptosis via ACSL4 (A) Immunoblots of ACSL4 in Acsl4+/+ or Acsl4−/− Yumm5.2 cells. (B) Relative cell viability of Acsl4+/+ or Acsl4−/− Yumm5.2 cells treated with different concentrations of RSL3 for 24 hours (n = 3). (C and D) Percentage of dead cells (C) or relative lipid ROS (D) in Acsl4+/+ or Acsl4−/− Yumm5.2 cells treated with IFNγ and AA for 3 days (n = 3). (E) Percentage of dead Acsl4+/+ or Acsl4−/− MC38 cells treated with RSL3 for 24 hours (n = 3). (F) Percentage of dead cells in Acsl4+/+ or Acsl4−/− MC38 cells treated with IFNγ and AA for 3 days (n = 3). (G) Percentage of dead OVA+ Acsl4+/+ or Acsl4−/− Yumm5.2 cells cultured with OT-I cells (tumor: OT-I ratio of 1:2) in the presence of AA for 48 hours (n = 3). (H) Immunoblots of Acsl4 in inducible Acsl4 expression in Acsl4−/− Yumm5.2 cells transfected with Tet-On inducible ACSL4 expression plasmids. Cells were treated with or without Dox (0.2 or 0.5 μg/ml). (I) Percentage of dead OVA+ in Acsl4−/− Yumm5.2 cells cultured with OT-I cells in the presence of AA for 48 hours. Yumm5.2 cells were pretreated with or without doxycycline (0.2 μg/ml) for 2 days to induce ACSL4 expression (n = 3). (J) Percentage of dead Yumm5.2 cells treated with IFNγ and AA for 3 days. Yumm5.2 cells were pretreated with or without doxycycline (1 μg/ml) for 2 days to induce Acsl4 expression (n = 3). (K and L) Percentage of dead cells (K) or relative lipid ROS (L) in Acsl4+/+ or Acsl4−/− Yumm5.2 cells treated with supernatant from activated CD8+ T cells in the presence of anti-IFNγ or anti-TNFα blocking mAbs for 3 days (n = 3). (M) AA levels in peripheral blood or Yumm5.2 tumor tissues of tumor-bearing mice measured by ELISA (n = 4- 5). Data are shown as mean ± s.d., two-way ANOVA (B-G and I-L). ****P < 0.0001, and ns, significant. Immunoblots, one of three experiments is shown See also Figure S2.
Figure 3.
Figure 3.
IFNγ stimulates ACSL4 expression via STAT1 and IRF1 signaling (A and B) Acsl4 transcripts (A) and proteins (B) in Yumm5.2 cells treated by IFNγ at indicated times (n=2-3). (C and D) Acsl4 transcripts (C) and proteins (D) in MC38 cells treated by IFNγ at different times (n =2-3). (E) Irf1 transcripts in Yumm5.2 cells treated with IFNγ at different times (n =2). (F) Stat1 transcripts in Stat1+/+ or Stat1−/− Yumm5.2 cells treated with IFNγ for 24 hours (n =2). (G) Immunoblots of STAT1 and IRF1 in Stat1+/+ or Stat1−/− Yumm5.2 cells treated with IFNγ at different times. (H and I) Acsl4 transcripts (H) and proteins (I) in Stat1+/+ or Stat1−/− Yumm5.2 cells treated by IFNγ for 24 hours (n = 3-4). (J and K) Percentage of dead cells (J) and relative lipid ROS (K) in Stat1+/+ or Stat1−/− Yumm5.2 cells treated with IFNγ and AA for 3 days (n = 3). (L) IRF1 ChIP-seq data from ENCODE shows the IRF1 binding sites at the ACSL4 promoter region. (M) ChIP of IRF1 in A375 cells treated with or without IFNγ. IRF1 binding to ACSL4 TSS region was quantified by qPCR. Results are expressed as fold change in the specific site occupancy over control (n = 2). Data are shown as mean ± s.d., two-way ANOVA (H, J and K). ***P < 0.001, ****P < 0.0001, and ns, not significant. Immunoblots, one of three experiments is shown.
Figure 4.
Figure 4.
IFNγ reprograms ACSL4 associated phospholipids to induce tumor ferroptosis (A-C) Effect of IFNγ plus AA-d5 on tumor phospholipids. Yumm5.2 cells treated with IFNγ(10 ng/ml), AA-d5 (10μM), and their combination for 48 hours. Lipids were analyzed by ultra-performance liquid chromatography–tandem mass spectrometry (UPLC-MS/MS). Heatmap shows phospholipid fold-changes in Yumm5.2 cells (A). Phosphatidylethanolamine (PE), phosphatidylcholine (PC), phosphatidylglycerol (PG), phosphatidylserine (PS), phosphatidylinositol (PI), phosphatidic acid (PA) and Bis (monoacylglycero) phosphate (BMP), “e” represents ether phospholipid. The relative changes of different phospholipids (A), PE (B), and PC (C) that contain C16 and C18 acyl chain are shown (n = 3). (D and E) Percentage of dead cells (D) or relative lipid ROS (E) in Acsl4+/+ or Acsl4−/− Yumm5.2 cells treated with IFNγ and low dose AA (10 μM) for 48 hours in the presence of stearic acid (SA, 20 μM), oleic acid (OA, 60 μM), elaidic acid (EA, 60 μM), and trans-vaccenic acid (VA, 60 μM) (n = 3). (F) Percentage of dead cells in Acsl4+/+ or Acsl4−/− Yumm5.2 cells treated with IFNγ, AA (10 μM), and OA (60 μM) in the presence of Fer1 or z-VAD for 48 hours (n = 3). (G-I) Effect of IFNγ plus AA-d5 and OA on tumor phospholipids. Yumm5.2 cells treated with OA (60 μM), IFNγ (10ng/ml) + AA-d5 (10μM), IFNγ + OA or their combination for 48 hours. Lipids were analyzed by UPLS-MS/MS. Heatmap shows phospholipid fold-changes in Yumm5.2 cells (G). The relative changes of different phospholipids (G), and PE (H), and PC (I) of C16 and C18 acyl chain-containing phospholipids are shown in Yumm5.2 cells (n = 3). Data are shown as mean ± s.e.m.(A-C and G-I), mean ± s.d.(D-F), two-way ANOVA (B-F, H and L). *P < 0.05, **P < 0.01, ***P < 0.001, and ****P < 0.0001. See also Figure S3 and Table S2.
Figure 5.
Figure 5.
Tumor ACSL4 affects anti-tumor immunity (A and B) Growth of Acsl4+/+ or Acsl4−/− Yumm5.2 tumors in NSG mice (A) or C57BL/6 mice (B) (n = 5). (C) Tumor weights of Acsl4+/+ or Acsl4−/− Yumm5.2 tumors in C57BL/6 mice (n = 5). (D) Relative lipid ROS in Acsl4+/+ or Acsl4−/− Yumm5.2 tumors in C57BL/6 mice (n = 5). (E) Overall survival of C57BL/6 mice bearing Acsl4+/+ or Acsl4−/− Yumm5.2 tumors (n = 5). (F and G) Percentages of CD8+ (F) and CD4+ (G) T cells in CD45+ cells of Yumm5.2 tumors (n = 5). (H-K) Percentages of IFNγ+ (H and I) and TNFα+ (J and K) in CD8+ and CD4+ T cells of Yumm5.2 tumors (n =5). (L and M) Growth of Acsl4+/+ or Acsl4−/− MC38 tumors in NSG mice (L) or C57BL/6 mice (n = 5-7). (N) Tumor weights of Acsl4+/+ or Acsl4−/− MC38 tumors in C57BL/6 mice (n = 5). (O and P) Percentages of CD8+ (O) and CD4+ (P) T cells in CD45+ cells of MC38 tumors (n = 5). (Q and R) Percentages of IFNγ+ CD8+ (Q) and IFNγ+ CD4+ (R) T cells of MC38 tumors (n = 5). (S) Growth of Acsl4+/+ or Acsl4−/− B16F10 tumors in C57BL/6 mice (n = 5). (T) Percentages of CD8+ T cells in CD45+ cells of B16F10 tumors (n = 5). (U and V) Percentages of IFNγ+ CD8+ (U) and IFNγ+ CD4+ (V) T cells of B16F10 tumors (n =5). Data are shown as mean ± s.e.m. (A-C and G-I), two-way ANOVA (A, B, L, M and S), two-tailed t-test (C, D, F-K, N-R and T-V) or Log-rank test (E), *P < 0.05, **P < 0.01, ***P < 0.001, ****P < 0.0001, and ns, not significant. See also Figure S4.
Figure 6.
Figure 6.
Targeting tumor ferroptosis sensitizes checkpoint therapy (A) Effect of AA and anti-PD-L1 on MC38 tumor growth. Mice bearing subcutaneous MC38 tumors were treated isotype antibody, anti-PD-L1 antibody, AA, or anti-PD-L1 antibody plus AA (arrowhead). Tumor volume is shown (n = 5). (B-E) Effects of AA and anti-PD-L on Yumm5.2 tumor growth and immune responses. Yumm5.2 tumor-bearing mice were treated with isotype antibody, anti-PD-L1 antibody, AA, or anti-PD-L1 plus AA (arrowhead). Tumor volume is shown (B). Percentages of tumor infiltrating IFNγ+ (C), TNFα+ (D), and granzyme B+ (E) CD8+ T cells were analyzed by FACS (n=5). (F-I) Effects of AA administration on LLC tumor growth and immune responses. LLC tumor-bearing mice were treated with PBS, phosphate-buffered saline (Control), and AA (arrowhead). Tumor volume is shown (F). Percentages of tumor infiltrating IFNγ+ (G), TNFα+ (H), and granzyme B+ (I) CD8+ T cells were analyzed by FACS (n = 7-8). (J-L) Effect of AA administration on tumor growth in vivo. Wild type (J), Acsl4−/−(K), and Stat1−/− (L) Yumm5.2 tumor-bearing mice were treated with PBS and AA (arrowhead). Tumor volume is shown (n=8-9). (M) Kaplan-Meier survival curves for melanoma patients with Low (bottom 25%) or High (top 25%) melanoma ACSL4 transcripts in TCGA dataset. (N-P) Correlation between ACSL4 transcripts and immune genes - including CD8A (N), IFNG (O), and T cell signature (P) in TCGA dataset in patients with melanoma expressing High (n = 120) or Low (n = 120) levels of ACSL4. Dotted lines: median. (Q and R) Kaplan-Meier survival curves for melanoma patients having received adoptive T cell therapy (ACT) with High (n = 17) and Low (n = 8) levels of tumor ACSL4 transcripts (Lauss et al., 2017)(Q) or having received the combination of anti-PD-1 and anti-CTLA-4 with High (n = 19) and Low (n = 13) levels of tumor ACSL4 transcripts (Gide et al., 2019)(R). Data are shown as mean ± s.e.m., two-way ANOVA (A, B, F and J-L), one-way ANOVA (C-E), two-tailed t-test (G-I and N-P) or Log-rank test (M, Q and R), *P< 0.05, **P < 0.01, ***P < 0.001, ****P < 0.0001, and ns, not significant. See also Figures S5 and S6.

Comment in

References

    1. Ayers M, Lunceford J, Nebozhyn M, Murphy E, Loboda A, Kaufman DR, Albright A, Cheng JD, Kang SP, Shankaran V, et al. (2017). IFN-gamma-related mRNA profile predicts clinical response to PD-1 blockade. J Clin Invest 127, 2930–2940. - PMC - PubMed
    1. Bersuker K, Hendricks JM, Li Z, Magtanong L, Ford B, Tang PH, Roberts MA, Tong B, Maimone TJ, Zoncu R, et al. (2019). The CoQ oxidoreductase FSP1 acts parallel to GPX4 to inhibit ferroptosis. Nature 575, 688–692. - PMC - PubMed
    1. Boroughs LK, and DeBerardinis RJ (2015). Metabolic pathways promoting cancer cell survival and growth. Nat Cell Biol 17, 351–359. - PMC - PubMed
    1. Bottcher JP, Bonavita E, Chakravarty P, Blees H, Cabeza-Cabrerizo M, Sammicheli S, Rogers NC, Sahai E, Zelenay S, and Reis e Sousa C (2018). NK Cells Stimulate Recruitment of cDC1 into the Tumor Microenvironment Promoting Cancer Immune Control. Cell 172, 1022–1037 e1014. - PMC - PubMed
    1. Conrad M, and Pratt DA (2019). The chemical basis of ferroptosis. Nat Chem Biol 15, 1137–1147. - PubMed

Publication types