

Classifying Conduct Disorder Using a Biopsychosocial Model and Machine Learning Method
- PMID: 35217219
- PMCID: PMC9393206
- DOI: 10.1016/j.bpsc.2022.02.004
Classifying Conduct Disorder Using a Biopsychosocial Model and Machine Learning Method
Abstract
Background: Conduct disorder (CD) is a common syndrome with far-reaching effects. Risk factors for the development of CD span social, psychological, and biological domains. Researchers note that predictive models of CD are limited if the focus is on a single risk factor or even a single domain. Machine learning methods are optimized for the extraction of trends across multidomain data but have yet to be implemented in predicting the development of CD.
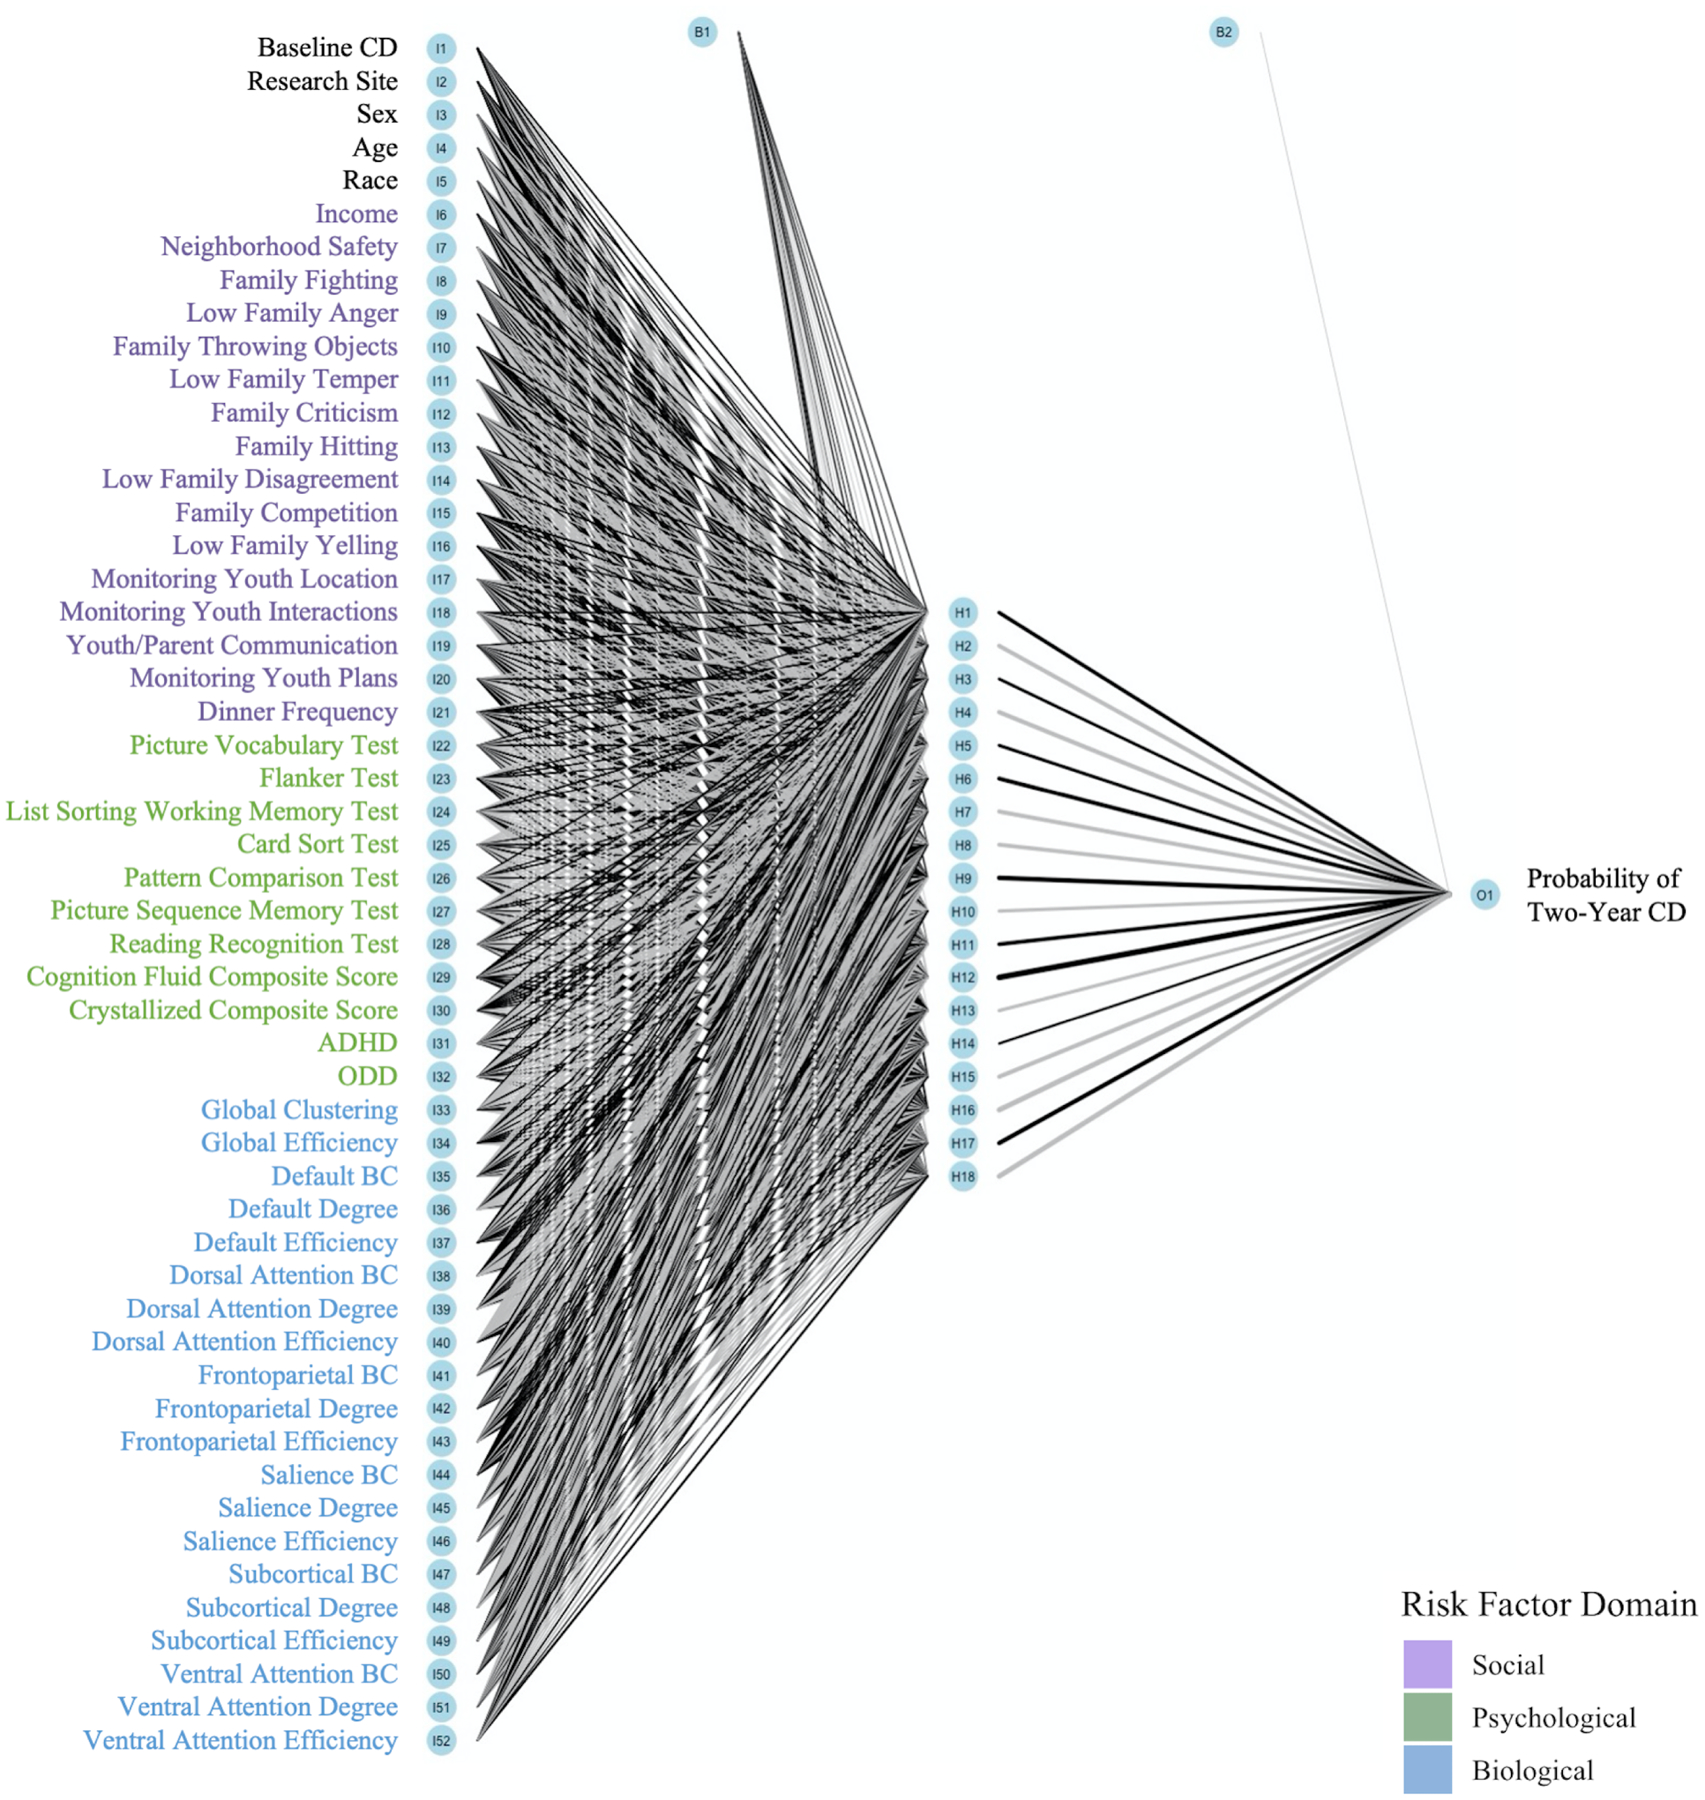
Methods: Social (e.g., family, income), psychological (e.g., psychiatric, neuropsychological), and biological (e.g., resting-state graph metrics) risk factors were measured using data from the baseline visit of the Adolescent Brain Cognitive Development Study when youth were 9 to 10 years old (N = 2368). Applying a feed-forward neural network machine learning method, risk factors were used to predict CD diagnoses 2 years later.
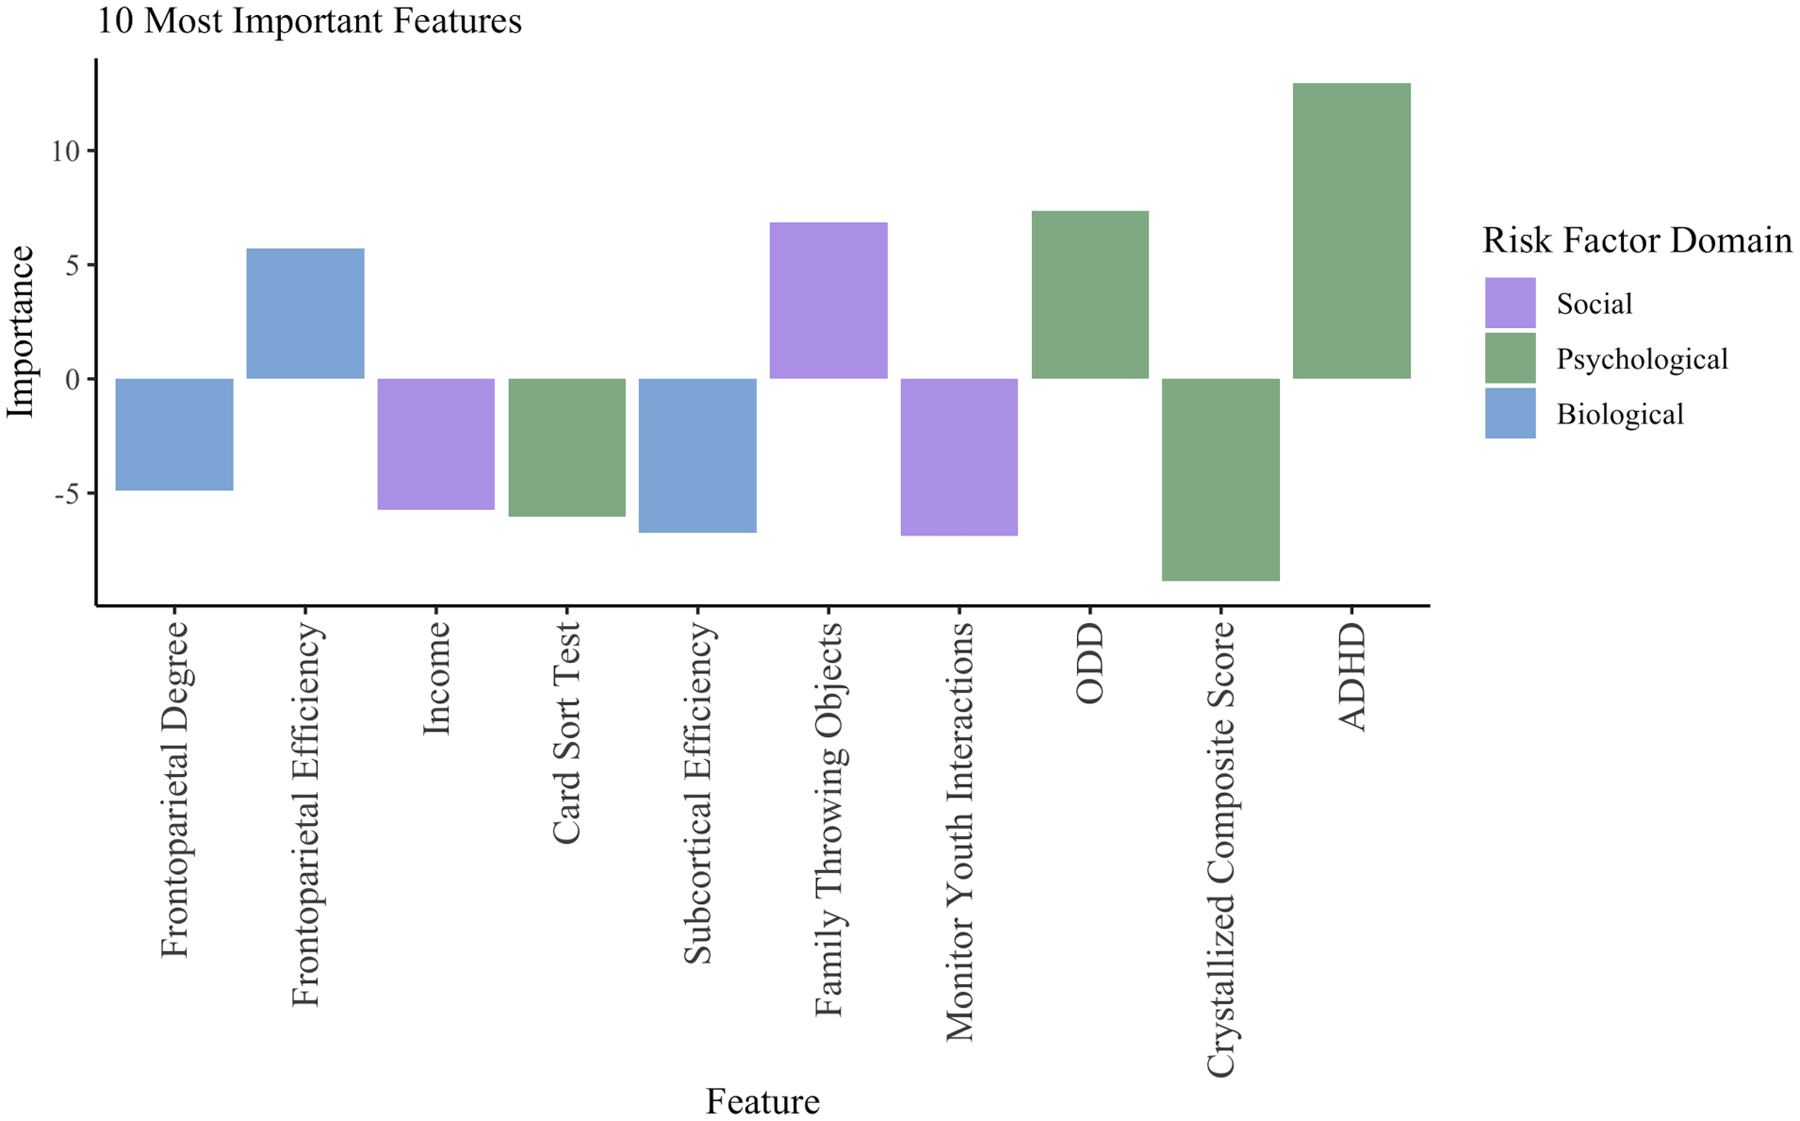
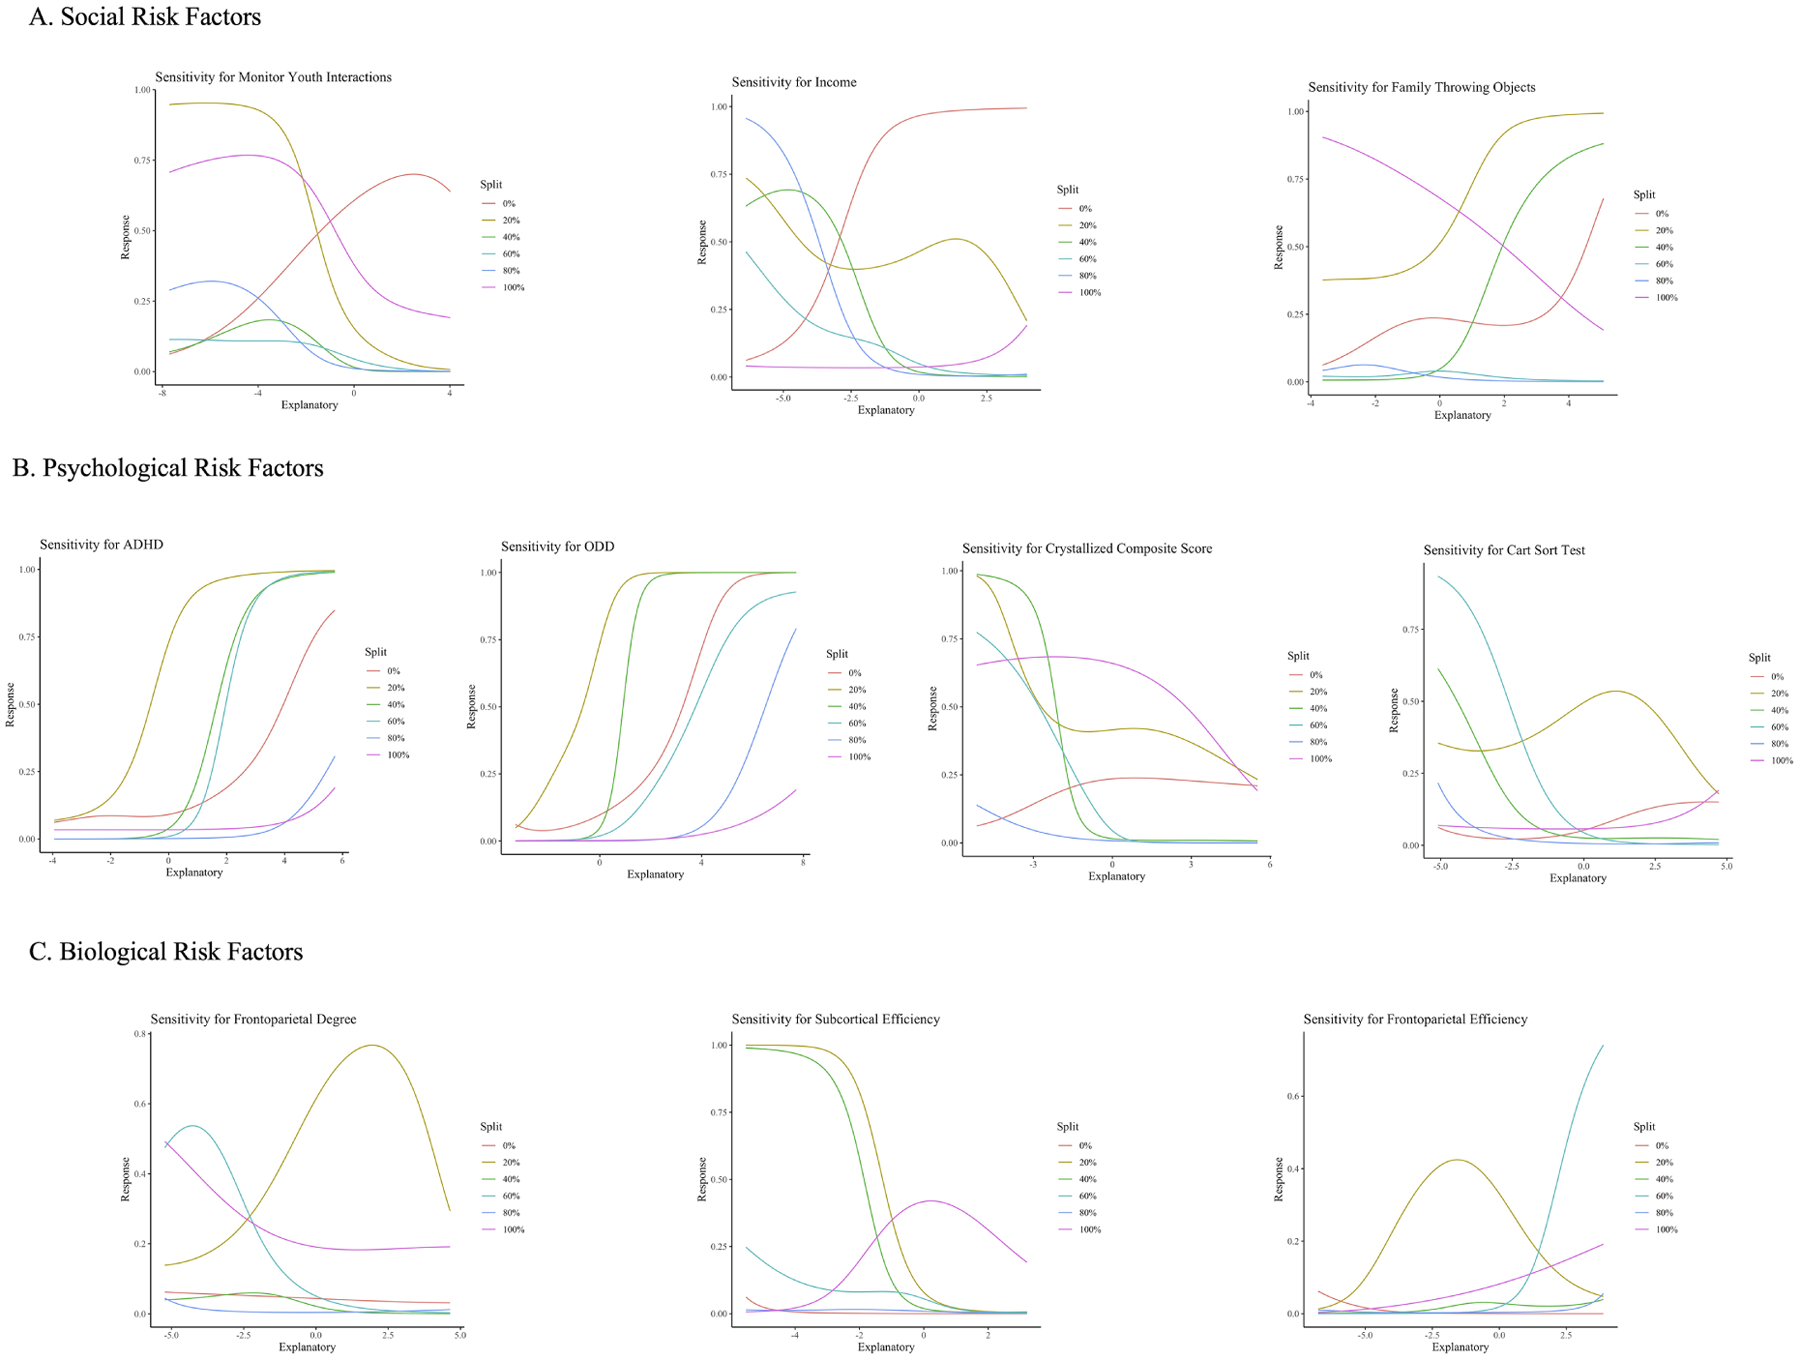
Results: A model with factors that included social, psychological, and biological domains outperformed models representing factors within any single domain, predicting the presence of a CD diagnosis with 91.18% accuracy. Within each domain, certain factors stood out in terms of their relationship to CD (social: lower parental monitoring, more aggression in the household, lower income; psychological: greater attention-deficit/hyperactivity disorder and oppositional defiant disorder symptoms, worse crystallized cognition and card sorting performance; biological: disruptions in the topology of subcortical and frontoparietal networks).
Conclusions: The development of an accurate, sensitive, and specific predictive model of CD has the potential to aid in prevention and intervention efforts. Key risk factors for CD appear best characterized as reflecting unpredictable, impulsive, deprived, and emotional external and internal contexts.
Keywords: Biopsychosocial; Conduct disorder; Family; Graph analysis; Machine learning.
Copyright © 2022 Society of Biological Psychiatry. Published by Elsevier Inc. All rights reserved.
Conflict of interest statement
Figures
Similar articles
-
Health-related quality of life in children and adolescents who have a diagnosis of attention-deficit/hyperactivity disorder.Pediatrics. 2004 Nov;114(5):e541-7. doi: 10.1542/peds.2004-0844. Pediatrics. 2004. PMID: 15520087
-
Family environment in attention deficit hyperactivity, oppositional defiant and conduct disorders.Aust N Z J Psychiatry. 2000 Jun;34(3):453-7. doi: 10.1080/j.1440-1614.2000.00735.x. Aust N Z J Psychiatry. 2000. PMID: 10881969
-
START NOW: a cognitive behavioral skills training for adolescent girls with conduct or oppositional defiant disorder - a randomized clinical trial.J Child Psychol Psychiatry. 2024 Mar;65(3):316-327. doi: 10.1111/jcpp.13896. Epub 2023 Oct 10. J Child Psychol Psychiatry. 2024. PMID: 37814906 Clinical Trial.
-
Impaired neurocognitive functions affect social learning processes in oppositional defiant disorder and conduct disorder: implications for interventions.Clin Child Fam Psychol Rev. 2012 Sep;15(3):234-46. doi: 10.1007/s10567-012-0118-7. Clin Child Fam Psychol Rev. 2012. PMID: 22790712 Review.
-
Current issues in the diagnosis of attention deficit hyperactivity disorder, oppositional defiant disorder, and conduct disorder.Annu Rev Clin Psychol. 2012;8:77-107. doi: 10.1146/annurev-clinpsy-032511-143150. Epub 2011 Dec 21. Annu Rev Clin Psychol. 2012. PMID: 22035245 Free PMC article. Review.
Cited by
-
Antisocial behavior is associated with reduced frontoparietal network efficiency in youth.Soc Cogn Affect Neurosci. 2023 Jun 16;18(1):nsad026. doi: 10.1093/scan/nsad026. Soc Cogn Affect Neurosci. 2023. PMID: 37148314 Free PMC article.
-
COMT Val/Met, stressful life events and externalizing behaviors in youth: A longitudinal study from the ABCD sample.Heliyon. 2023 Oct 21;9(11):e21126. doi: 10.1016/j.heliyon.2023.e21126. eCollection 2023 Nov. Heliyon. 2023. PMID: 38027832 Free PMC article.
-
Predicting the onset of mental health problems in adolescents.Psychol Med. 2025 Apr 30;55:e128. doi: 10.1017/S003329172500087X. Psychol Med. 2025. PMID: 40302646 Free PMC article.
-
Comparing the influence of social risk factors on machine learning model performance across racial and ethnic groups in home healthcare.Nurs Outlook. 2025 May-Jun;73(3):102431. doi: 10.1016/j.outlook.2025.102431. Epub 2025 May 7. Nurs Outlook. 2025. PMID: 40339458
-
Automated machine learning for classification and regression: A tutorial for psychologists.Behav Res Methods. 2025 Aug 18;57(9):262. doi: 10.3758/s13428-025-02684-5. Behav Res Methods. 2025. PMID: 40826202
References
-
- American Psychiatric Association (2013): Diagnostic and statistical manual of mental disorders (DSM-5). Washington, D. C.: American Psychiatric Publishing.
-
- Fairchild G, Hawes DJ, Frick PJ, Copeland WE, Odgers CL, Franke B, et al. (2019): Conduct disorder. Nature Reviews Disease Primers. 5:43. - PubMed
-
- Loeber R, Burke JD, Pardini DA (2009): Development and etiology of disruptive and delinquent behavior. Annual Review of Clinical Psychology. 5:291–310. - PubMed
-
- Pauli R, Tino P, Rogers JC, Baker R, Clanton R, Birch P, et al. (2020): Positive and negative parenting in conduct disorder with high versus low levels of callous–unemotional traits. Development and psychopathology. 1–12. - PubMed
Publication types
MeSH terms
Grants and funding
- U24 DA041147/DA/NIDA NIH HHS/United States
- U01 DA051039/DA/NIDA NIH HHS/United States
- U01 DA041120/DA/NIDA NIH HHS/United States
- U01 DA051018/DA/NIDA NIH HHS/United States
- U24 DA041123/DA/NIDA NIH HHS/United States
- U01 DA051038/DA/NIDA NIH HHS/United States
- U01 DA051037/DA/NIDA NIH HHS/United States
- U01 DA051016/DA/NIDA NIH HHS/United States
- U01 DA041106/DA/NIDA NIH HHS/United States
- U01 DA041117/DA/NIDA NIH HHS/United States
- U01 DA041148/DA/NIDA NIH HHS/United States
- U01 DA041174/DA/NIDA NIH HHS/United States
- UL1 TR001863/TR/NCATS NIH HHS/United States
- U01 DA041093/DA/NIDA NIH HHS/United States
- U01 DA041134/DA/NIDA NIH HHS/United States
- U01 DA041022/DA/NIDA NIH HHS/United States
- U01 DA041156/DA/NIDA NIH HHS/United States
- U01 DA050987/DA/NIDA NIH HHS/United States
- U01 DA041025/DA/NIDA NIH HHS/United States
- U01 DA050989/DA/NIDA NIH HHS/United States
- U01 DA041089/DA/NIDA NIH HHS/United States
- U01 DA050988/DA/NIDA NIH HHS/United States
- U01 DA041028/DA/NIDA NIH HHS/United States
- U01 DA041048/DA/NIDA NIH HHS/United States
LinkOut - more resources
Full Text Sources
Medical
