. 2022 Mar 15;119(11):e2116730119.
doi: 10.1073/pnas.2116730119.

Specialized interferon action in COVID-19

Affiliations

Specialized interferon action in COVID-19

Matthew D Galbraith et al. Proc Natl Acad Sci U S A. .

Abstract

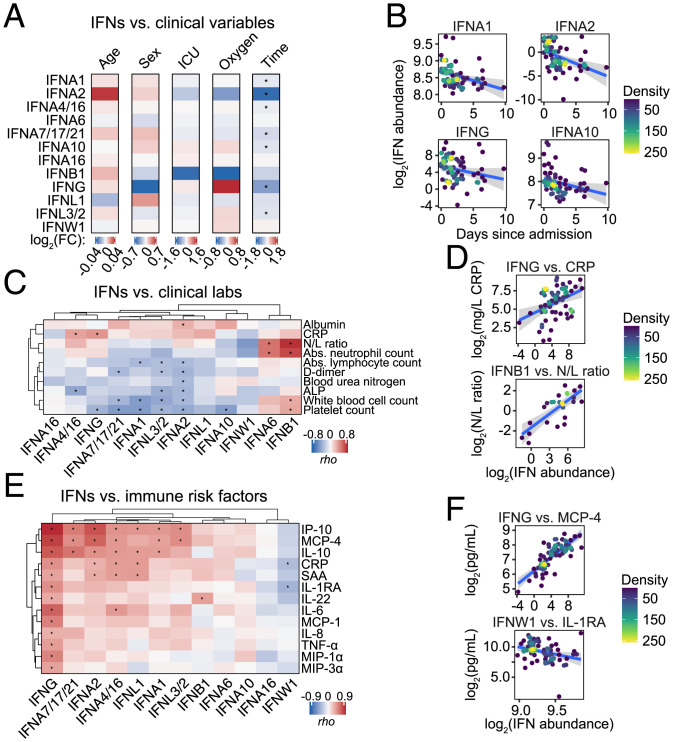
The impacts of interferon (IFN) signaling on COVID-19 pathology are multiple, with both protective and harmful effects being documented. We report here a multiomics investigation of systemic IFN signaling in hospitalized COVID-19 patients, defining the multiomics biosignatures associated with varying levels of 12 different type I, II, and III IFNs. The antiviral transcriptional response in circulating immune cells is strongly associated with a specific subset of IFNs, most prominently IFNA2 and IFNG. In contrast, proteomics signatures indicative of endothelial damage and platelet activation associate with high levels of IFNB1 and IFNA6. Seroconversion and time since hospitalization associate with a significant decrease in a specific subset of IFNs. Additionally, differential IFN subtype production is linked to distinct constellations of circulating myeloid and lymphoid immune cell types. Each IFN has a unique metabolic signature, with IFNG being the most associated with activation of the kynurenine pathway. IFNs also show differential relationships with clinical markers of poor prognosis and disease severity. For example, whereas IFNG has the strongest association with C-reactive protein and other immune markers of poor prognosis, IFNB1 associates with increased neutrophil to lymphocyte ratio, a marker of late severe disease. Altogether, these results reveal specialized IFN action in COVID-19, with potential diagnostic and therapeutic implications.

Keywords: COVID-19; CyTOF; SARS-CoV-2; cytokine; interferon.


Conflict of interest statement

Competing interest statement: J.M.E. serves on the COVID Development Advisory Board for Eli Lilly.

Figures

Fig. 1.
Fig. 1.
IFN signaling at the whole-blood transcriptome level correlates with a subset of IFNs. (A) Volcano plot for differential mRNA expression analysis by COVID-19 status, adjusted for age and sex. Horizontal dashed line indicates a false-discovery rate (FDR) 10% for negative binomial Wald test; numbers above plot indicate significant genes. ISGs are highlighted in green. (B) Bar plot of top 10 Hallmark gene sets as ranked by absolute normalized enrichment score (NES) from GSEA. Bar color represents NES; bar length represents -log10(q-value). (C) RNA-based IFN-α scores by COVID-19 status. Data are presented as a modified sina plot with box indicating median and interquartile range; number above bracket is the q-value for Mann–Whitney U test. (D) Ranked heatmap representing correlations between RNA-based IFN-α scores and plasma levels of IFNs. Values are Spearman correlation coefficients (rho); asterisks indicate significant correlations (10% FDR). (E) Sina plots comparing abundance for the indicated IFNs by COVID-19 status. Data are presented as modified sina plots with boxes indicating median and interquartile range. Numbers above brackets are q-values for Mann–Whitney U tests. (F) Scatter plots showing the relationship between RNA-based IFN-α score and plasma abundance of IFNs in COVID-19 patients. Points are colored by density; blue lines represent linear model fit with 95% confidence intervals in gray. (G) Scatter plots showing the relationship between ISG mRNA levels and plasma abundance of IFNs in COVID-19 patients. (H) Heatmap representing enrichment of Hallmark gene sets among Spearman correlations between mRNA levels and plasma levels of IFNs. Values displayed are NES from GSEA; asterisks indicate significant enrichment (10% FDR); columns and rows are grouped by hierarchical clustering. See also SI Appendix, Figs. S1 and S2. n.s., not significant.
Fig. 2.
Fig. 2.
IFN signaling at the proteome level correlates with features of COVID-19 pathophysiology. (A) Volcano plot for linear regression analysis of SOMAscan proteomics data by COVID-19 status, adjusted for age and sex. Horizontal dashed line indicates an FDR threshold of 10% (q < 0.1); numbers above plot indicate significant proteins. Proteins encoded by ISGs are highlighted in green. (B) Bar plot of top 10 Hallmark gene sets as ranked by absolute NES from GSEA. Bar color represents NES; bar length represents -log10(q-value). (C) Protein-based IFN-α scores by COVID-19 status. Data are presented as a modified sina plot with box indicating median and interquartile range. (D) Ranked heatmap representing correlations between protein-based IFN-α scores and plasma levels of each IFN. Values displayed are Spearman correlation coefficients (rho); asterisks indicate significant correlations (10% FDR). (E) Heatmap representing enrichment of Hallmark gene sets among Spearman correlations between plasma levels of proteins measured by SOMAscan versus IFNs. Values displayed are NES from GSEA; asterisks indicate significant enrichment (10% FDR); columns and rows are grouped by hierarchical clustering. (FI) Scatter plots comparing relationships between plasma proteins and IFNs in COVID-19 patients. Points are colored by density; blue lines represent linear model fit with 95% confidence intervals in gray. See also SI Appendix, Figs. S3 and S4. n.s., not significant.
Fig. 3.
Fig. 3.
The cellular action of IFNA2 and IFNB1 does not explain their differential biosignatures in COVID-19. (A) Scatter plot comparing fold-changes for IFNA2- and IFNB1-stimulated genes in PBMCs treated ex vivo. (B) Heatmap representing differential expression of selected genes from each class in A. Values displayed are fold-changes for stimulation with IFNA2/baseline and IFNB1/baseline; asterisks indicate significant differences over baseline (10% FDR); rows are grouped by hierarchical clustering. (C and D) Pie charts displaying the relative fraction of mRNAs (C) or proteins (D) up-regulated in COVID-19 patients in each class from A. Absolute numbers are indicated in legend. (E) Spearman correlation score (rho) distributions for core mRNAs against plasma levels of IFNA2 and IFNB1. Data are presented as a modified sina plot with boxes indicating median and interquartile range with number above bracket indicating the q-value for Mann–Whitney U test (Left) and scatter plots with points colored by density (Right). (F) Spearman correlation score (rho) distributions for core proteins detected by SOMAscan against plasma levels of IFNA2 and IFNB1. Data are presented as a modified sina plot with boxes indicating median and interquartile range with number above bracket indicating the q-value for Mann–Whitney U test (Left) and scatter plot with points colored by density (Right). n.s., not significant.
Fig. 4.
Fig. 4.
Differential association of IFNs with seroconversion. (AF) Scatter plots comparing relationships between plasma proteins measured by MS proteomics and IFNs in COVID-19 patients. Points are colored by density; blue lines represent linear model fit with 95% confidence intervals in gray. (G) Heatmap representing correlations between IFNs and plasma levels of Igs measured by MS proteomics (Upper), or antibody reactivity against SARS-CoV-2 measured by immunoassays (Lower). Values displayed are Spearman correlation scores (rho); asterisks indicate significant correlations (10% FDR); columns and rows are grouped by hierarchical clustering. (H) Scatter plots comparing relationships between plasma antibody reactivity against SARS-CoV-2 S1 RBD region and IFNA2/B1 in COVID-19 patients. Points are colored by density; blue lines represent linear model fit with 95% confidence intervals in gray. See also SI Appendix, Figs. S5 and S6. n.s., not significant.
Fig. 5.
Fig. 5.
Differential association of IFNs with immune cell signatures. (A) t-SNE plots of 69,000 cells analyzed by mass cytometry from 69 COVID-19 patients (1,000 cells each). Leftmost panel is colored by major cell lineages; all other panels have cells within each PhenoGraph cluster (as shown in SI Appendix, Fig. S7A) colored by the fold-change in cluster proportion among live cells per SD of abundance for the indicated IFN, as determined by β-regression analysis, adjusting for age and sex; numbers indicate clusters with significant associations with IFN abundance (10% FDR). (B) Heatmap representing relationships between IFNs and gated subpopulation proportions among live cells, as determined by β-regression analysis. Values displayed are fold-change in cluster proportion among live cells per SD of IFN abundance; asterisks indicate significant associations (10% FDR); columns and rows are grouped by hierarchical clustering. (CF) Scatter plots comparing relationships between gated subpopulation proportions among live cells and IFNs in COVID-19 patients. Points are colored by density; blue lines represent β-regression model fit with 95% confidence intervals in gray. See also SI Appendix, Figs. S7 and S8. n.s., not significant.
Fig. 6.
Fig. 6.
Differential metabolic signatures associated with IFNs. (A) Heatmap representing correlations between IFNs and plasma metabolites. Values displayed are Spearman correlation scores (rho); asterisks indicate significant correlations (10% FDR); columns and rows are grouped by hierarchical clustering. (BE) Scatter plots comparing relationships between select metabolites and IFNs in COVID-19 patients. Points are colored by density; blue lines represent linear model fit with 95% confidence intervals in gray. See also SI Appendix, Figs. S9 and S10. n.s., not significant.
Fig. 7.
Fig. 7.
Differential association of IFNs with clinical variables and markers of prognosis in COVID-19. (A) Heatmaps summarizing linear regression analysis of plasma IFNs abundance against age (continuous), sex (males/females), ICU status (ever ICU/never ICU), O2 group (high/low), or days since admission (continuous, limited to ≤14 d) for COVID-19+ samples, adjusted for age and/or sex as appropriate; asterisks indicate significant associations (10% FDR). (B) Scatter plots comparing relationships between days since admission and IFNs in COVID-19 patients. Points are colored by density; blue lines represent linear model fit with 95% confidence intervals in gray. (C) Heatmap representing correlations between clinical laboratory measurements and plasma levels of each IFN. Values displayed are Spearman correlation coefficients (rho); asterisks indicate significant correlations (10% FDR). (D) Scatter plots comparing relationships between clinical laboratory measurements and the indicated IFNs in COVID-19 patients. (E) Heatmap representing correlations between selected immune factors associated with poor prognosis in COVID-19 measured in plasma by MSD assays and plasma levels of IFNs. Values displayed are Spearman correlation coefficients (rho); asterisks indicate significant correlations (10% FDR). (F) Scatter plots comparing relationships between immune factors and IFNs in COVID-19 patients.

References

    1. Secombes C. J., Zou J., Evolution of interferons and interferon receptors. Front. Immunol. 8, 209 (2017). - PMC - PubMed
    1. Hadjadj J., et al. , Impaired type I interferon activity and inflammatory responses in severe COVID-19 patients. Science 369, 718–724 (2020). - PMC - PubMed
    1. Galani I. E., et al. , Untuned antiviral immunity in COVID-19 revealed by temporal type I/III interferon patterns and flu comparison. Nat. Immunol. 22, 32–40 (2021). - PubMed
    1. Ziegler C. G. K., et al. , Impaired local intrinsic immunity to SARS-CoV-2 infection in severe COVID-19. Cell 184, 4713–4733.e22 (2021). - PMC - PubMed
    1. Bastard P., et al. ; HGID Lab; NIAID-USUHS Immune Response to COVID Group; COVID Clinicians; COVID-STORM Clinicians; Imagine COVID Group; French COVID Cohort Study Group; Milieu Intérieur Consortium; CoV-Contact Cohort; Amsterdam UMC Covid-19 Biobank; COVID Human Genetic Effort, Autoantibodies against type I IFNs in patients with life-threatening COVID-19. Science 370, eabd4585 (2020). - PMC - PubMed

Publication types