. 2022 Mar 1;119(9):e2107406119.
doi: 10.1073/pnas.2107406119.

BEND3 safeguards pluripotency by repressing differentiation-associated genes

Affiliations

BEND3 safeguards pluripotency by repressing differentiation-associated genes

Fredy Kurniawan et al. Proc Natl Acad Sci U S A. .

Abstract

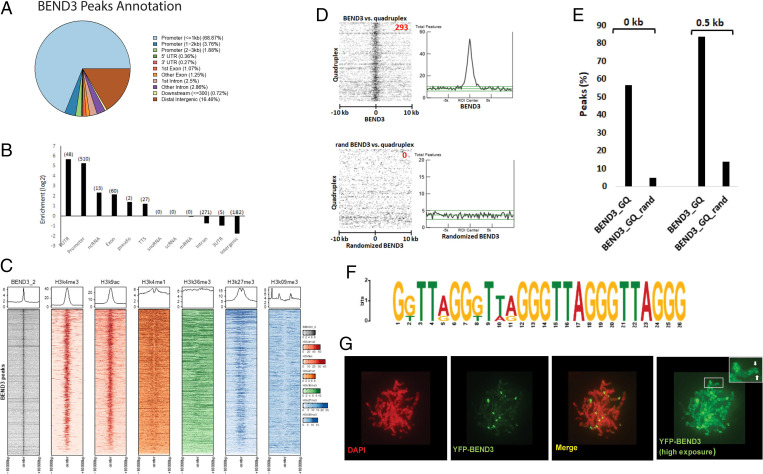
BEN domain-containing proteins are emerging rapidly as an important class of factors involved in modulating gene expression, yet the molecular basis of how they regulate chromatin function and transcription remains to be established. BEND3 is a quadruple BEN domain-containing protein that associates with heterochromatin and functions as a transcriptional repressor. We find that BEND3 is highly expressed in pluripotent cells, and the induction of differentiation results in the down-regulation of BEND3. The removal of BEND3 from pluripotent cells results in cells exhibiting upregulation of the differentiation-inducing gene expression signature. We find that BEND3 binds to the promoters of differentiation-associated factors and key cell cycle regulators, including CDKN1A, encoding the cell cycle inhibitor p21, and represses the expression of differentiation-associated genes by enhancing H3K27me3 decoration at these promoters. Our results support a model in which transcription repression mediated by BEND3 is essential for normal development and to prevent differentiation.

Keywords: BEND3; differentiation; p21; promoter; transcription repression.


Conflict of interest statement

The authors declare no competing interest.

Figures

Fig. 1.
Fig. 1.
Loss of BEND3 leads to differentiation state. (A) Western blot showing a reduction of BEND3 after RA-mediated differentiation of NTERA2. Note the reduction in Oct4 and NANOG, the pluripotency markers upon differentiation. β” U2snRNP staining was used as a loading control. The asterisk denotes a cross-reacting band. (B) RNA levels of Oct4 and NANOG upon differentiation. (C) Depletion of BEND3 with different shRNAs (sh60, 61, and 62). Immunoblot of BEND3, Oct4, and NANOG is shown. Tubulin Western blot is shown as a loading control. (D) RNA levels of BEND3, Oct4, and NANOG upon BEND3 KD. (E) Propidium iodide (PI) flow cytometry analysis of BEND3 shRNA-treated cells. *P < 0.05, **P < 0.01, ***P < 0.001, and ****P < 0.0001 by unpaired Student’s two-tailed t test.
Fig. 2.
Fig. 2.
Loss of BEND3 is correlated with changes in expression of genes involved in cellular differentiation. (A) Heatmap showing the expression of 4,495 DE genes from RNA-seq (sh60) with fold change > 1 and FDR < 0.05. (B) GO analysis of DE up-regulated and down-regulated genes between control and BEND3 knockdown cells. (C) Top 10 biological processes involved in cell differentiation associated with DE genes between control and BEND3 knockdown cells. (D and E) Gene set enrichment analysis (GSEA) and heatmap showing the expression of developmental genes present in 4,495 DE genes of the BEND3 RNA-seq data. When performing GSEA analysis, only significant pathways were selected and included in the figures. The P values, FDR values, and normalized enrichment score (NES) values can be found in Dataset S4. (F, a) Venn diagram showing overlap genes between 21 d post-RA NTERA2-treated cell (GSE125370) and BEND3 KD RNA-seq. (F, b) Detailed Venn diagram showing the gene expression directionality of the 3,200 overlap genes between 21 d post-RA NTERA2-treated cell (GSE125370) and BEND3 KD RNA-seq. (G) RNA levels of genes (that are up-regulated upon BEND3 KD) during differentiation. *P < 0.05 and **P < 0.01 by unpaired Student’s two-tailed t test.
Fig. 3.
Fig. 3.
BEND3 associates with GQ-rich sequences at promoters. (A) Percentage of BEND3 peaks at promoters and at nonpromoter regions. (B) Enrichment score of BEND3 peaks in multiple genome sites. Annotation enrichment analysis performed by the Homer tool compares the annotation distribution of the input peaks compared to a background set of peaks. The log2 ratios in the figures show the enrichment of different genomic locations between the input peak annotation and background peak set. Positive enrichment values mean that the input peak set was more enriched, while negative enrichment values mean that the background peak set was more enriched. (C) Heatmap showing the colocalization between BEND3 peaks, with different histone marks in NTERA2 cells. (D) Heatmap (Left) and graphs (Right) showing the colocalization between BEND3 peaks (Top) or randomized peaks (Bottom) with quadruplex regions in NTERA2 cells. The randomized genomic file was generated by a script to randomize genomic regions (41). (E) Graph depicting the percentage of colocalization between BEND3 peaks and quadruplex regions. A 0-kb gap and a 0.5-kb gap (details in Materials and Methods) were used for the analysis. (F) Consensus sequence for BEND3 binding identified using a subset of BEND3-bound regions. (G) Localization of YFP-BEND3 at rDNA and telomeres.
Fig. 4.
Fig. 4.
BEND3 associates with GQ within the promoter region to regulate gene expression. (A) Venn diagram showing overlap genes (orange) between BEND3 ChIP-seq (yellow) and BEND3 KD RNA-seq (FDR < 0.05, fold change > 1) (red). (B) Top 10 biological processes involved in cell differentiation of 275 overlap genes between BEND3 ChIP-seq and BEND3 KD RNA-seq (FDR < 0.05, fold change > 1). (C) qPCR validation of the expression of BEND3-bound differentiation-associated genes in BEND3 KD cells. (D) RNA level of BEND3 in cells overexpressing BEND3. (E) Validation of differentiation-associated genes by qPCR analysis in BEND3 overexpression (OE) experiment. (F) Luciferase reporter assay showing BEND3 repressive activity on CDKN1A, KDM5B, and GFPT1 promoter and relief of repression in the GQ promoter mutants. GQ mutations are marked with red color. (G) H3K27me3 ChIP-qPCR analysis at differentiation-associated gene promoter regions in cells overexpressing BEND3. *P < 0.05, **P < 0.01, ***P < 0.001, and ****P < 0.0001 by unpaired Student’s two-tailed t test.
Fig. 5.
Fig. 5.
Model representing the mechanism behind BEND3 transcriptional repressive activity at promoter regions. We show that BEND3 is required to fine-tune the expression of differentiation-associated genes by modulating the levels of H3K27me3 to BEND3-bound promoters to generate repressive chromatin.

References

    1. Abhiman S., Iyer L. M., Aravind L., BEN: A novel domain in chromatin factors and DNA viral proteins. Bioinformatics 24, 458–461 (2008). - PMC - PubMed
    1. Cai H. N., Levine M., The gypsy insulator can function as a promoter-specific silencer in the Drosophila embryo. EMBO J. 16, 1732–1741 (1997). - PMC - PubMed
    1. Duan H., et al. , Insensitive is a corepressor for Suppressor of Hairless and regulates Notch signalling during neural development. EMBO J. 30, 3120–3133 (2011). - PMC - PubMed
    1. Pavithra L., et al. , SMAR1 forms a ternary complex with p53-MDM2 and negatively regulates p53-mediated transcription. J. Mol. Biol. 388, 691–702 (2009). - PubMed
    1. Rampalli S., Pavithra L., Bhatt A., Kundu T. K., Chattopadhyay S., Tumor suppressor SMAR1 mediates cyclin D1 repression by recruitment of the SIN3/histone deacetylase 1 complex. Mol. Cell. Biol. 25, 8415–8429 (2005). - PMC - PubMed