

Chaperones Skp and SurA dynamically expand unfolded OmpX and synergistically disassemble oligomeric aggregates
- PMID: 35217619
- PMCID: PMC8892499
- DOI: 10.1073/pnas.2118919119
Chaperones Skp and SurA dynamically expand unfolded OmpX and synergistically disassemble oligomeric aggregates
Abstract
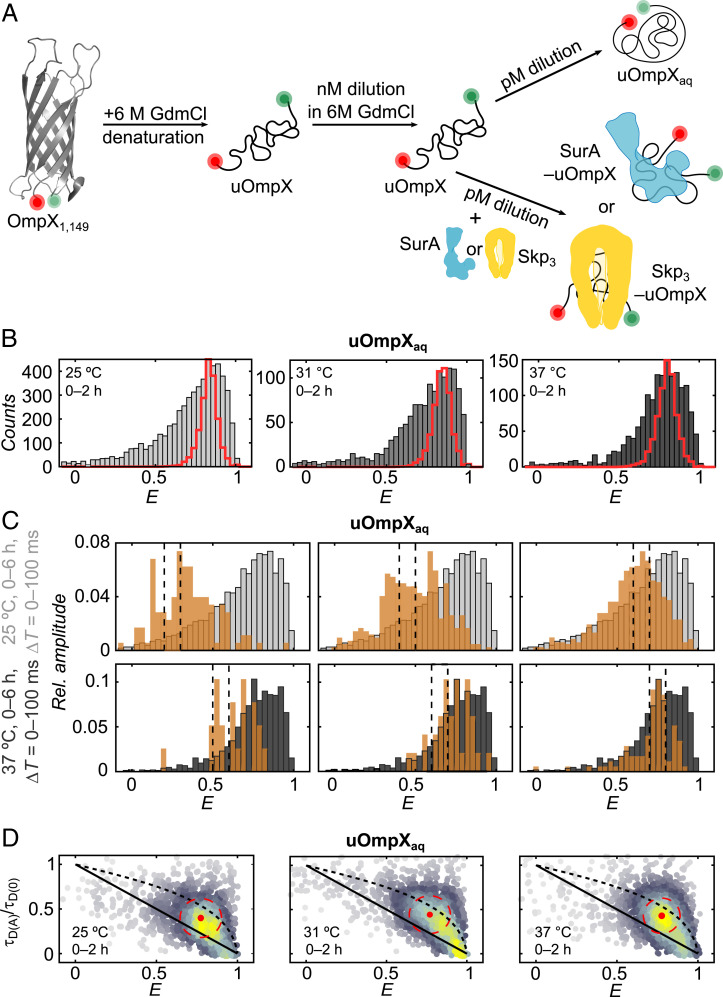
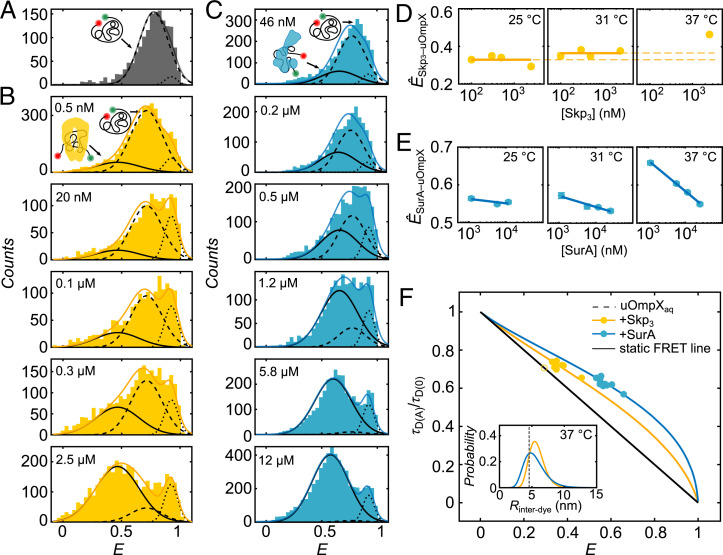
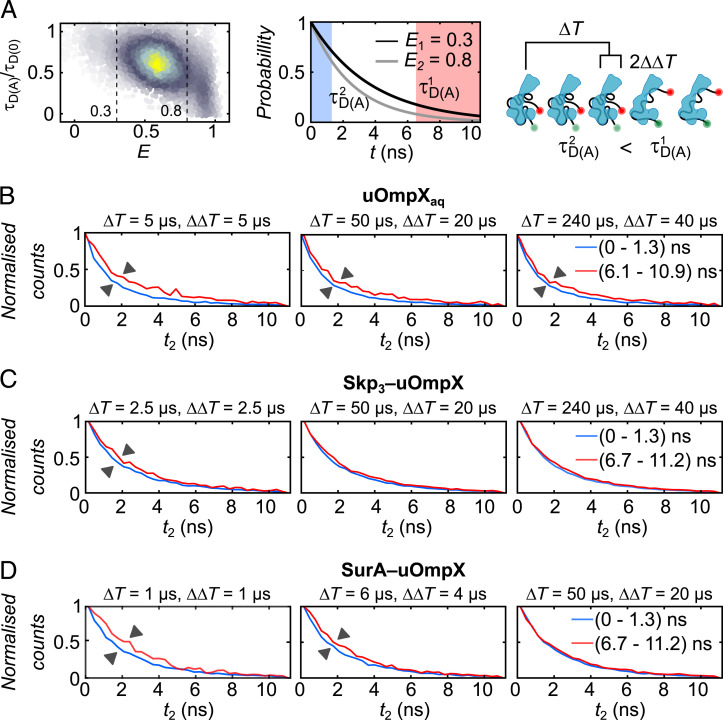
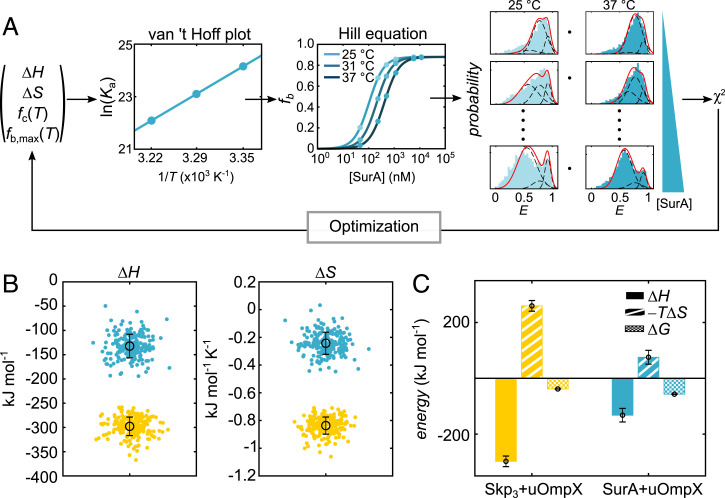
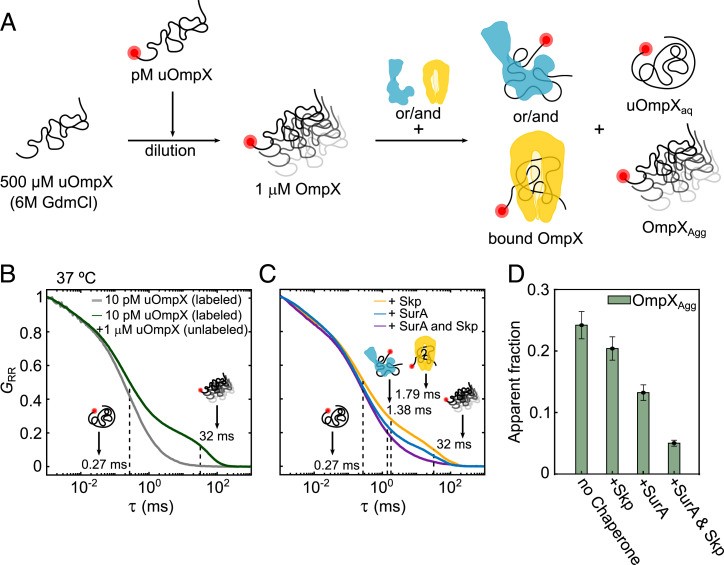
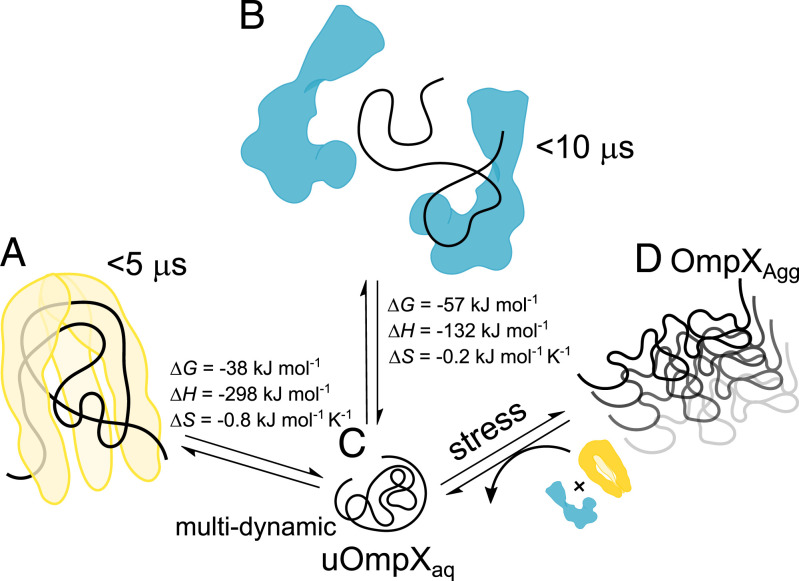
Periplasmic chaperones 17-kilodalton protein (Skp) and survival factor A (SurA) are essential players in outer membrane protein (OMP) biogenesis. They prevent unfolded OMPs from misfolding during their passage through the periplasmic space and aid in the disassembly of OMP aggregates under cellular stress conditions. However, functionally important links between interaction mechanisms, structural dynamics, and energetics that underpin both Skp and SurA associations with OMPs have remained largely unresolved. Here, using single-molecule fluorescence spectroscopy, we dissect the conformational dynamics and thermodynamics of Skp and SurA binding to unfolded OmpX and explore their disaggregase activities. We show that both chaperones expand unfolded OmpX distinctly and induce microsecond chain reconfigurations in the client OMP structure. We further reveal that Skp and SurA bind their substrate in a fine-tuned thermodynamic process via enthalpy-entropy compensation. Finally, we observed synergistic activity of both chaperones in the disaggregation of oligomeric OmpX aggregates. Our findings provide an intimate view into the multifaceted functionalities of Skp and SurA and the fine-tuned balance between conformational flexibility and underlying energetics in aiding chaperone action during OMP biogenesis.
Keywords: chaperones; disaggregation; outer membrane protein biogenesis; protein folding; single-molecule FRET.
Copyright © 2022 the Author(s). Published by PNAS.
Conflict of interest statement
The authors declare no competing interest.
Figures
Similar articles
-
Chaperone Spy Protects Outer Membrane Proteins from Folding Stress via Dynamic Complex Formation.mBio. 2021 Oct 26;12(5):e0213021. doi: 10.1128/mBio.02130-21. Epub 2021 Oct 5. mBio. 2021. PMID: 34607455 Free PMC article.
-
Conformation and dynamics of the periplasmic membrane-protein-chaperone complexes OmpX-Skp and tOmpA-Skp.Nat Struct Mol Biol. 2013 Nov;20(11):1265-72. doi: 10.1038/nsmb.2677. Epub 2013 Sep 29. Nat Struct Mol Biol. 2013. PMID: 24077225
-
Molecular mechanism of networking among DegP, Skp and SurA in periplasm for biogenesis of outer membrane proteins.Biochem J. 2020 Aug 28;477(16):2949-2965. doi: 10.1042/BCJ20200483. Biochem J. 2020. PMID: 32729902
-
The Periplasmic Chaperones Skp and SurA.Subcell Biochem. 2019;92:169-186. doi: 10.1007/978-3-030-18768-2_6. Subcell Biochem. 2019. PMID: 31214987 Review.
-
Conformational plasticity of molecular chaperones involved in periplasmic and outer membrane protein folding.FEMS Microbiol Lett. 2018 Jul 1;365(13). doi: 10.1093/femsle/fny121. FEMS Microbiol Lett. 2018. PMID: 29893830 Review.
Cited by
-
The periplasmic chaperone Skp prevents misfolding of the secretory lipase A from Pseudomonas aeruginosa.Front Mol Biosci. 2022 Oct 24;9:1026724. doi: 10.3389/fmolb.2022.1026724. eCollection 2022. Front Mol Biosci. 2022. PMID: 36353734 Free PMC article.
-
Pulsed-Interleaved-Excitation Two-Dimensional Fluorescence Lifetime Correlation Spectroscopy.J Phys Chem B. 2024 May 16;128(19):4685-4695. doi: 10.1021/acs.jpcb.4c01224. Epub 2024 May 1. J Phys Chem B. 2024. PMID: 38692581 Free PMC article.
-
Dynamic interplay between the periplasmic chaperone SurA and the BAM complex in outer membrane protein folding.Commun Biol. 2022 Jun 8;5(1):560. doi: 10.1038/s42003-022-03502-w. Commun Biol. 2022. PMID: 35676411 Free PMC article.
-
Leptospira interrogans encodes a canonical BamA and three novel noNterm Omp85 outer membrane protein paralogs.Sci Rep. 2024 Aug 28;14(1):19958. doi: 10.1038/s41598-024-67772-6. Sci Rep. 2024. PMID: 39198480 Free PMC article.
-
SurA-like and Skp-like Proteins as Important Virulence Determinants of the Gram Negative Bacterial Pathogens.Int J Mol Sci. 2022 Dec 24;24(1):295. doi: 10.3390/ijms24010295. Int J Mol Sci. 2022. PMID: 36613738 Free PMC article. Review.
References
-
- Hartl F. U., Hayer-Hartl M., Molecular chaperones in the cytosol: From nascent chain to folded protein. Science 295, 1852–1858 (2002). - PubMed
-
- Kim Y. E., Hipp M. S., Bracher A., Hayer-Hartl M., Hartl F. U., Molecular chaperone functions in protein folding and proteostasis. Annu. Rev. Biochem. 82, 323–355 (2013). - PubMed
-
- Mogk A., Ruger-Herreros C., Bukau B., Cellular functions and mechanisms of action of small heat shock proteins. Annu. Rev. Microbiol. 73, 89–110 (2019). - PubMed
MeSH terms
Substances
LinkOut - more resources
Full Text Sources
Molecular Biology Databases
