. 2022 Mar 1;119(9):e2120555119.
doi: 10.1073/pnas.2120555119.

Conservation of chromatin conformation in carnivores

Affiliations

Conservation of chromatin conformation in carnivores

Marco Corbo et al. Proc Natl Acad Sci U S A. .

Abstract

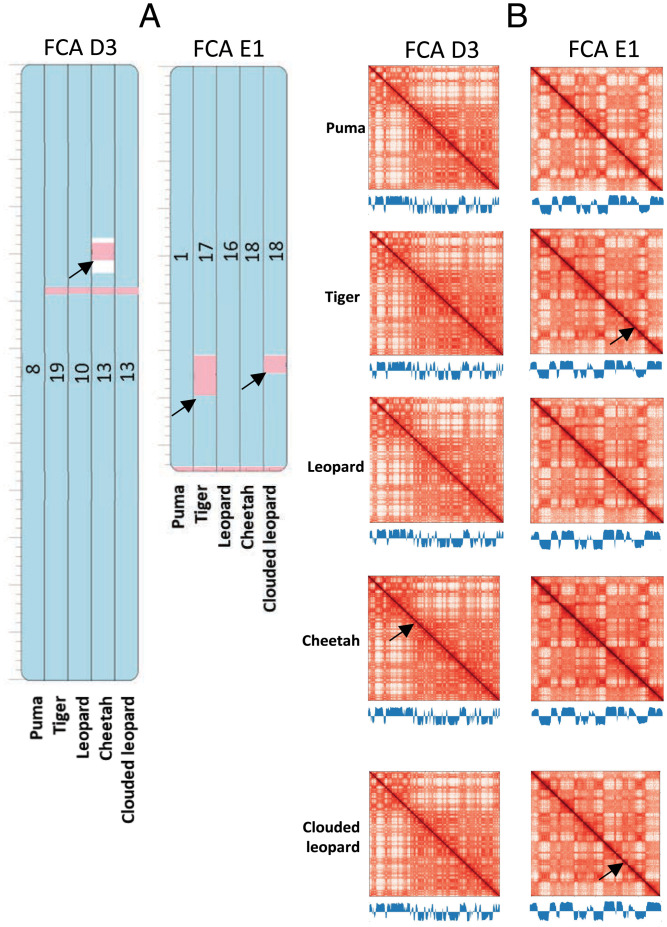
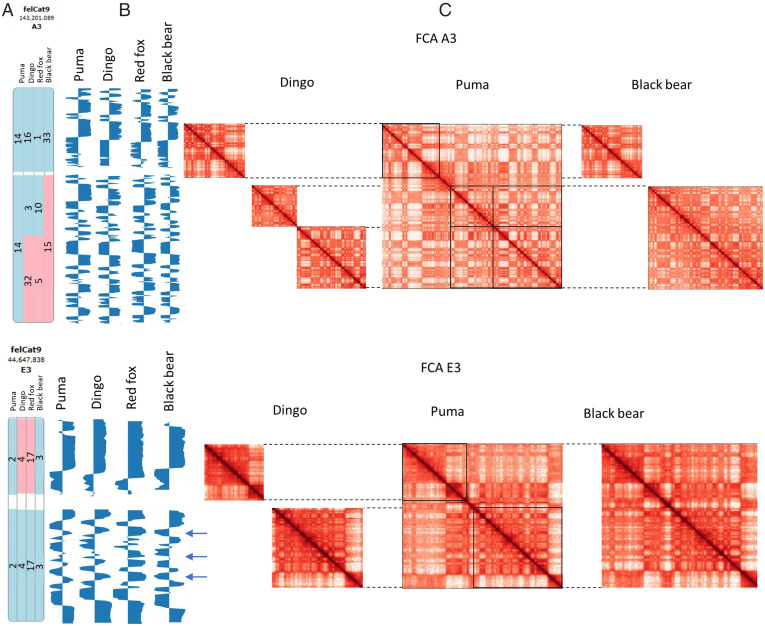
High throughput chromatin conformation capture (Hi-C) of leukocyte DNA was used to investigate the evolutionary stability of chromatin conformation at the chromosomal level in 11 species from three carnivore families: Felidae, Canidae, and Ursidae. Chromosome-scale scaffolds (C-scaffolds) of each species were initially used for whole-genome alignment to a reference genome within each family. This approach established putative orthologous relationships between C-scaffolds among the different species. Hi-C contact maps for all C-scaffolds were then visually compared and found to be distinct for a given reference chromosome or C-scaffold within a species and indistinguishable for orthologous C-scaffolds having a 1:1 relationship within a family. The visual patterns within families were strongly supported by eigenvectors from the Hi-C contact maps. Analysis of Hi-C contact maps and eigenvectors across the three carnivore families revealed that most cross-family orthologous subchromosomal fragments have a conserved three-dimensional (3D) chromatin structure and thus have been under strong evolutionary constraint for ∼54 My of carnivore evolution. The most pronounced differences in chromatin conformation were observed for the X chromosome and the red fox genome, whose chromosomes have undergone extensive rearrangements relative to other canids. We also demonstrate that Hi-C contact map pattern analysis can be used to accurately identify orthologous relationships between C-scaffolds and chromosomes, a method we termed "3D comparative scaffotyping." This method provides a powerful means for estimating karyotypes in de novo sequenced species that have unknown karyotype and no physical mapping information.

Keywords: carnivores; chromatin conformation; chromosome evolution; mammals.


Conflict of interest statement

The authors declare no competing interest.

Figures

Fig. 1.
Fig. 1.
Comparative analysis of chromatin conformation in felids. Puma, tiger, leopard, cheetah, and clouded leopard C-scaffolds orthologous to cat chromosome D3 (FCA D3) and E1 (FCA E1) are shown as examples. (A) Homologous synteny blocks of the five felids visualized in Evolution Highway at 300-kb resolution. Blue indicates same sequence orientation as the reference genome. Pink depicts chromosome inversions (arrows indicate inversions bigger than 1 Mb). Numbers represent the scaffold identifier of the target species. (B) Juicer plots of orthologous C-scaffolds for the five felids as numbered in part A. Color intensity reflects the frequency of interactions between pairs of loci on C-scaffolds (range 1 to 1,000 for each map). Blue histograms depict eigenvector values for each species matrix at 500-kb resolution. Similar comparisons for all other cat chromosomes are shown in SI Appendix, Fig. S2. Alignment coordinates can be found in Dataset S3.
Fig. 2.
Fig. 2.
Comparative analysis of chromatin conformation in canids. Dog chromosomes, and dingo and African wild dog C-scaffolds orthologous to red fox C-scaffold 16 are shown as examples. (A) Homologous synteny blocks of the three canids visualized in Evolution Highway at 300-kb resolution. Blue indicates same sequence orientation as the reference genome. Pink depicts chromosome inversions. Numbers represent the scaffold identifier of the target species. (B) Eigenvector values of each species aligned to the red fox reference genome at 500-kb resolution. Arrows point to compartment variation. (C) Juicer plots of C-scaffolds for dingo, African wild dog, and red fox. Color intensity reflects the frequency of interactions between pairs of loci on C-scaffolds (range 1 to 1,000 for each map). Similar comparisons for all other canids C-scaffolds are shown in SI Appendix, Fig. S3. Alignment coordinates can be found in Dataset S5.
Fig. 3.
Fig. 3.
Comparative 3D chromatin conformation analysis across carnivore families. (A) Alignments of representative species of felids, ursids, and canids (p uma, dingo, red fox, and black bear) C-scaffolds to cat chromosomes A3 (Upper) and E3 (Lower). Blue indicates the homologous synteny blocks in the same sequence orientation. Pink depicts chromosome inversions. Numbers indicate C-scaffold identifiers. (B) Eigenvector values of each species aligned to the cat reference genome at 500-kb resolution. Arrows point to compartment variation. Eigenvectors within inverted regions were reoriented to be consistent with the reference genome. (C) Comparative analysis of Hi-C maps of orthologous C-scaffolds and C-scaffold fragments. Boxed areas on the puma Hi-C map demarcate the boundaries of orthology corresponding to dingo and black bear Hi-C maps, as shown in part A. Corresponding numbers of C-scaffolds can be found in the Evolution Highway images (part A) and in Table 1. Color intensity reflects the frequency of interactions in the C-scaffolds (range 1 to 1,000 for each map). The inverted region in the dingo Hi-C map was reoriented for comparison. Alignment coordinates can be found in Dataset S3.

Similar articles

Cited by

References

    1. Cremer T., Cremer C., Chromosome territories, nuclear architecture and gene regulation in mammalian cells. Nat. Rev. Genet. 2, 292–301 (2001). - PubMed
    1. Rao S. S., et al. , A 3D map of the human genome at kilobase resolution reveals principles of chromatin looping. Cell 159, 1665–1680 (2014). - PMC - PubMed
    1. Lieberman-Aiden E., et al. , Comprehensive mapping of long-range interactions reveals folding principles of the human genome. Science 326, 289–293 (2009). - PMC - PubMed
    1. Fullwood M. J., Ruan Y., ChIP-based methods for the identification of long-range chromatin interactions. J. Cell. Biochem. 107, 30–39 (2009). - PMC - PubMed
    1. Dixon J. R., et al. , Topological domains in mammalian genomes identified by analysis of chromatin interactions. Nature 485, 376–380 (2012). - PMC - PubMed