. 2022 Feb 25;10(1):22.
doi: 10.1038/s41413-022-00188-y.

Spinal cord injury reprograms muscle fibroadipogenic progenitors to form heterotopic bones within muscles

Affiliations

Spinal cord injury reprograms muscle fibroadipogenic progenitors to form heterotopic bones within muscles

Hsu-Wen Tseng et al. Bone Res. .

Abstract

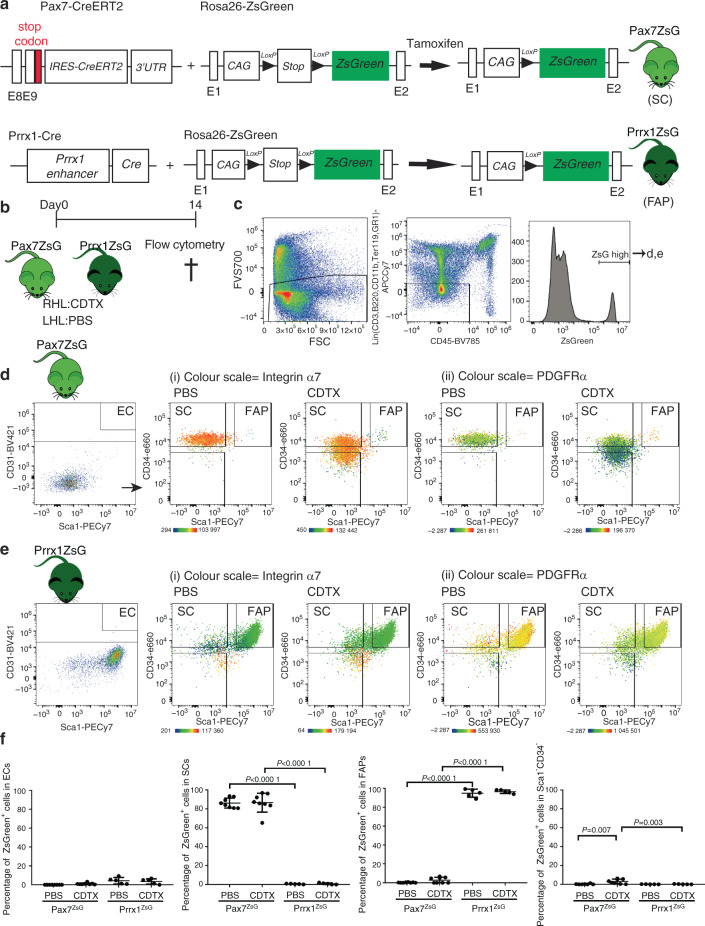
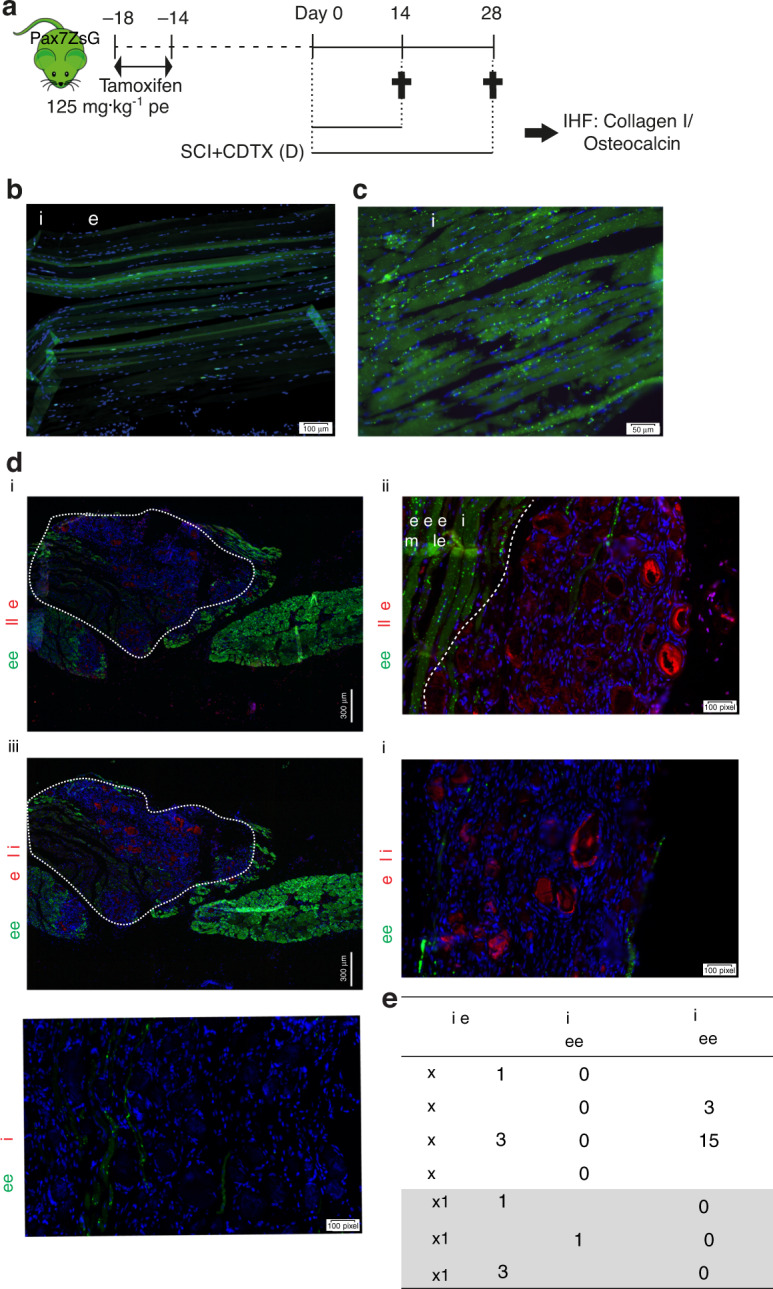
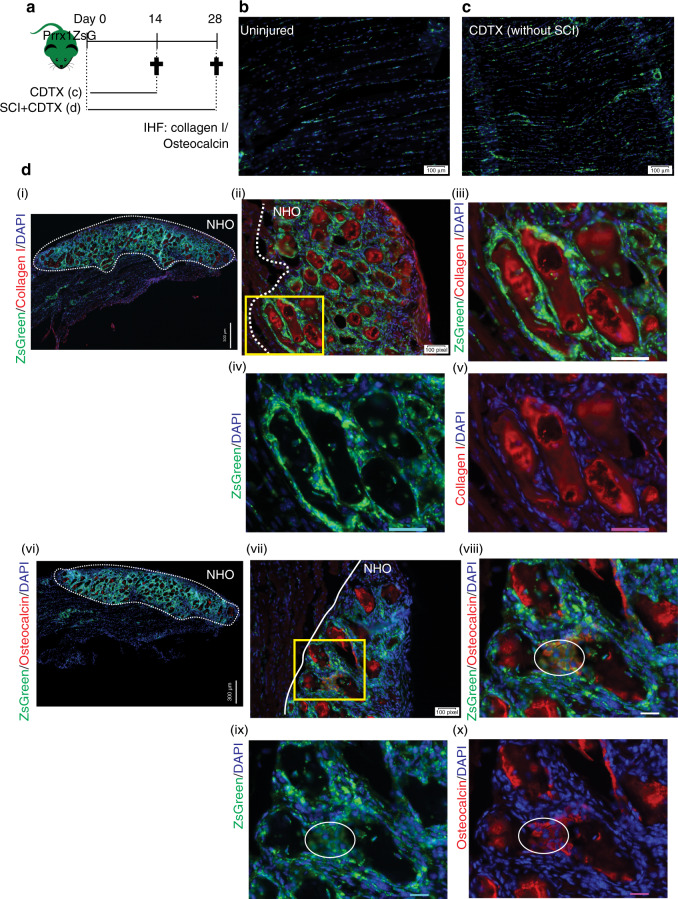
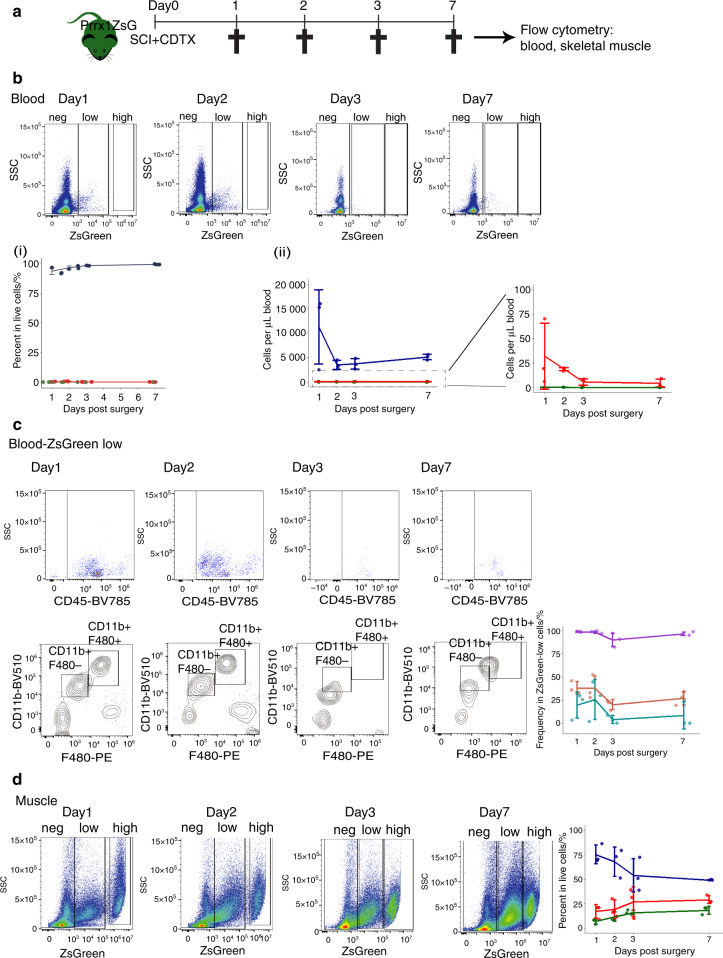
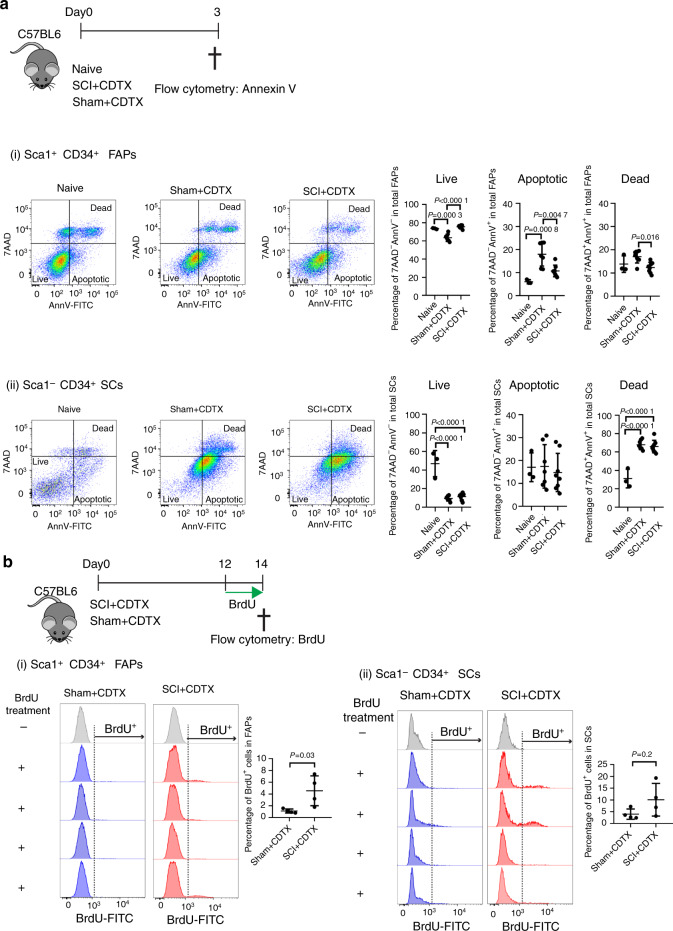
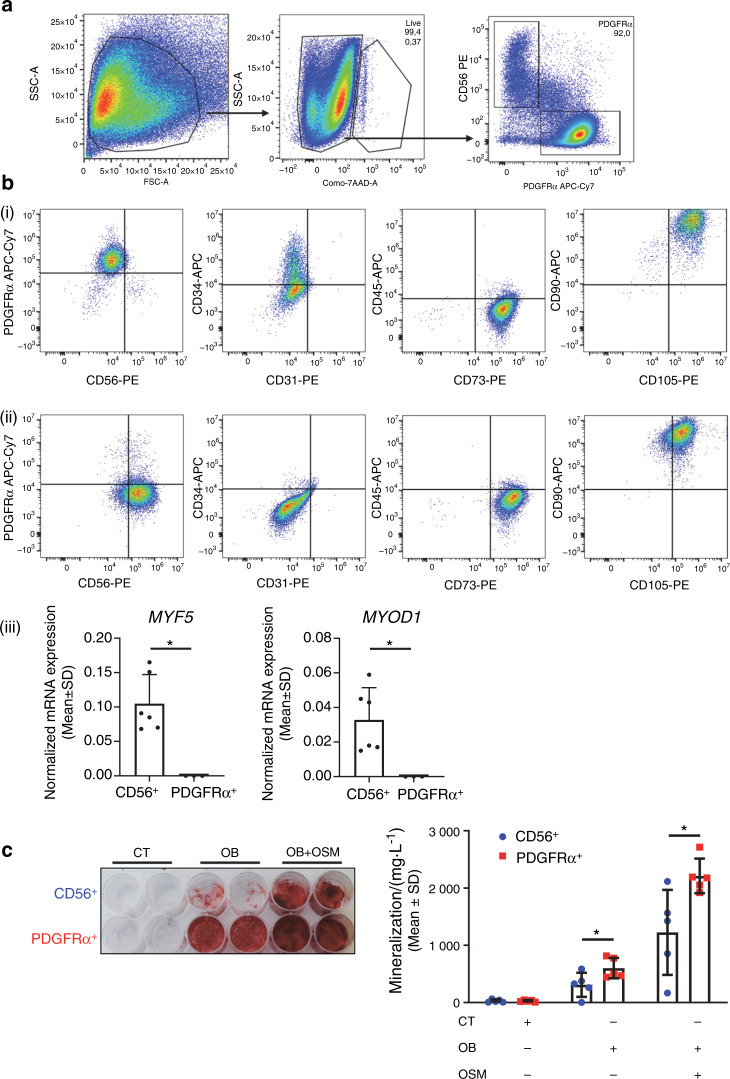
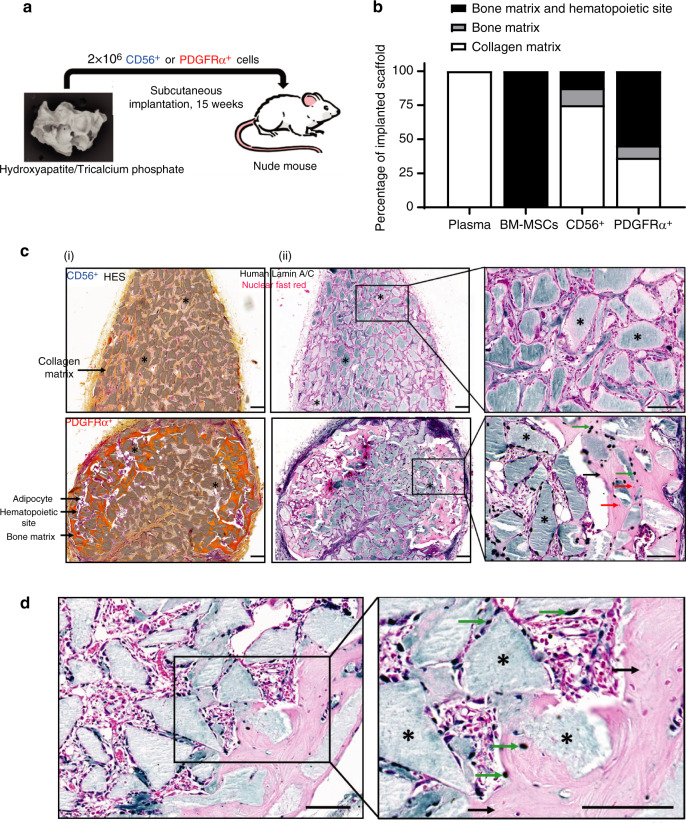
The cells of origin of neurogenic heterotopic ossifications (NHOs), which develop frequently in the periarticular muscles following spinal cord injuries (SCIs) and traumatic brain injuries, remain unclear because skeletal muscle harbors two progenitor cell populations: satellite cells (SCs), which are myogenic, and fibroadipogenic progenitors (FAPs), which are mesenchymal. Lineage-tracing experiments using the Cre recombinase/LoxP system were performed in two mouse strains with the fluorescent protein ZsGreen specifically expressed in either SCs or FAPs in skeletal muscles under the control of the Pax7 or Prrx1 gene promoter, respectively. These experiments demonstrate that following muscle injury, SCI causes the upregulation of PDGFRα expression on FAPs but not SCs and the failure of SCs to regenerate myofibers in the injured muscle, with reduced apoptosis and continued proliferation of muscle resident FAPs enabling their osteogenic differentiation into NHOs. No cells expressing ZsGreen under the Prrx1 promoter were detected in the blood after injury, suggesting that the cells of origin of NHOs are locally derived from the injured muscle. We validated these findings using human NHO biopsies. PDGFRα+ mesenchymal cells isolated from the muscle surrounding NHO biopsies could develop ectopic human bones when transplanted into immunocompromised mice, whereas CD56+ myogenic cells had a much lower potential. Therefore, NHO is a pathology of the injured muscle in which SCI reprograms FAPs to undergo uncontrolled proliferation and differentiation into osteoblasts.


Conflict of interest statement

The authors declare no competing interests.

Figures

Fig. 1
Fig. 1
ZsGreen labels SCs and FAPs in skeletal muscles of the Pax7ZsG and Prrx1ZsG mice, respectively. a Schematic representation of tamoxifen-inducible Cre-dependent ZsGreen reporter induction. b Pax7ZsG (n = 4/group) and Prrx1ZsG (n = 3/group) mice were injected with CDTX in the hamstring muscle of the right hind limb (RHL) and PBS in the hamstring muscle of the left hind limb (LHL). Muscle cells were isolated 14 days after injection and subsequently stained for surface cell markers. c After gating on forward/side scatters and FVS700 dead cell exclusion, ZsGreen-high cells were gated from Lin CD45 nonhematopoietic population in both (d) Pax7ZsG and (e) Prrx1ZsG mice and further subgrouped into CD31+Sca1+(EC), CD31Sca1CD34+(SCs), CD31Sca1+CD34+ (FAPs), and Sca1CD34 populations. The color indicates the expression level of (i) integrin α7 and (ii) PDGFRα. Yellow-orange: high expression. Green: low expression. f Frequencies of ZsGreen+ cells in Sca1+CD31+ ECs, CD31 Sca1 CD34+ ITGA7+ PDGFRα SCs and CD31 Sca1+ CD34+ ITGA7 PDGFRα+ FAP populations from muscles of the Pax7ZsG and Prrx1ZsG mice following the gating strategy in Fig. S1. Each dot represents a separate mouse, and bars are the mean ± SD. The results of 8 mice per group were from 3 independent experiments performed over a period of 2 years with different flow cytometers. Significance was analyzed by one-way ANOVA with Tukey’s multiple comparison test
Fig. 2
Fig. 2
NHOs are not derived from Pax7 expressing SCs. a ZsGreen expression in Pax7ZsG mice was induced by tamoxifen treatment for 4 days. Two weeks after tamoxifen treatment, the mice received an intramuscular injection of CDTX with or without SCI. Muscle samples were harvested 14 or 28 days post-injury. Representative IHF images illustrating the distribution of ZsGreen+ SC-derived cells in (b) uninjured muscle and (c) regenerated injured muscle 14 days post-CDTX injection in the Pax7ZsG mice without SCI (n = 3 mice/group). Scales bars: (b) 100 μm, (c) 50 μm. d Representative images from the Pax7ZsG mice with SCI and CDTX-mediated muscle injury 28 days post-surgery. i IHF staining illustrating that ZsGreen+ cells are present among areas of regenerating muscle and largely absent from areas of NHO development. White dashed lines indicate the boundary between regenerating muscle and fibrotic area containing NHOs stained red (i–ii) for collagen I and (iii-iv) osteocalcin. Nuclei were stained by DAPI staining (blue). A negative control was performed using rabbit isotype IgG (iv). Scale bars: (d) (i, iii) 300 μm, (ii, iv, v) 50 μm. e Number of osteocalcin+ NHOs intercalated with ZsGreen+ cells or without ZsGreen+ cells in both Pax7ZsG (n = 4 mice, total 44 osteocalcin+ NHOs counted) and Prrx1ZsG mice (n = 3 mice, total 30 osteocalcin+ NHO counted). Statistical differences were determined using Fisher’s exact test (P < 10−4)
Fig. 3
Fig. 3
NHOs are derived from Prrx1 expressing FAPs. a Prrx1ZsG mice received an intramuscular injection of CDTX with or without SCI, and muscle samples were harvested at the indicated time points and processed for IHF. Representative images illustrating the distribution of ZsGreen+ FAP-derived cells in (b) uninjured muscle and c regenerated injured muscle 14 days post-CDTX injection in the Prrx1ZsG mice without SCI (n = 3 mice/group). d Representative images from the Prrx1ZsG mice with SCI and CDTX-mediated muscle injury 28 days post-surgery: IHF illustrating the colocalization of ZsGreen+ FAP-derived cells with (iv) collagen I+ matrix (red) or (vi-x) osteocalcin+ osteoblasts (red). (iii-v) are enlarged images of the yellow box in (ii), whereas (viii-x) are enlarged images of the yellow box in (vii). The white dashed line indicates the boundary between regenerating muscle and the fibrotic area containing NHOs. Nuclei stained in DAPI (blue). White circles indicate osteocalcin+ osteoblasts that also express ZsGreen. Scale bars: (b, c) 100 μm; (d) (i) 300 μm (ii, vii) 100 μm (iii-v, viii-x) 50 μm
Fig. 4
Fig. 4
Absence of ZsGreenhigh mesenchymal cells in the circulation of the Prrx1ZsG mice after SCI and muscle injury. a Prrx1ZsG mice received SCI and an intramuscular injection of CDTX. Peripheral blood and skeletal muscles were collected at 1, 2, 3, and 7 days post-surgery and analyzed by flow cytometry (n = 3 mice/group). b FVS700 live cells from peripheral blood were gated based on the intensity of ZsGreen fluorescence into ZsGreen negative (blue lines), low (red lines) and high groups (green lines). The frequency of these three populations is represented as (i) the frequency of live cells in blood and (ii) the number of cells per μl blood. c The ZsGreen-low cells were further gated for expression of CD45, CD11b and F480. The frequency of CD45+ leukocytes (purple line), CD45+ CD11b+ F4/80+ monocytes (red line) and CD45+ CD11b+ F4/80 granulocytes (blue line) among circulating ZsGlow cells was plotted. d Live cells from injured muscle from the same Prrx1ZsG mice were used as a reference for ZsGreen fluorescence intensity, confirming the presence of numerous ZsGreenhigh cells in muscle. ZsGreen negative (blue lines), low (red lines) and high (green lines). Each dot represents a separate mouse. Bars represent the mean ± SD. There was no significant difference between the time points as determined by one-way ANOVA with Tukey’s multiple comparison test
Fig. 5
Fig. 5
SCI leads to decreased apoptosis and persistent proliferation of FAPs in injured muscles. a Naïve C57BL/6 mice underwent SCI or sham surgery plus intramuscular injection of CDTX. Muscle cells were isolated 3 days later. Apoptotic cells were subsequently analyzed by Annexin V (AnnV) and 7-amino-actinomycin D (7AAD) staining by flow cytometry. (i) CD45 Lin CD31Sca1+ CD34+ ITGA7 FAPs and (ii) CD45 Lin CD31Sca1 CD34+ ITGA7+ SCs were gated. AnnV and 7AAD staining further distinguished cells as live (7AADAnnV), apoptotic (7AADAnnV+) and postapoptotic dead (7AAD+AnnV+) in both FAP and SC populations. The percentages of live, apoptotic and dead cells in the total FAP or SC populations are presented as the mean ± SD (n = 3, 7, and 8 in naïve, sham+CDTX, and SCI + CDTX, respectively). Each dot represents a separate mouse. Significance was calculated by one-way ANOVA with Tukey’s multiple comparison test. b C57BL/6 mice underwent SCI or sham surgery plus intramuscular injection of CDTX. Mice were given drinking water containing BrdU together with BrdU i.p. injection (twice daily) from day 12 to 14. One SCI + CDTX and 1 sham+CDTX mouse were not treated with BrdU and used as a negative control for anti-BrdU staining. On day 14, muscle cells were isolated, and BrdU staining was analyzed in CD45 Lin CD31Sca1+ CD34+ ITGA7 FAPs and CD45 Lin CD31Sca1 CD34+ ITGA7+ SCs by flow cytometry. The percentage of BrdU+ cells in the total FAP or SC population is presented as the mean ± SD. Each dot represents a separate mouse. Significance was calculated by a two-sided Mann–Whitney test
Fig. 6
Fig. 6
Human PDGFRα+ cells isolated from muscles surrounding NHOs support in vitro bone formation. a Flow cytometry gating strategy of PDGFRα+ and CD56+ cell subpopulations isolated from muscle surrounding NHOs. b Representative surface marker characterization by flow cytometry: CD56, PDGFRα, CD31, CD34, CD45, CD73, CD90, and CD105, (i) CD56+ population, (ii) PDGFRα+ population, (iii) Normalized mRNA expression of MYF5 and MYOD1 by qRT-PCR expressed as the mean ± SD (CD56+ n = 6; PDGFRα+ n = 3). c In vitro osteoblastic differentiation assay seeded with CD56+ or PDGFRα+ cells isolated from muscles surrounding human NHOs. (i) All cells were cultured in control medium (CT) or osteogenic medium alone (OB) or were supplemented with human OSM (100 ng·mL−1) (OB + OSM) for 14 days followed by Alizarin Red S staining. c(ii) Quantification of calcium mineralization expressed as the mean ± SD (n = 5). *P < 0.05, two-sided nonparametric Mann–Whitney U test
Fig. 7
Fig. 7
Human PDGFRα+ cells isolated from muscles surrounding NHO support in vivo bone formation. a Schematic representation of the in vivo osteogenic assay. Hydroxyapatite/calcium phosphate plasma scaffolds were seeded either with 2 × 106 CD56+ cells, 2 × 106 PDGFRα+ cells sorted from muscles surrounding NHOs, 2 × 106 human BM-MSCs or without cells (“plasma” negative control) and subcutaneously implanted in the backs of nude mice for 15 weeks. b Percentage of scaffolds containing either collagen matrix alone, bone matrix alone, or bone matrix associated with hematopoietic colonization. Human plasma (n = 4 donors), BM-MSCs (n = 6 donors), CD56+ cells (n = 8; 4 donors, 2 implants/donor) and PDGFRα+ cells (n = 11; 6 donors, 2 implants/donor for 5 donors and 1 implant for one donor). c(i) Representative images of hematoxylin-eosin-safranin (HES) staining of CD56+ and PDGFRα+ cell-seeded implant sections. Nuclei are stained purple, cell cytoplasm is stained pink, and collagen fibers are stained orange. *ː hydroxyapatite. Magnification 10X; scale bar = 100 µm. c(ii) Specific human Lamin A/C staining of representative CD56+ and PDGFRα+ cell-seeded implant sections. *: hydroxyapatite scaffold; black arrows: bone matrix; green arrow: human osteocytes; red arrows: mouse osteocytes. Magnification ×10 and ×20; scale bar = 100 µm. d Osterix/SP7 staining of a representative PDGFRα+ cell-seeded implant section. *: hydroxyapatite scaffold; black arrows: bone matrix; green arrows: osterix+ osteoblasts. Magnification ×20 and ×40; scale bar = 100 µm

Similar articles

Cited by

References

    1. Ohlmeier M, et al. Muscle localization of heterotopic ossification following spinal cord injury. Spine J. 2017;17:1519–1522. doi: 10.1016/j.spinee.2017.04.021. - DOI - PubMed
    1. Genet F, et al. Troublesome heterotopic ossification after central nervous system damage: a survey of 570 surgeries. PLoS One. 2011;6:e16632. doi: 10.1371/journal.pone.0016632. - DOI - PMC - PubMed
    1. Wittenberg, R. H., Peschke, U. & Botel, U. Heterotopic ossification after spinal cord injury. Epidemiology and risk factors. J. Bone Joint Surg. Br.74, 215–218 (1992). - PubMed
    1. Reznik JE, et al. Prevalence and risk-factors of neurogenic heterotopic ossification in traumatic spinal cord and traumatic brain injured patients admitted to specialised units in Australia. J. Musculoskelet. Neuronal Interact. 2014;14:19–28. - PubMed
    1. van Kuijk, A. A., Geurts, A. C. & van Kuppevelt, H. J. Neurogenic heterotopic ossification in spinal cord injury. Spinal Cord.40, 313–326 (2002). - PubMed