. 2022 Feb 25;13(1):970.
doi: 10.1038/s41467-022-28196-w.

Structure and assembly of the S-layer in C. difficile

Affiliations

Structure and assembly of the S-layer in C. difficile

Paola Lanzoni-Mangutchi et al. Nat Commun. .

Abstract

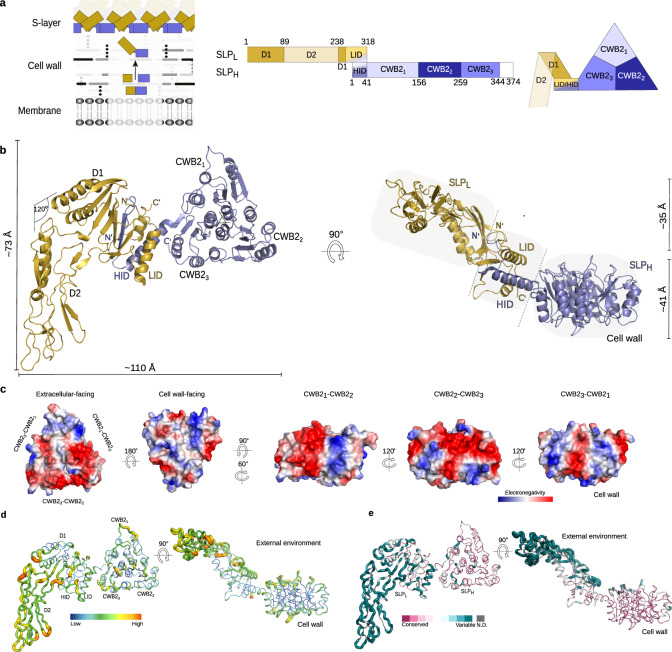
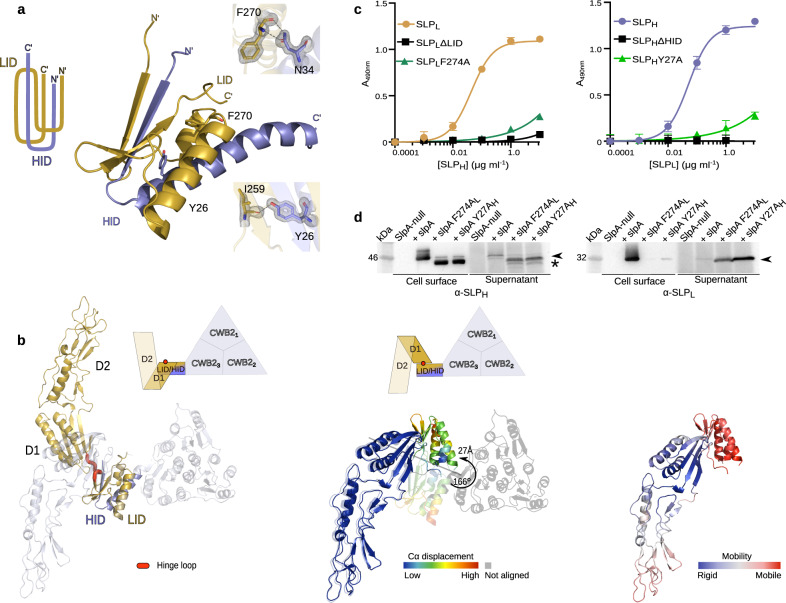
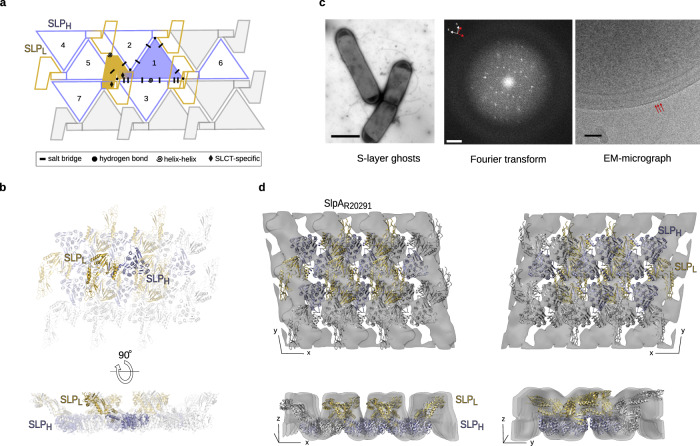
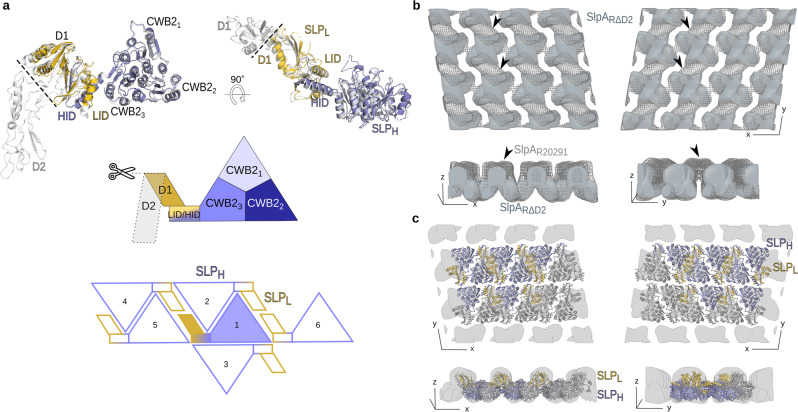
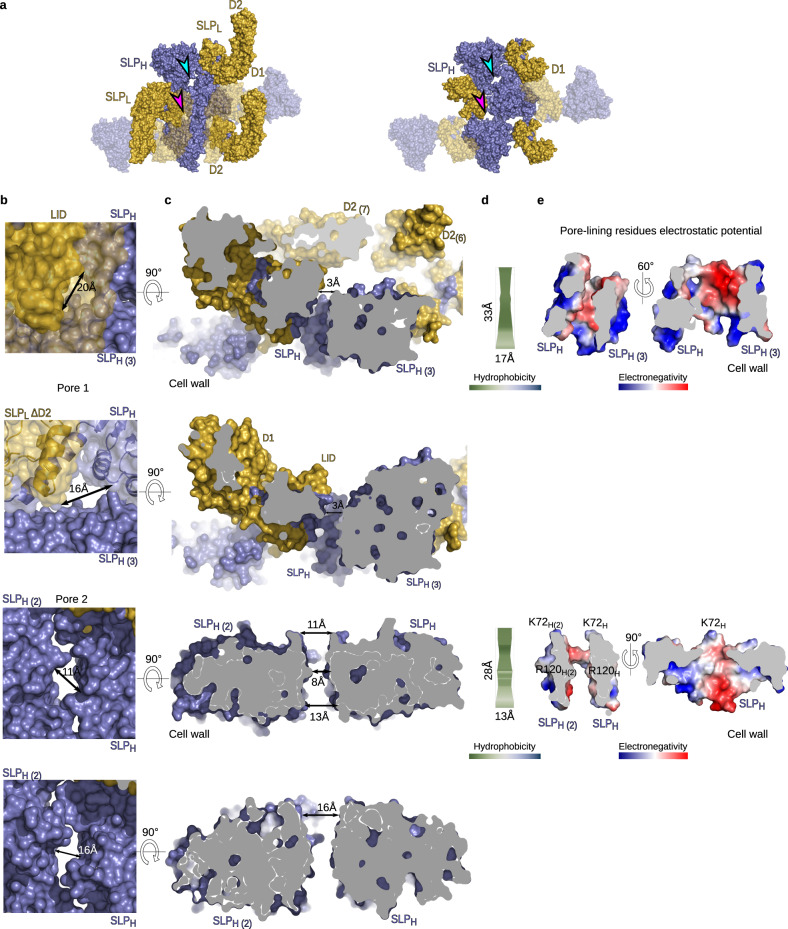
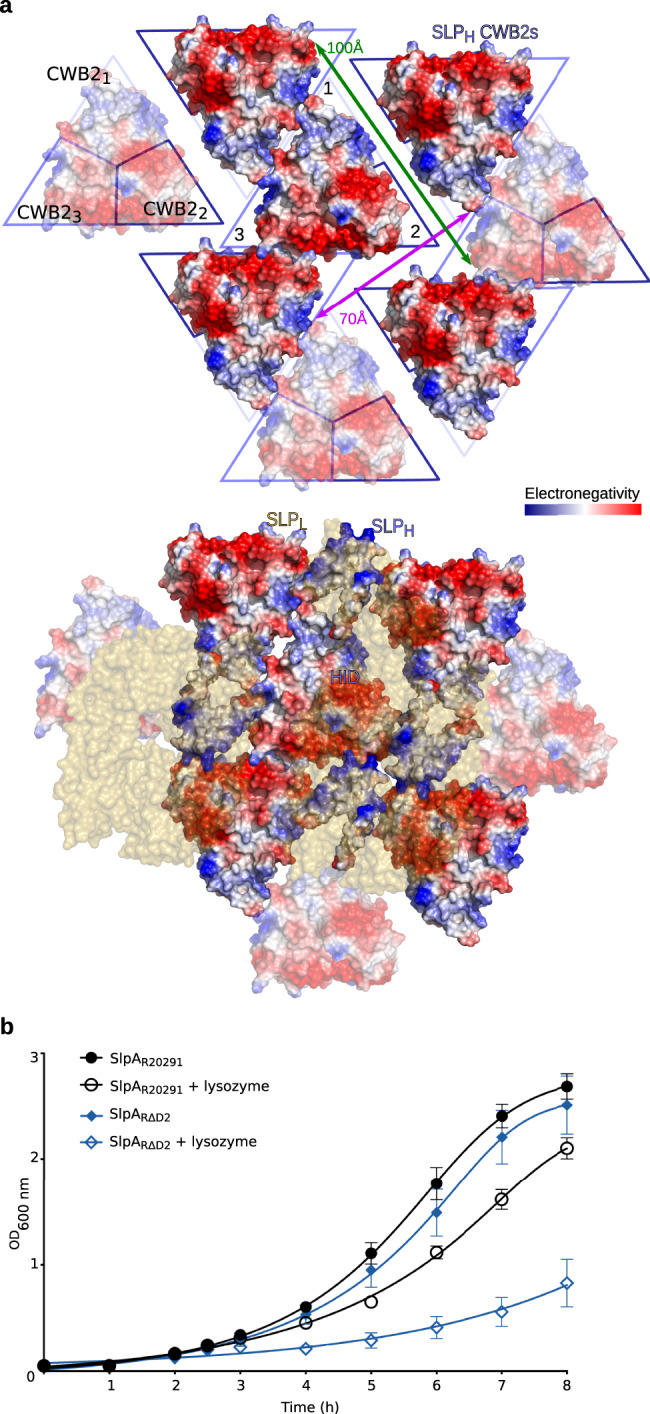
Many bacteria and archaea possess a two-dimensional protein array, or S-layer, that covers the cell surface and plays crucial roles in cell physiology. Here, we report the crystal structure of SlpA, the main S-layer protein of the bacterial pathogen Clostridioides difficile, and use electron microscopy to study S-layer organisation and assembly. The SlpA crystal lattice mimics S-layer assembly in the cell, through tiling of triangular prisms above the cell wall, interlocked by distinct ridges facing the environment. Strikingly, the array is very compact, with pores of only ~10 Å in diameter, compared to other S-layers (30-100 Å). The surface-exposed flexible ridges are partially dispensable for overall structure and assembly, although a mutant lacking this region becomes susceptible to lysozyme, an important molecule in host defence. Thus, our work gives insights into S-layer organisation and provides a basis for development of C. difficile-specific therapeutics.


Conflict of interest statement

The authors declare no competing interests.

Figures

Fig. 1
Fig. 1. Architecture of C. difficile SLPH/SLPL (H/L) complex.
a SlpA arrangement on the cell surface (left; SLPL coloured in gold and SLPH in slate blue) with detailed organisation of protein building blocks in its primary sequence (middle) and quaternary structure (right). Numbering based on the subunits of SlpA from strain CD630, S-layer cassette type 7 (SLCT-7), PBD ID: 7ACY. b Cartoon representation of H/L complex as viewed from the external environment (top view, left) and side (right). The SLPL protrudes above the SLPH subunit, creating a two-plane arrangement. Three distinct structural features are observed: SLPH, D1 and D2, and LID/HID (regions highlighted in grey). c Charge distribution across CWB2 motifs in SLPH as Poisson–Boltzmann electrostatic potential calculated for SlpACD630, shown as a gradient (positive in blue to negative in red). Views are shown from the extracellular and cell wall surfaces, followed by side views of the lateral faces defined by two interacting CWB2s. d Putty representations of SlpACD630 H/L complex showing B-factors ranging from low (blue and narrow) to high (red and wide). High B-factors are indicative of disorder/flexible regions. e Conservation of the SlpA sequence across annotated SlpA cassette types (SLCTs) depicted on putty representations of SlpACD630 H/L complex, coloured from conserved (purple) to variable (cyan). Conservation was calculated using Consurf web server.
Fig. 2
Fig. 2. Interactions and flexibility in C. difficile SLPH/SLPL (H/L) complex.
a Paperclip organisation of the interacting domains LID/HID is maintained by a range of interactions, with selected interface residues identified in strain R7404 (SLCT-7b, PDB ID: 7ACW) depicted as sticks. 2mFo-DFc electron density map is shown on the interacting amino acid pairs as a grey mesh contoured at 1.5 σ. Specific interatomic interactions identified with PDBePISA are represented as a dashed line. b Superimposing structures of SLPL/HID (gold/slate blue, PDB ID: 7ACV) onto the native complex of SlpAR7404 (SLCT-7b, PDB ID: 7ACX) (blue/white) reveals the flexibility of the LID-D1 linker, as illustrated by rotation of D1-D2 domains in relation to fixed position of LID/HID motif (left). The hinge loop enabling this conformational flexibility (determined by DynDom6D) is coloured in red. The backbone displacement (coloured from blue – low, to red – high Cα displacement deviation) is shown on the alignment of D1-D2 region of both structures (middle; SLPL/HID – opaque, H/L – semi-transparent) with the rotation angle of the LID/HID motif indicated with an arrow. Structural dynamics (right) of SLPL/HID, represented as increasing mobility (coloured blue – rigid, to red - mobile), calculated based on elastic network models implemented in DynOmics ENM version 1.0 server. c Probing of CD630 H/L complex interactions in vitro with ELISA, comparing effects of intact SLPL (gold circles), SLPH (slate blue circles), variants lacking interacting domains (black squares) and substitution mutants of F274A (structurally equivalent to F270 in R7404 LID/HID depicted in c, dark green triangles) and Y27A (structurally equivalent to Y26 in R7404 LID/HID in c, light green triangles) on H/L complex formation. Graphs represent mean ± standard deviation (SD) of n = 3 experiments, with least-squares curve fit of product formed upon the interaction of the two subunits. Source data provided in Source data file. d Western blot of cell surface extracts and culture supernatants, detecting (black arrowhead) SLPH (left) and SLPL (right) in strains devoid of endogenous slpA and expressing plasmid-borne SlpACD630 native protein or variants with either F274AL or Y27AH substitution mutants in SLPL or SLPH (denoted in subscript), respectively (n = 1). Detected product of partial degradation of SLPH indicated with an asterisk. Source data provided in Source Data file.
Fig. 3
Fig. 3. Planar crystal packing in the X-ray structure fits the in situ packing of the native S-layer.
a 2D schematic of H/L complex crystal packing, indicating the interaction network linking a single H/L (slate blue/gold) complex with six other molecules in a planar arrangement generated by SLPH tiling. Array is depicted as seen from the extracellular environment, with symbols representing key interaction types in the crystal lattice, detailed in Supplementary Fig. 4. b Cartoon representation of the H/L planar array (PDB ID 7ACY, coloured as in a, views as defined in Fig. 1b). c Native C. difficile S-layer ghosts (electron micrograph, negatively stained, left. Scale bar: 2 µm) were used to compute Fourier transforms (middle). Micrograph is a lower magnification (×3000) of ghosts used to collect the images used (82351x) for Fourier transform computation and is representative of the morphology of S-layer ghosts. Typically spots from two or more lattices were observed. Fourier transform is representative of 36 images collected for R20291. Reciprocal lattice axes (red and white axes) are indicated for two observed lattices (scale bar 0.0125 Å−1). Intact frozen-hydrated C. difficile cells, examined by cryo-electron microscopy (right), show distinctive ridged surface indicated by red arrows (scale bar 50 nm). Micrograph is representative of whole-cell images, which were not used for data analysis and 2D map calculations. Instead, these were computed from homogenised fragments, as described in the Methods section. d, Orthogonal views of the 3D reconstruction of negatively stained S-layer ghost indicating the overall envelope in the native lattice. A rigid body fit of the structure of H/L complex determined by X-ray crystallography (PDB ID: 7ACY, cartoon representation, SLPL - gold, SLPH - slate) indicates a similar arrangement in the native S-layer ghosts and crystal packing. Reconstruction is shown from the environment (top left) and cell wall (top right), and side views in the 2D plane (bottom panels).
Fig. 4
Fig. 4. The flexible D2 domain is dispensable for S-layer assembly.
a Cartoon representation of the SlpARΔD2 H/L complex crystal structure (slate blue and gold, PDB ID: 7ACZ), superimposed onto SlpACD630 H/L complex structure (PDB ID: 7ACY, grey). Deleted D2 region is marked with a dashed line on the CD630 structure and corresponding schematic representation of the complex. Views as in Fig. 1b. 2D schematic of H/L complex crystal packing in SlpARΔD2, indicating the interaction network linking a single H/L (slate blue/gold) complex with five other molecules in a planar arrangement generated by SLPH tiling. b Superimposition of the 3D reconstruction of negatively stained S-layer ghost containing SlpA devoid of domain D2 (SlpARΔD2, light blue solid surface) on the reconstruction of native wild-type S-layer ghost (SlpAR20291, grey mesh). The missing density can be largely ascribed to that of the missing D2 domain (indicated with black arrowheads). Views as in Fig. 2d. c Fit of the SlpARΔD2 structure determined by X-ray crystallography (coloured as in c) into the S-layer (grey) reconstruction indicates a similar arrangement in the crystal packing and the native array. Views as in b.
Fig. 5
Fig. 5. C. difficile S-layer is a tightly packed array with very narrow pores.
a Surface representation of wild-type H/L (7ACY, left) and SlpARΔD2 H/L (7ACZ, right) crystal packing showing pores in the 3D crystal lattice. Positions of pores marked with arrowheads (pore 1 in magenta, pore 2 in cyan) are equivalent in both lattices. b Zoomed-in view of the pores generated by H/L multimerization. Pore 1, top view covered by D2 in SlpACD630 (first panel) and in SlpARΔD2 (second panel). Pore 2 – top view for SlpACD630 (third panel) and SlpARΔD2 (fourth panel). Widest openings are labelled for each pore. Arrows indicate the widest points in each pore, which are exposed in SlpARΔD2 due to the lack of D2 that completely covers it in SlpACD630. c Cross-section views of pore 1 and pore 2 in SlpACD630 (first and third panels, respectively) and SlpARΔD2 (second and fourth panels, respectively). Neighbouring SLPH (slate blue) and SLPL (gold) molecules that create the pores are shown in surface representation. d Hydrophobicity characteristics of the residues lining pore 1 (top) and 2 (bottom) calculated in ChexVis (see Methods section for details) according to Kyte-Doolittle scale, ranging from hydrophilic (green) to hydrophobic (blue), as per hydrophobicity gradient key. e Poisson–Boltzmann electrostatic potential calculated for residues lining pore 1 (first panel) and 2 (second panel) in SlpACD630 represented as a charge distribution (positive in blue and negative in red, as per electronegativity gradient key). Views and scale are as in c (left) and as a slice across the largest pore surface (right). Pseudo-symmetry-related lysine residues at the top and arginine residues at the bottleneck of pore 2 are highlighted.
Fig. 6
Fig. 6. SLPH and SLPL create a tightly packed 2D array.
a Tiling of SLPH CWB2 motifs via charge complementarity across each triangular prism face. Poisson–Boltzmann electrostatic potential calculated for SlpACD630 SLPH, represented as a charge distribution (positive – blue; negative - red) on the surface representation of SLPH array. Interacting surfaces between molecules 1–2, defined by pseudo-symmetry related CWB23-CWB21, and between molecules 1–3, defined by symmetry-related CWB23 triangular prism faces, are labelled. Cavity between symmetry-related CWB21-CWB22 surfaces, represented by green arrows (top) is partially obstructed by HID domains (electrostatic potential surface representation) and completely occluded by SLPL (gold) as shown on the bottom panel. A long cavity of ~70 Å at the CWB22 vertices represented by purple arrow (top) is also occluded by HID domains and interacting SLPL molecules (bottom). b Lysozyme resistance. Cultures of SlpAR20291 (circles) and SlpARΔD2 (diamond) were inoculated at an OD600nm of 0.05 and grown anaerobically at 37 °C with hourly OD600nm measurements. Where indicated (open circles, SlpAR20291; open diamonds, SlpARΔD2) lysozyme (500 μg ml−1) was added after 2.5 h growth. Data are presented as mean values (±SD) from two biological replicates, assayed in triplicate. Source data provided in Source Data file.

References

    1. Fagan RP, Fairweather NF. Biogenesis and functions of bacterial S-layers. Nat. Rev. Microbiol. 2014;12:211–222. - PubMed
    1. Baranova E, et al. SbsB structure and lattice reconstruction unveil Ca2+ triggered S-layer assembly. Nature. 2012;487:119–122. - PubMed
    1. Bharat TAM, et al. Structure of the hexagonal surface layer on Caulobacter crescentus cells. Nat. Microbiol. 2017;2:17059. - PMC - PubMed
    1. Sychantha D, et al. Molecular basis for the attachment of S-layer proteins to the cell wall of Bacillus anthracis. Biochemistry. 2018;57:1949–1953. - PubMed
    1. Fioravanti, A. et al. Structure of S-layer protein Sap reveals a mechanism for therapeutic intervention in anthrax. Nat. Microbiol. 10.1038/s41564-019-0499-1 (2019). - PubMed

Publication types

MeSH terms

Substances