. 2022 Feb 25;13(1):1068.
doi: 10.1038/s41467-022-28680-3.

Natural variation in Glume Coverage 1 causes naked grains in sorghum

Affiliations

Natural variation in Glume Coverage 1 causes naked grains in sorghum

Peng Xie et al. Nat Commun. .

Abstract

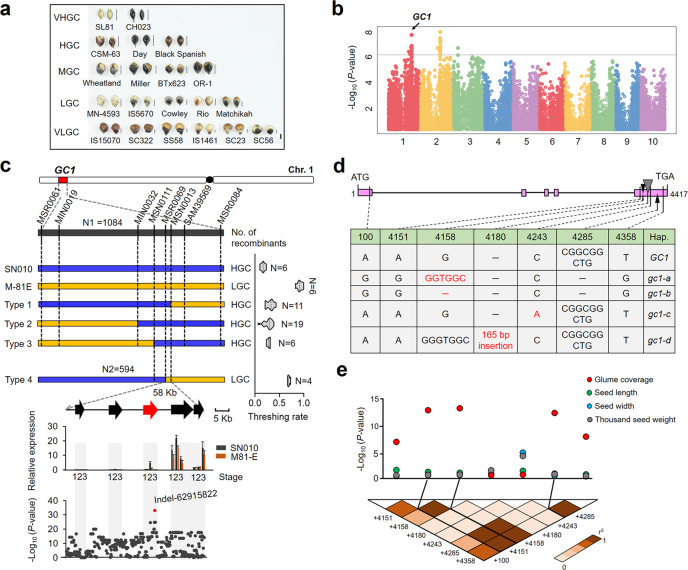
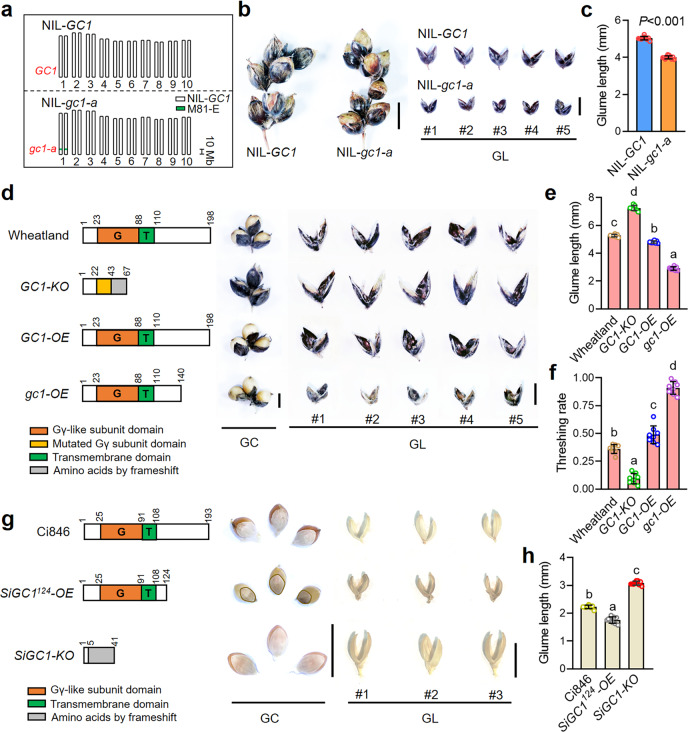
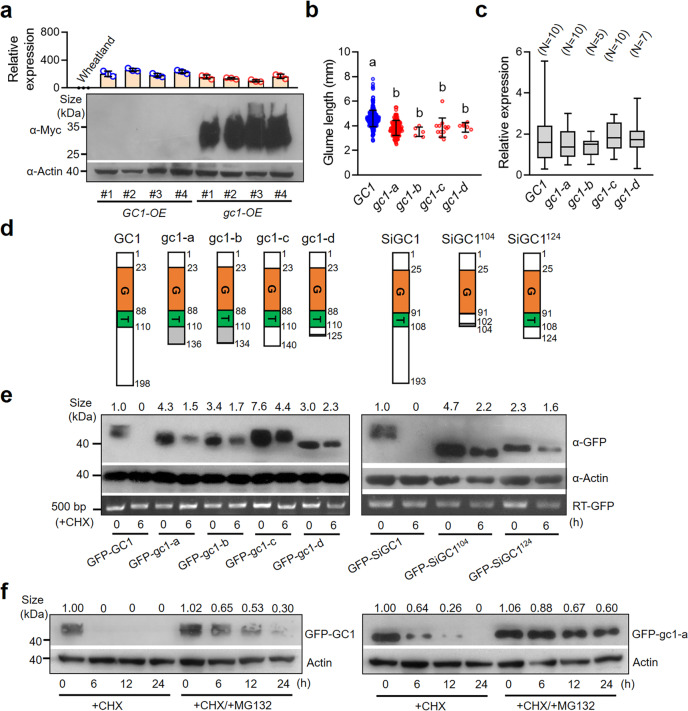
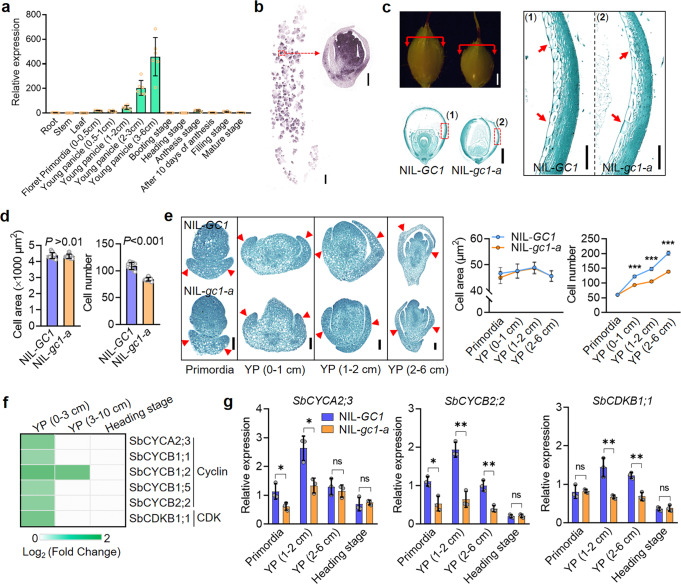
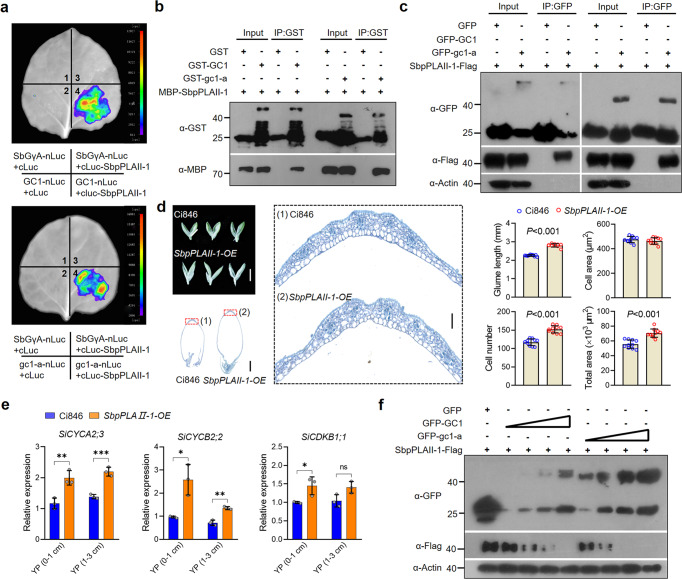
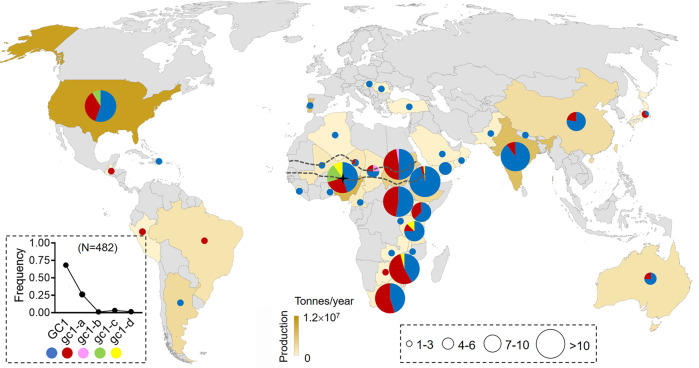
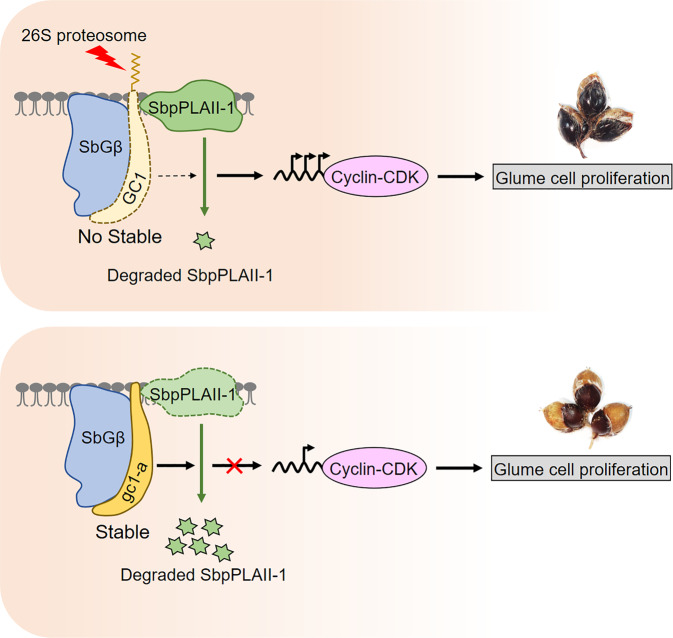
One of the most critical steps in cereal threshing is the ease with which seeds are detached from sticky glumes. Naked grains with low glume coverage have dramatically increased threshing efficiency and seed quality. Here, we demonstrate that GC1 (Glume Coverage 1), encoding an atypical G protein γ subunit, negatively regulates sorghum glume coverage. Naturally truncated variations of GC1 C-terminus accumulate at higher protein levels and affect the stability of a patatin-related phospholipase SbpPLAII-1. A strong positive selection signature around the GC1 genic region is found in the naked sorghum cultivars. Our findings reveal a crucial event during sorghum domestication through a subtle regulation of glume development by GC1 C-terminus variation, and establish a strategy for future breeding of naked grains.


Conflict of interest statement

The authors declare no competing interests.

Figures

Fig. 1
Fig. 1. Natural variations in GC1 are highly associated with glume coverage in sorghum.
a Five defined glume coverage degrees in diverse sorghum accessions. The corresponding thin line near each spikelet means quantitative glume length. Bar = 2 mm. VHGC very high glume coverage, HGC high glume coverage, MGC moderate glume coverage, LGC low glume coverage, VLGC very low glume coverage. b Manhattan plot from GWAS analysis of glume coverage in the natural SAP sorghum population. The gray horizontal line indicates the Bonferroni-adjusted significance threshold (P = 1E−06). c Map-based cloning of GC1 locus through the 1678 offspring plants of RHLs (see “Methods” section). The violin plot represents threshing rate. The dotted line in the middle is the median. The thin rectangles mean genomic region. The thick arrows depict five annotated genes. The red color represents the candidate gene. Relative expression of the five annotated genes at S1 (primordia), S2 (young panicle), and S3 (mature panicle) stages in two parental lines. Data are mean ± s.e.m. n = 3 biological replicates. Association analysis between the genetic variations and glume coverage in 58 sorghum inbred lines. The red dot shows the leading association signal on the fifth exon of the third candidate gene. d Nucleotide polymorphisms within the GC1 coding region of 482 sorghum accessions. Four detected malfunctional variations (highlight in red) in the fifth exon of GC1: a “GTGGC” insertion (gc1-a), a “G” deletion (gc1-b), a “C-A” substitution (gc1-c) and a 165 bp fragment insertion (gc1-d). Hap. haplotype. e GC1-based association mapping between the seven variations and four spikelet related traits in 188 sorghum accessions. LD analysis between the seven causal sites in the coding region indicates the linkage association signals. P-values were determined by two-tailed unpaired t-test. The three leading variant sites (+4151, +4158, and +4285) show highly association signals with strong LD which are highlighted by black lines. Source data are provided as a Source Data file.
Fig. 2
Fig. 2. The Gγ-like subunit negatively controls glume coverage in sorghum and millet.
a Genetic background of NIL-GC1 and NIL-gc1-a lines based on the self-crosses process derived from the cross between SN010 and M-81E. The green box in the long arm of chromosome 1 indicates the homozygous 58 Kb GC1 region derived from M-81E (gc1-a/gc1-a) (see “Methods” section). b Morphology of mature spikelet and glumes in NIL-GC1 and NIL-gc1-a. Bar = 5 mm. c Statistics of glume length in NIL-GC1 and NIL-gc1-a. Phenotypic data are mean ± s.e.m. n = 10 biological replicates. P-values were determined by two-tailed unpaired t-test. d Schematic diagram of peptide structure, mature spikelet and glumes in Wheatland (wild type of GC1), GC1-KO mutant, GC1-OE, and gc1-OE lines. Bar = 0.5 cm. e, f Statistics of glume length and threshing rate in the plants shown in d. Data are mean ± s.e.m. n = 8 biological replicates. g Schematic diagram of peptide structure, mature spikelet, and glumes in Ci846 (wild type of SiGC1), SiGC1124-OE line and SiGC1-KO mutants. Bar = 0.5 cm. The glume outline of SiGC1124-OE is highlighted by yellow lines. h Statistics of glume length in the plants shown in g. Data are mean ± s.e.m. n = 9 biological replicates. G, G protein γ subunit domain. T transmembrane domain, GC glume coverage, GL glume length. P values in e, f, h were determined by one-way ANOVA with Tukey’s multiple comparisons test. Source data are provided as a Source Data file.
Fig. 3
Fig. 3. The C-terminal truncated gc1 confers low glume coverage by accumulating higher protein level.
a Immunoblot analysis of Myc tag fused GC1 and gc1 proteins extracted from the young panicles of transgenic GC1-OE and gc1-OE sorghum plants, respectively. The relative expression of GC1 and gc1 in transgenic plants compared to Wheatland were detected by qPCR. b Glume length evaluation of five GC1 haplotypes among 482 sorghum accessions. Data are mean ± s.e.m. c Comparison of GC1 expression level among the five GC1 haplotypes. The two ends of the box plot and the upper, middle, and lower box lines represent the upper edge, lower edge, median and two quartiles of values in each group. Statistical significance was determined by one-way ANOVA with Tukey’s multiple comparisons test in b and c. d Schematic diagram of peptide structure of natural or synthetic GC1, gc1-a, gc1-b, gc1-c, gc1-d, SiGC1, SiGC1104, and SiGC1124 proteins. G, G protein γ subunit domain. T, Predicted transmembrane domain. The gray color shows the out-frame amino acids. e GFP tag fused with various deletion-based GC1 and SiGC1 proteins showed in d were transiently expressed in N. benthamiana leaves. Protein levels were subsequently analyzed by western blotting with anti-GFP antibody after 30 μM CHX treatment for 0 and 6 h. The expression of GFP tag from tobacco leaves were detected by RT-PCR. f The protein accumulation of GFP-GC1 and GFP-gc1-a extracted from tobacco leaves after treatments with CHX (30 μM) or CHX (30 μM) + MG132 (50 μM) for 0, 6, 12, and 24 h were analyzed by western blotting with anti-GFP antibody. Plant actin was used as the loading control. CHX cycloheximide. The numbers on the blot bands indicate the relative protein quantification by determination of grayscale value. Three independent experiments were performed in e and f. Source data are provided as a Source Data file.
Fig. 4
Fig. 4. gc1-a induces low glume coverage by repressing cell proliferation.
a Spatio-temporal expression pattern of GC1. Data are mean ± s.e.m. n = 6 biological replicates. b RNA in situ hybridization of GC1 in NIL-GC1 at 3 cm young panicle stage. Left bar = 2 mm. Right bar = 200 μm. c Longitudinal paraffin-section of glumes in NIL-GC1 and NIL-gc1-a at flowering stage. Bar = 1 mm. Magnified glume cell morphology in NIL-GC1 and NIL-gc1-a. Bar = 200 μm. d Statistics of glume cell area and cell number in NIL-GC1 and NIL-gc1-a. e Longitudinal paraffin-section of glumes in NIL-GC1 and NIL-gc1-a at four young panicle developmental stages. YP Young panicle. Bar = 200 μm. The red arrows show corresponding glume cells. Statistical data in d and e are mean ± s.e.m. n = 10 biological replicates. P-values were determined by two-tailed unpaired t-test. ***Significant probability level at P < 0.001. f Heatmap of downstream DEGs of GC1 related to Cyclin-CDK pathway. Fold change was calculated for NIL-GC1 samples compared with NIL-gc1-a samples. g Relative gene expression of Cyclin-CDK related genes SbCYCA2;3, SbCYCB2;2 and SbCDKB1;1 at four panicle stages. Data are mean ± s.e.m. ns not significant. Three biological repeats were performed. P-values were determined by multiple two-tailed unpaired t-test. *Significant probability level at P < 0.05. **Significant probability level at P < 0.01. Source data are provided as a Source Data file.
Fig. 5
Fig. 5. Both GC1 and gc1-a interact with and promote the degradation of SbpPLAII-1.
a GC1-nLuc and gc1-a-nLuc were co-transformed into tobacco leaves along with cLuc-tagged SbpPLAII-1 proteins by LCI assays. The typical sorghum G protein γ subunit of type A (SbGγA) and the empty cLuc were used as negative controls. Protein detection in this assay is shown in Fig. S10A. b In vitro pull‐down assays show both GST-tagged GC1 and GST-tagged gc1-a physically interact with MBP-tagged SbpPLAII-1. The MBP‐tagged SbpPLAII-1 protein pulled down with GST-GC1 or GST-gc1-a was detected by anti‐MBP antibody. The combination of GST and MBP-SbpPLAII-1 was used as a negative control. c GFP-tagged GC1 and GFP-tagged gc1-a both interact with Flag-tagged SbpPLAII-1 in co-immunoprecipitation assays. Each protein was independently extracted from tobacco leaves. The SbpPLAII-1-Flag protein co‐precipitated with GFP-GC1 or GFP-gc1-a was detected by anti‐Flag antibody. The combination of GFP and SbpPLAII-1-Flag was used as a negative control. d Glume architecture and glume cell morphology by longitudinal paraffin-section in the wild type Ci846 and SbpPLAII-1-OE millet lines at flowering stage. Top left bar = 2 mm. Bottom left bar = 500 μm. Right bar = 50 μm. Statistics Data are mean ± s.e.m. n = 10 biological replicates. P-values were determined by two-tailed unpaired t-test. *Significant probability level at P < 0.05. **Significant probability level at P < 0.01. ***Significant probability level at P < 0.001. e Gene expression of Cyclin-CDK related genes in SbpPLAII-1-OE millet plants. Gene expression detection of SiCYCA2;3, SiCYCB2;2 and SiCYCB2;2 (the homologs to SbCYCA2;3, SbCYCB2;2 and SbCYCB2;2, respectively) in the early young panicles of SbpPLAII-1-OE millet plants by qPCR assays. Three biological repeats were performed. P-values were determined by multiple two-tailed unpaired t-test. f GFP-tagged GC1 and gc1-a proteins can promote the degradation of Flag-tagged SbpPLAII-1. Total proteins of GFP, GFP-GC1, GFP-gc1-a, and Flag-SbpPLAII-1 were individually extracted from tobacco leaves. A gradient of concentrations (1/10, 3/10, 5/10, and 10/10 ratio of 100 μL volume) of GFP-GC1 or GFP-gc1-a protein was incubated with Flag-SbpPLAII-1 protein (10 μL volume). Each reaction was topped up by cell lysis from wild type tobacco leaves. GFP protein was used in control reaction. See in “Methods” section. Source data are provided as a Source Data file.
Fig. 6
Fig. 6. Geographic distribution and selection of GC1 haplotypes.
Geographic distribution of the wild type GC1 (blue color) and the other four mutated GC1 haplotypes in 38 countries worldwide (dark yellow). The pie chart indicates the frequency of haplotypes in each country. The black dot chart shows frequency of each haplotype among the total 482 sorghum accessions. GC1 was found in thirty-four countries while gc1-a occurred in nineteen countries. N number. Rare haplotypes gc1-b, gc1-c, and gc1-d were colored in pink, green and yellow. Countries with most of rare haplotypes were approximately localized to the Sahelian zone (gray dotted line). The black star shows Nigeria, which contains four GC1 haplotypes simultaneously. Circle size represents the number of sorghum accessions. The color depth of each country on the map indicates the average annual production of sorghum in recent 20 years. Source data are provided as a Source Data file.
Fig. 7
Fig. 7. A proposed working model for GC1 regulates SbpPLAII-1 degradation and controls glume coverage.
G protein β subunit and G protein γ subunit GC1 could form a dimer to conduct a Gβγ-mediated signaling. SbpPLAII-1 functions as a positive regulator in glume cell proliferation by promoting the transcripts of Cyclin-CDK related genes. The G protein γ subunit can interact and promote the degradation of SbpPLAII-1. In wild type, the long tail of GC1 could increase the 26S proteasome-dependent degradation, resulting in an unstable protein level. This subsequently leads to a normal phospholipase SbpPLAII-1 level and results in a final high glume coverage phenotype in sorghum. However, the truncated gc1-a protein (short tail) is more stable than GC1 (long tail) due to the absence of C-terminus, and then enhances the degradation of SbpPLAII-1. It leads to a significantly inhibited SbpPLAII-1 signal involved in glume cell proliferation and therefore causes low glume coverage in sorghum.

Similar articles

Cited by

References

    1. Dubcovsky J, Dvorak J. Genome plasticity a key factor in the success of polyploid wheat under domestication. Science. 2007;316:1862–1866. - PMC - PubMed
    1. Adeyanju A, Perumal R, Tesso T. Genetic analysis of threshability in grain sorghum [Sorghum bicolor (L.) Moench] Plant Breed. 2015;134:148–155.
    1. Smith, W. C. & Frederiksen, R. A. Sorghum: Origin, History, Technology and Production (Wiley, 2000).
    1. Ayyangar GNR, Ayyar MAS, Narayanan TR, Nambiar AKK. The grain sorghums of the Durra group. Proc. Natl Acad. Sci. India Sect. B Biol. Sci. 1942;15:133–147.
    1. Urano D, Jones AM. Heterotrimeric G protein-coupled signaling in plants. Annu. Rev. Plant Biol. 2014;65:365–384. - PMC - PubMed

Publication types