. 2022 Feb 25;13(1):1056.
doi: 10.1038/s41467-022-28591-3.

Increased fMRI connectivity upon chemogenetic inhibition of the mouse prefrontal cortex

Affiliations

Increased fMRI connectivity upon chemogenetic inhibition of the mouse prefrontal cortex

Federico Rocchi et al. Nat Commun. .

Abstract

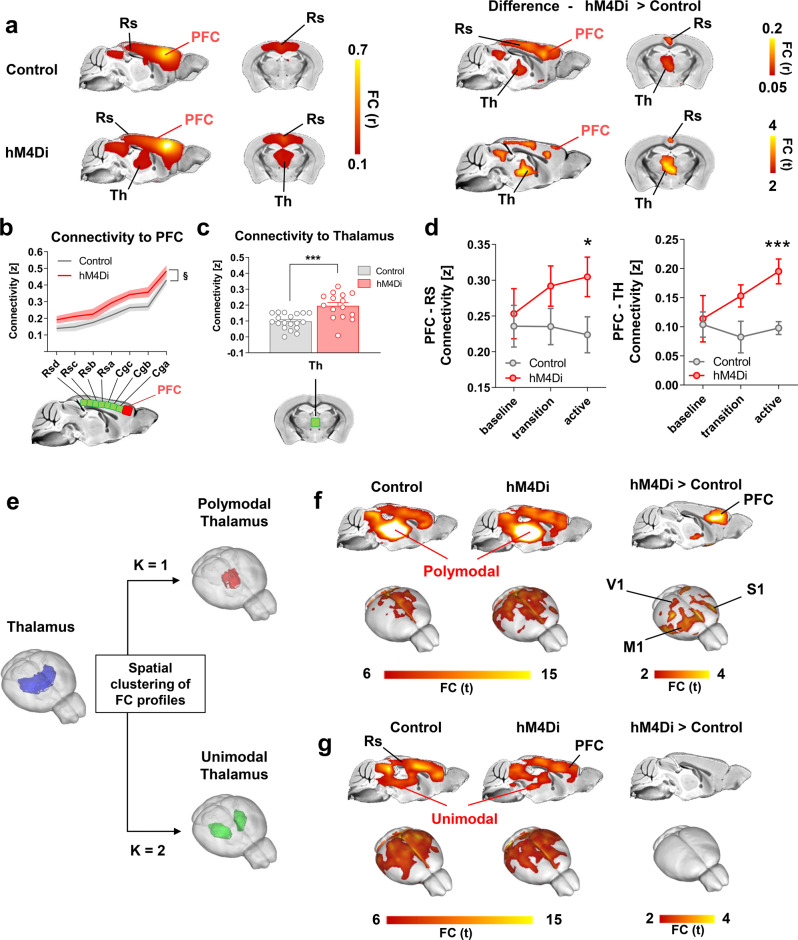
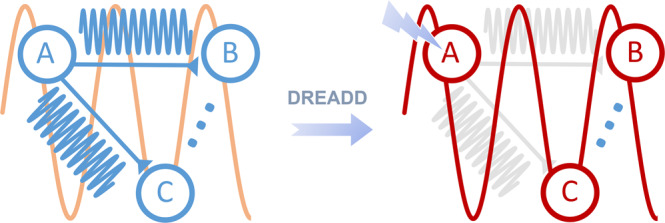
While shaped and constrained by axonal connections, fMRI-based functional connectivity reorganizes in response to varying interareal input or pathological perturbations. However, the causal contribution of regional brain activity to whole-brain fMRI network organization remains unclear. Here we combine neural manipulations, resting-state fMRI and in vivo electrophysiology to probe how inactivation of a cortical node causally affects brain-wide fMRI coupling in the mouse. We find that chronic inhibition of the medial prefrontal cortex (PFC) via overexpression of a potassium channel increases fMRI connectivity between the inhibited area and its direct thalamo-cortical targets. Acute chemogenetic inhibition of the PFC produces analogous patterns of fMRI overconnectivity. Using in vivo electrophysiology, we find that chemogenetic inhibition of the PFC enhances low frequency (0.1-4 Hz) oscillatory power via suppression of neural firing not phase-locked to slow rhythms, resulting in increased slow and δ band coherence between areas that exhibit fMRI overconnectivity. These results provide causal evidence that cortical inactivation can counterintuitively increase fMRI connectivity via enhanced, less-localized slow oscillatory processes.


Conflict of interest statement

The authors declare no competing interests.

Figures

Fig. 1
Fig. 1. Chronic inhibition of the mouse PFC results in rsfMRI overconnectivity.
a Viral expression localization. The potassium channel Kir2.1 (n = 16) or GFP (control, n = 19) were transduced bilaterally into the PFC of adult male mice. Left: representative histology sample showed Kir2.1 (green). Right: heatmaps illustrate a qualitative regional assessment of viral expression across subjects. b Seed-based connectivity mapping of the PFC in GFP (control), and Kir2.1-transduced subjects. c Corresponding group difference maps. Area exhibiting significantly increased rsfMRI connectivity in Kir2.1 expressing mice are depicted in red-yellow (r and T stat difference map). d Antero-posterior profiling of rsfMRI connectivity of the PFC within the midline axis of the mouse DMN (§p = 0.014, two-way ANOVA with repeated measurements, genotype effect, n = 16 and n = 19 Kir2.1 or GFP-expressing mice, respectively). e Fronto-thalamic rsfMRI overconnectivity in Kir2.1 expressing mice (*p = 0.014, two-sided t test, n = 16 and n = 19 Kir2.1 or GFP-expressing mice, respectively). Data in e and f are presented as mean values ± SEM. f Regions exhibiting rsfMRI overconnectivity in Kir2.1 mice are robustly innervated by the PFC. Left: axonal projections from the PFC (top 20% strongest connections). Middle: scatter plot illustrating intergroup differences in rsfMRI connectivity as a function of PFC structural connectivity strength. Green dots indicate significantly functionally overconnected voxels. Right: Distribution of overconnected voxels as a function of axonal connectivity strength . FC functional connectivity, DMN Default Mode Network, Cg cingulate cortex, PFC prefrontal cortex, Rs retrosplenial, Th thalamus. Source data are provided as a Source Data file.
Fig. 2
Fig. 2. Chemogenetic inhibition of neural firing in the PFC.
a Experimental design of chemo-fMRI experiments. AAV8-hSyn-hM4Di (n = 15) or AAV8-hSyn-GFP (control, n = 19) were bilaterally injected into the PFC of wild type. Left: representative histology sample showed hM4Di (red) expression. Right: heatmaps illustrate a qualitative regional assessment of viral expression across subjects. b Mice underwent chemo-fMRI scanning or c electrophysiological recordings to probe effectiveness of chemogenetic manipulations. A reference acquisition timeline is reported to depict timeseries binning into a 15-min pre-CNO reference baseline, a drug equilibration window (15 min, transition), and a 35-min CNO active time window (active). d Representative raw traces collected before and after CNO injection in representative recordings site of a hM4Di-expressing mouse. e, f Reduced firing rate in hM4Di-expressing mice (n = 5) compared to GFP-transduced controls (n = 5, two-sided Wilcoxon rank-sum tests, FDR corrected **q < 0.01, ***q < 0.001). Data are presented as mean values ± SEM. g Scatterplot comparing the firing rate of individual PFC recording channels during baseline conditions (x axis) and the active phase (y axis) in control and DREADD-expressing animals (two-sided Wilcoxon rank-sum test FDR corrected, **q < 0.01, ***q < 0.001). Source data are provided as a Source Data file.
Fig. 3
Fig. 3. Chemogenetic inhibition of the mouse PFC results in rsfMRI overconnectivity.
a Seed-based connectivity of the PFC and between group difference map revealed rsfMRI over-connectivity in the DMN of hM4Di expressing mice during the active phase. b Antero-posterior profiling of rsfMRI connectivity of the PFC along the midline axis of the mouse DMN in the two cohorts (§p = 0.106, two-way ANOVA repeated measurements, genotype effect, n = 15 and n = 19 control or hM4Di-expressing animals, respectively). c Thalamo-cortical rsfMRI hyper synchronization in hM4Di expressing mice and d prefrontal-retrosplenial and prefrontal-thalamic connectivity timecourse (*p = 0.039, ***p < 0.001, two-sided t test, n = 15 and n = 19 hM4Di or GFP-expressing mice, respectively.) Data in bd are presented as mean values ±SEM. e k-means clustering of PFC-thalamic rsfMRI connectivity profiles (thalamus, blue; polymodal thalamus, red; unimodal thalamus, green) in Control (n = 19) and hM4Di (n = 15) animals. f, g Seed connectivity of sub-thalamic partitions (f polymodal thalamus; g unimodal thalamus) and corresponding between group difference maps. FC functional connectivity, Cg cingulate cortex, M1 motor cortex, S1 sensory cortex, PFC prefrontal cortex, Rs retrosplenial cortex, Th thalamus, V1 visual cortex. Source data are provided as a Source Data file.
Fig. 4
Fig. 4. Chemogenetic inhibition of the PFC reduces ƴ activity but increases slow oscillatory power.
a Mean post-injection spectrogram in control (left), hM4Di-expressing animals (center), and mean between group difference (right). b Quantification of band-specific power spectrum changes upon CNO injection in both groups (*q < 0.05, ***q < 0.001, two-sided Wilcoxon rank-sum tests followed by FDR correction, for n = 50 and n = 60 statistically independent recordings from n = 5 hM4Di and n = 5 control mice, respectively). c Example traces of band-passed δ-band LFPs and corresponding spiking activity (right) from a representative PFC recording channel during active phase in control and DREADD-expressing mice. Note the presence of greatly reduced, but more phase-locked firing in animals expressing hM4Di channel. d Violin plots depicting PLV of PFC spikes to slow and δ bands (***q < 0.001, two-sided Wilcoxon rank-sum tests followed by FDR correction for n = 79 and n = 80 statistically independent recordings from n = 5 hM4Di and n = 5 control mice, respectively). e Probability of firing (all sessions and datapoints) as a function of the phase angle of δ (bottom) and slow (top) bands. Phase conventions are such that 0 and 180 deg represent the peak and through of LFP, respectively. (Violin plots: thick lines represent median, dashed lines indicate 25th and 75th percentile, respectively). PLV phase-locking value. Source data are provided as a Source Data file.
Fig. 5
Fig. 5. Chemogenetic inhibition of the PFC results in increased interareal slow oscillatory coherence.
Baseline-normalized power coherence at different frequency bands for PFC-retrosplenial (a), PFC-thalamus (b), and retrosplenial-thalamus (c) electrode pairs (*q < 0.05, ***q < 0.001, one-sided Wilcoxon rank-sum test, FDR corrected for n = 50 and n = 40 statistically independent recordings from n = 5 hM4Di and n = 4 control mice, respectively). d Band-specific coherence and mean functional connectivity (FC) difference (hM4Di – Control) for all pairs of electrophysiologically-probed regions. Mean FC data were extracted for corresponding regional pairs (Fig. 3) during the CNO active time window in hM4Di and control animals. e Correlation between corresponding band-specific coherence and mean functional connectivity for all pairs of electrophysiologically-probed regions (PFC-Rs; PFC-Th; Rs-Th). Shaded area indicates 95% CI for δ. f Baseline-normalized phase coherence in slow and delta band between electrode pairs (Violin plots: thick lines represent median, dashed lines indicate 25th and 75th percentile, respectively; ***q < 0.001, two-sided Wilcoxon rank-sum tests, FDR corrected). PFC prefrontal cortex, PLV phase-locking value, Rs retrosplenial cortex, Th thalamus. Source data are provided as a Source Data file.
Fig. 6
Fig. 6. A schematic illustration of our findings.
Chemogenetically inhibiting neural activity in cortical node A (i.e. PFC) reduces high-frequency direct interactions between the manipulated region and its targets (B and C), concomitantly producing higher entrainment of residual spiking activity with ongoing global low-frequency oscillations (node C). Under the assumption (supported by our data) that rsfMRI interareal connectivity is primarily driven by low-frequency neural synchronization, this interpretative framework predicts both the observed increase in interareal slow and δ LFP coherence, and the corresponding increase in interareal rsfMRI connectivity.

Similar articles

Cited by

References

    1. Power J, Schlaggar B, Petersen S. Studying brain organization via spontaneous fMRI Signal. Neuron. 2014;84:681–696. - PMC - PubMed
    1. Hagmann, P. et al. Mapping the structural core of human cerebral cortex. PLoS Biol6, e159 (2008). - PMC - PubMed
    1. Wang Z, et al. The relationship of anatomical and functional connectivity to resting-state connectivity in primate somatosensory cortex. Neuron. 2013;78:1116–1126. - PMC - PubMed
    1. Coletta L, et al. Network structure of the mouse brain connectome with voxel resolution. Sci. Adv. 2020;6:eabb7187. - PMC - PubMed
    1. Honey CJ, et al. Predicting human resting-state functional connectivity from structural connectivity. Proc. Natl Acad. Sci. USA. 2009;106:2035–2040. - PMC - PubMed

Publication types