. 2022 Feb 25;13(1):1058.
doi: 10.1038/s41467-022-28609-w.

AP-4-mediated axonal transport controls endocannabinoid production in neurons

Affiliations

AP-4-mediated axonal transport controls endocannabinoid production in neurons

Alexandra K Davies et al. Nat Commun. .

Abstract

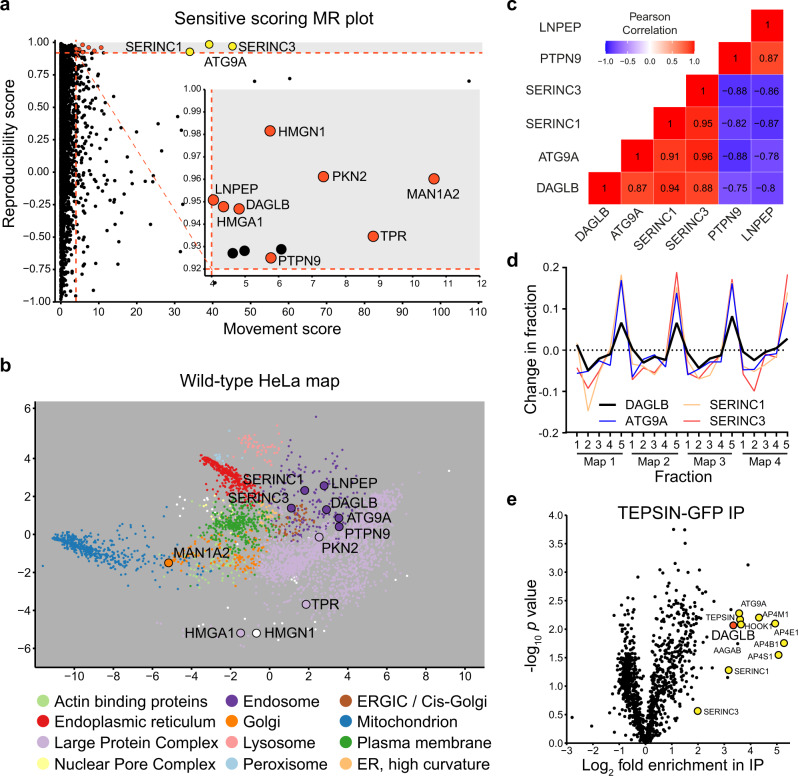
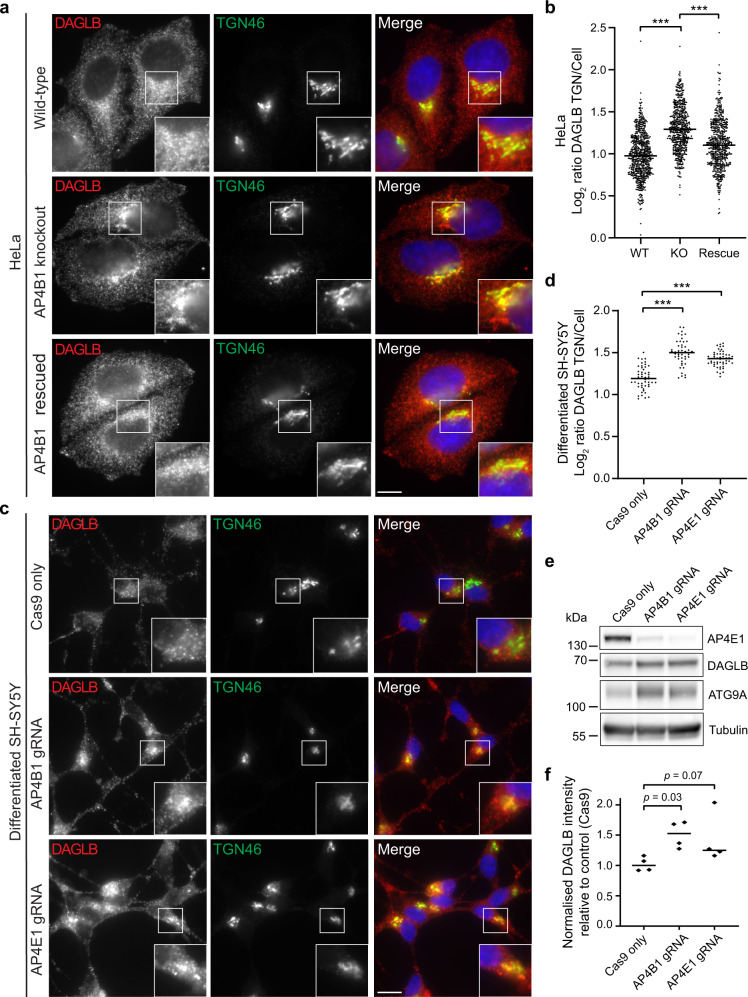
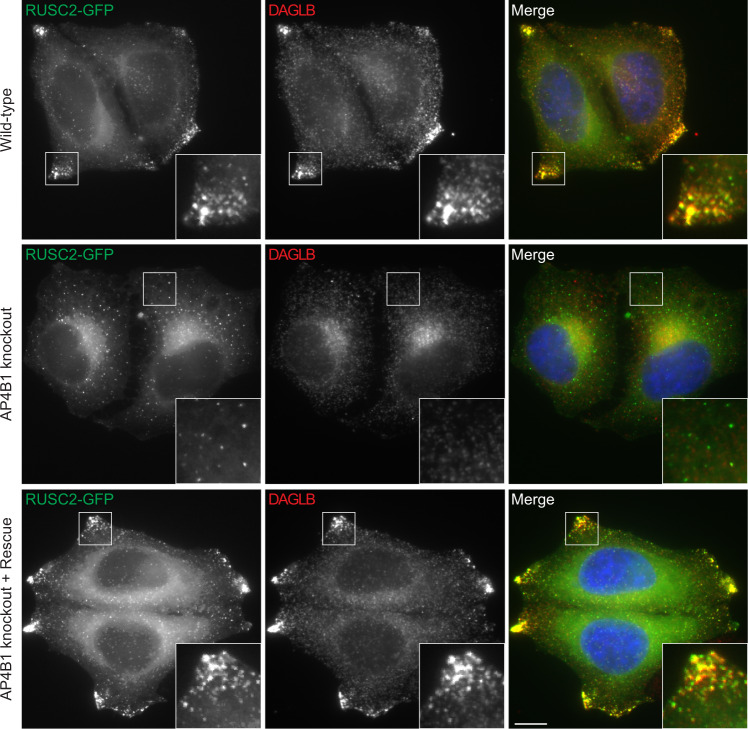
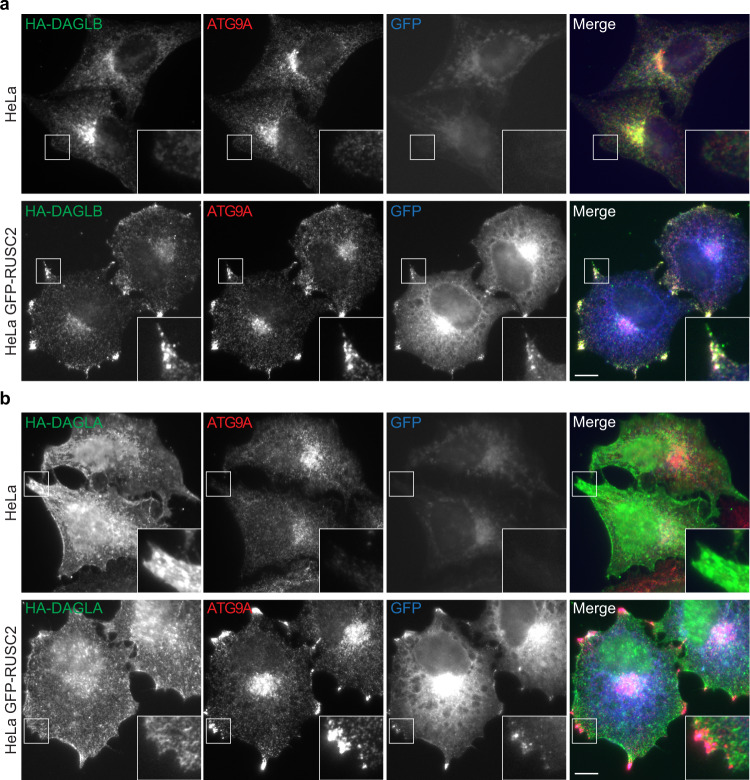
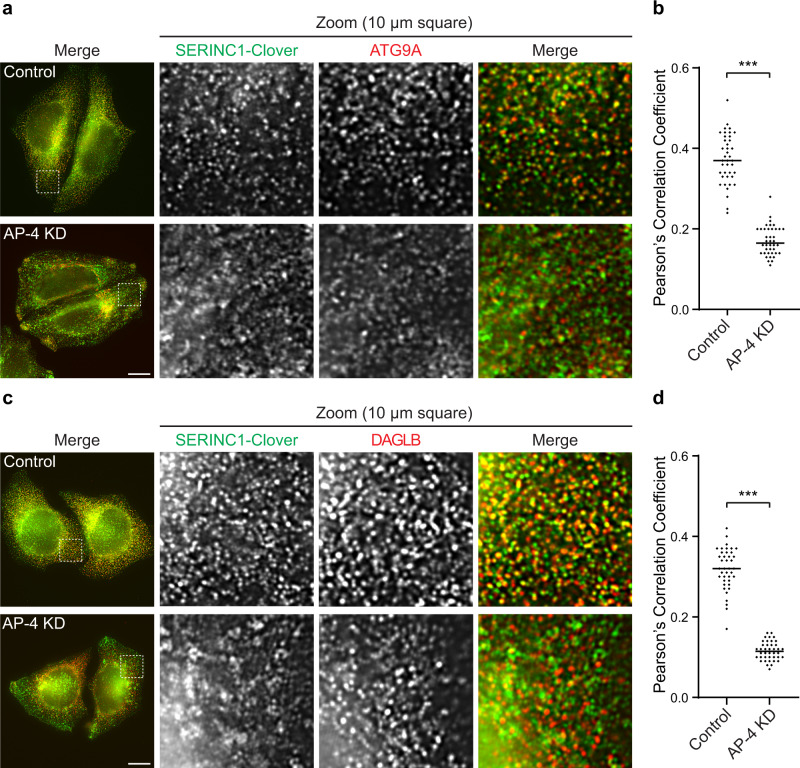
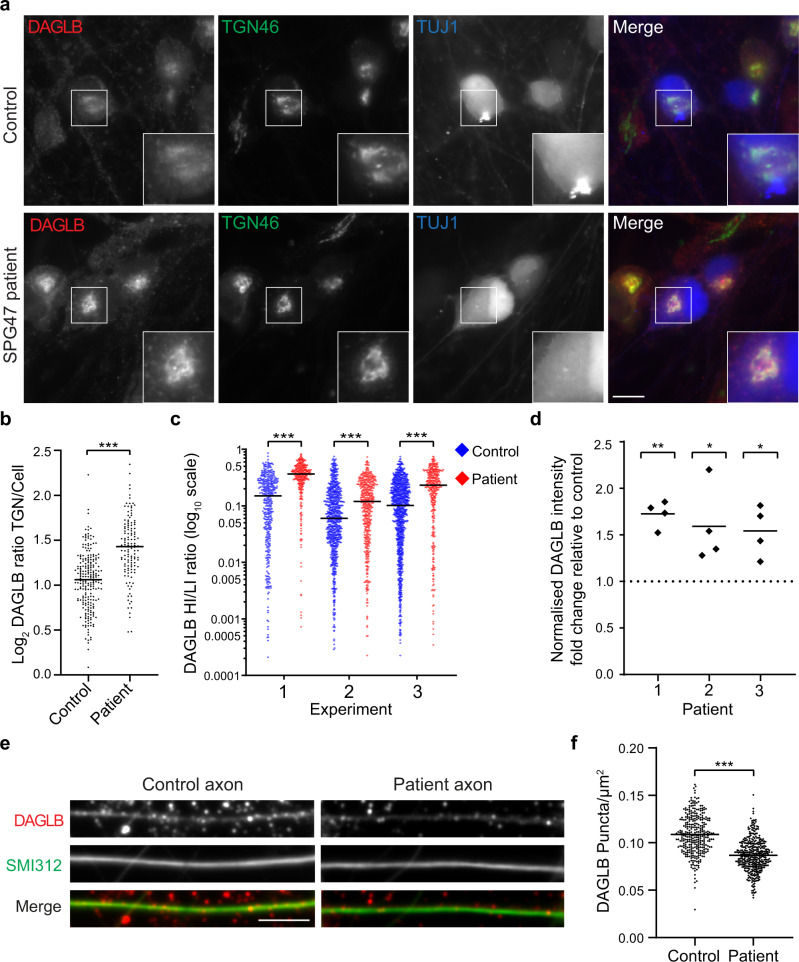
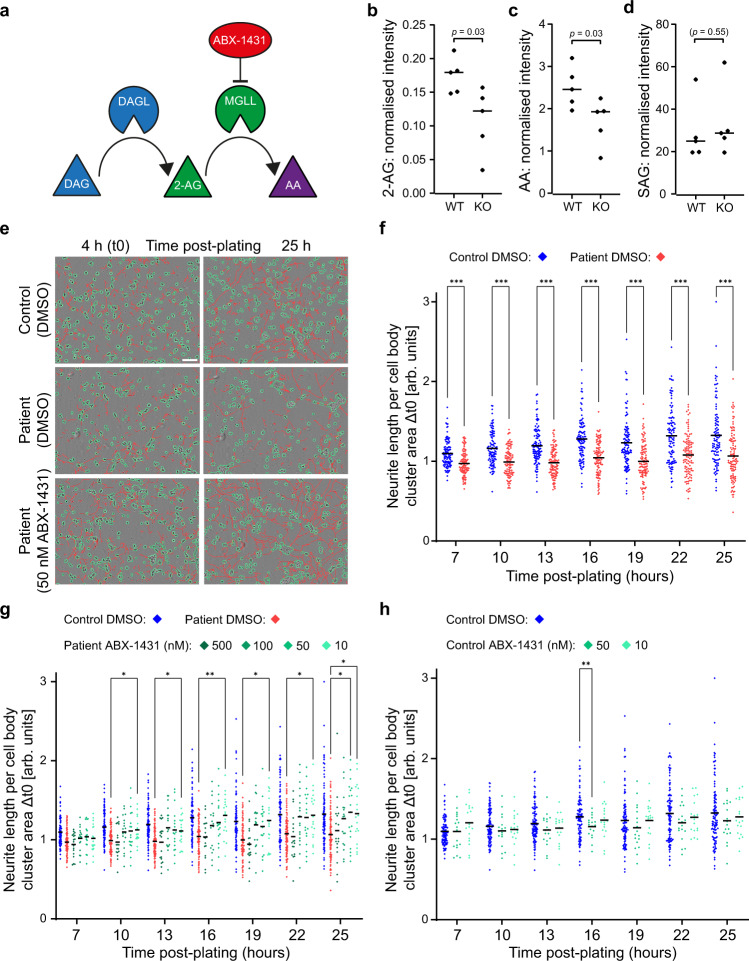
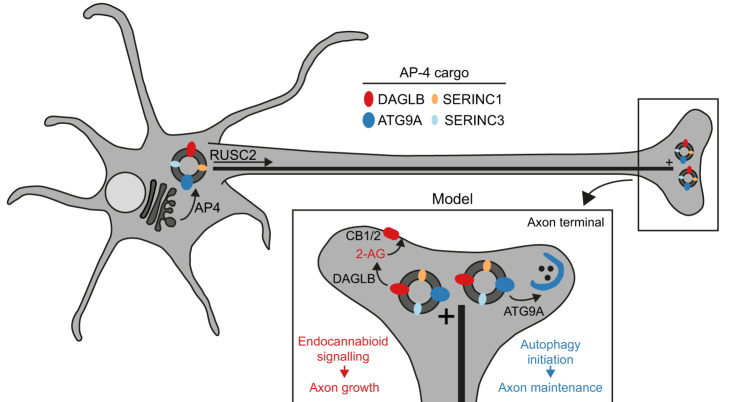
The adaptor protein complex AP-4 mediates anterograde axonal transport and is essential for axon health. AP-4-deficient patients suffer from a severe neurodevelopmental and neurodegenerative disorder. Here we identify DAGLB (diacylglycerol lipase-beta), a key enzyme for generation of the endocannabinoid 2-AG (2-arachidonoylglycerol), as a cargo of AP-4 vesicles. During normal development, DAGLB is targeted to the axon, where 2-AG signalling drives axonal growth. We show that DAGLB accumulates at the trans-Golgi network of AP-4-deficient cells, that axonal DAGLB levels are reduced in neurons from a patient with AP-4 deficiency, and that 2-AG levels are reduced in the brains of AP-4 knockout mice. Importantly, we demonstrate that neurite growth defects of AP-4-deficient neurons are rescued by inhibition of MGLL (monoacylglycerol lipase), the enzyme responsible for 2-AG hydrolysis. Our study supports a new model for AP-4 deficiency syndrome in which axon growth defects arise through spatial dysregulation of endocannabinoid signalling.


Conflict of interest statement

The authors declare no competing interests.

Figures

Fig. 1
Fig. 1. Sensitive analysis of Dynamic Organellar Maps identifies DAGLB as an AP-4 cargo protein.
a Dynamic Organellar Maps of AP4B1 knockout (KO) and AP4E1 KO HeLa cells were compared to maps of wild-type HeLa cells (each in duplicate, totalling four comparisons). Sensitive statistical scoring was used to detect proteins with a significantly altered distribution in the AP-4 KO cells that were not detected in a previous stringent analysis (see Methods for details). For 3926 proteins profiled across all maps, the ‘MR’ plot displays the median magnitude of shift (M) and the mean within-clone reproducibility of shift direction (R). The known AP-4 cargo proteins, ATG9A, SERINC1 and SERINC3 (marked in yellow), were identified with high M and R scores, as expected. The inset plot displays 8 additional hits (marked in red) whose subcellular localisation was significantly and reproducibly shifted in the AP-4 KO lines, with a false discovery rate of ~25%. Proteins that passed the M and R cut-offs but had poor across-clone reproducibility were not considered as hits (marked in black). b The hits from (a) are highlighted on a principal component analysis (PCA)-based visualisation of a deep Dynamic Organellar Map of wild-type HeLa cells (combined data from six replicate maps [http://mapofthecell.biochem.mpg.de/]. Each scatter point represents a protein and proximity indicates similar fractionation profiles. Colours indicate subcellular compartment assignment by support vector machine-based classification (white indicates compartment unassigned). Three hits, DAGLB, PTPN9 and LNPEP, map to the endosomal cluster (dark purple), like known AP-4 cargo proteins. c Heat map showing pairwise Pearson correlations between the shift profiles (abundance distribution profiles from knockout maps subtracted from the profiles from control maps) of DAGLB, ATG9A, SERINC1, SERINC3, PTPN9 and LNPEP. d The shift profiles of DAGLB, ATG9A, SERINC1 and SERINC3 are highly correlated, making DAGLB a strong new candidate AP-4 vesicle protein. Maps 1 and 2 are AP4B1 KO maps subtracted from wild-type maps; Maps 3 and 4 are AP4E1 KO maps subtracted from wild-type maps. Fraction numbers 1-5 refer to increasing centrifugation speeds. e High-sensitivity low-detergent immunoprecipitations (IP) from HeLa cells stably expressing the AP-4 associated protein TEPSIN-GFP were analysed by SILAC-based quantitative mass spectrometry. Data were analysed in comparison to mock immunoprecipitations from wild-type HeLa cells with a two-tailed one sample ratio t test against 0 (each in triplicate, n = 3). DAGLB (marked in red) was highly enriched along with known AP-4 vesicle proteins (marked in yellow). Source data are provided as a Source Data file.
Fig. 2
Fig. 2. DAGLB accumulates at the trans-Golgi network (TGN) in AP-4 knockout (KO) HeLa and neuronally differentiated SH-SY5Y cells.
a Widefield imaging of immunofluorescence double labelling of DAGLB (red) and TGN46 (green) in wild-type (WT), AP4B1 KO, and AP4B1 KO HeLa cells stably expressing AP4B1 (functional rescue). In the merged image, DAPI labelling of the nucleus is also shown (blue). Scale bar: 10 μm. b Quantification of the ratio of DAGLB labelling intensity between the TGN and the rest of the cell, in the cells shown in (a). The experiment was performed in biological triplicate and the graph shows combined replicate data: each datapoint indicates the log2 ratio for an individual cell (horizontal bar indicates median; n = 655 cells for WT; n = 588 cells for KO; n = 586 cells for Rescue; examined over three independent experiments). Data were subjected to a Kruskal–Wallis test with Dunn’s Multiple Comparison Post-Test for significance: ***p  ≤  0.001 (KO vs WT: p = 6.4 × 10−80; Rescue vs KO p = 1.0 × 10⁻²⁷. c CRISPR-Cas9 was used to deplete AP4B1 or AP4E1 in mixed populations of SH-SY5Y cells. Widefield imaging of immunofluorescence double labelling of DAGLB (red) and TGN46 (green) in control (parental Cas9-expressing), AP4B1-depleted and AP4E1-depleted neuronally differentiated SH-SY5Y cells. In the merged image, DAPI labelling of the nucleus is also shown (blue). Scale bar: 10 μm. d Quantification of the ratio of DAGLB labelling intensity between the TGN and the rest of the cell, in the cells shown in (c). The experiment was performed in biological triplicate and the graph shows combined replicate data: each datapoint indicates the log2 ratio calculated from a single image (horizontal bar indicates median; n = 50 images for Cas9 only; n = 47 images for AP4B1 gRNA; n = 50 images for AP4E1 gRNA; examined over three independent experiments). Data were subjected to a Kruskal-Wallis test with Dunn’s Multiple Comparison Test for significance: ***p  ≤  0.001 (Cas9 vs AP4B1: p = 1.1 × 10⁻¹⁵; Cas9 vs AP4E1: p = 1.3 × 10⁻⁹). e Western blots of whole-cell lysates from the cells shown in (c); alpha-tubulin serves as a loading control. The levels of DAGLB were increased in AP-4-depleted cells, similarly to ATG9A. f Quantification of DAGLB from (e) and replicate blots, normalised to alpha-tubulin, relative to the median control (Cas9 only) level (horizontal bars indicate median). Data are from n = 4 blots per cell line, and three separate differentiations. Log-transformed normalised intensity values were subjected to a one-way ANOVA with Dunnett’s Multiple Comparison Test for comparisons to the control. Source data are provided as a Source Data file.
Fig. 3
Fig. 3. Overexpression of the AP-4 vesicle transport adaptor RUSC2 drives DAGLB to the cell periphery.
Widefield imaging of HeLa cells stably expressing RUSC2-GFP (green), labelled with anti-DAGLB (red). Top panel, wild-type; middle panel, AP4B1 knockout; lower panel, AP4B1 knockout with transient expression of AP4B1 (rescue). In the merged image, DAPI labelling of the nucleus is also shown (blue). The insets show accumulation of RUSC2-GFP-positive and DAGLB-positive puncta at the cell periphery, and this only occurred in the presence of AP-4 (wild-type and rescue). Images are representative of at least 20 images per condition, including three independent rescue transfections. Immunofluorescence and microscopy were performed independently from two technical replicates of separate coverslips from the same batch of cells. Consistent results were observed for cells expressing RUSC2 with an N-terminal GFP tag and with AP4E1 knockout (data available at https://zenodo.org/record/5696988). Scale bar: 10 µm.
Fig. 4
Fig. 4. Unlike DAGLB, DAGLA is not rerouted in an AP-4 cargo redistribution assay.
a Widefield imaging of wild-type HeLa or HeLa cells stably expressing GFP-RUSC2 (blue), transiently expressing HA-DAGLB, and labelled with anti-HA (green) and anti-ATG9A (red). HA-DAGLB has a very similar localisation to ATG9A in both cell lines. The insets show the rerouting of HA-DAGLB to peripheral ATG9A- and RUSC2-positive puncta in cells overexpressing GFP-RUSC2. Scale bar: 10 µm. b Widefield imaging of wild-type HeLa or HeLa cells stably expressing GFP-RUSC2, transiently expressing HA-DAGLA, as in (a). HA-DAGLA has a different localisation to ATG9A and does not reroute to the peripheral puncta in cells overexpressing GFP-RUSC2. Scale bar: 10 µm. For (a) and (b), images are representative of at least 18 images per condition, including three independent transfections with microscopy performed independently for each.
Fig. 5
Fig. 5. DAGLB and ATG9A colocalise with SERINC1 in an AP-4-dependent manner.
HeLa cells tagged endogenously with Clover (modified GFP) at the C-terminus of SERINC1 were transfected with siRNA to knock down (KD) AP-4, or were transfected with a non-targeting siRNA (Control). a Super-resolution structured illumination microscopy (SR-SIM) was used to image SERINC1-Clover (via anti-GFP; green) and anti-ATG9A (red). Representative images show the whole field of view and a zoomed image of a peripheral 10 × 10 μm2 square. ATG9A and SERINC1 colocalised in small puncta throughout the cytoplasm in control cells, but not in AP-4 depleted cells. Scale bar: 10 μm. b Quantification of colocalisation between SERINC1-Clover and ATG9A in control and AP-4 knockdown (KD) cells, using Pearson’s Correlation Coefficient (PCC). The experiment was performed in biological duplicate and the graph shows combined replicate data: each datapoint indicates the PCC for an individual cell (horizontal bar indicates median; n = 40 cells per condition, examined across 2 independent experiments). Data were subjected to a two-tailed Mann–Whitney U-test: ***p  ≤  0.001 (p = 9.3 × 10⁻²³). c SR-SIM was used to image SERINC1-Clover (via anti-GFP; green) and anti-DAGLB (red), as in (a). Like ATG9A, DAGLB colocalised with SERINC1 in small puncta throughout the cytoplasm in control cells, but not in AP-4 depleted cells. Scale bar: 10 μm. d Quantification of colocalisation between SERINC1-Clover and DAGLB in control and AP-4 KD cells, using PCC. The experiment was performed in biological duplicate and the graph shows combined replicate data: each datapoint indicates the PCC for an individual cell (horizontal bar indicates median; n = 40 cells per condition, examined across 2 independent experiments). Data were subjected to a two-tailed Mann–Whitney U-test: ***p  ≤  0.001 (p = 1.9 × 10⁻²³). Source data are provided as a Source Data file.
Fig. 6
Fig. 6. DAGLB is missorted in iPSC-derived cortical neurons from AP-4-deficient patients.
iPSCs from patients with AP4B1-associated AP-4 deficiency syndrome (SPG47) and their unaffected same sex heterozygous parents (control) were differentiated into cortical neurons. a Widefield imaging of immunofluorescence triple labelling of DAGLB (red), TGN46 (green) and TUJ1 (a marker to distinguish neurons from co-cultured astrocytes; blue) in iPSC neurons from patient 1 and their matched control. DAGLB signal was increased at the trans-Golgi network (TGN) in the AP-4 patient cells. Scale bar: 10 μm. b Quantification of the ratio of DAGLB labelling intensity between the TGN and the rest of the cell, in the cells shown in (a). The experiment was performed in technical triplicate and the graph shows combined replicate data: each datapoint indicates the log2 ratio for an individual cell (horizontal bar indicates median; n = 227 cells for control; n = 129 cells for patient). Data were subjected to a two-tailed Mann–Whitney U-test: ***p  ≤  0.001 (p = 6.7 × 10⁻²⁰). c High-throughput confocal imaging was used to assay the distribution of DAGLB in iPSC-derived neurons from patient 1 and their matched control. Neurons in 96-well plates were labelled with antibodies against DAGLB, GOLGA1 (a TGN marker) and TUJ1. The ratio between the area of high intensity (HI; overlaps with TGN) and low intensity (LI) DAGLB labelling was quantified from three differentiations per cell line (biological triplicate; plotted separately): each datapoint indicates the ratio for an individual cell, plotted on a log10 scale (horizontal bar indicates median; experiment 1/2/3: n = 417/786/999 cells for control; n = 306/464/339 cells for patient). Data were subjected to a two-tailed Mann–Whitney U-test for comparison of the patient and control within each differentiation: ***p  ≤  0.001 (1: p = 2.4 × 10−37; 2: p = 7.2 × 10⁻¹⁰; 3: p = 3.2 × 10⁻²³). Comparable results for another SPG47 patient (patient 2) are shown in Supplementary Fig. 5b. d Western blotting was used to quantify the level of DAGLB in whole-cell lysates from iPSC-derived neurons from three patients with SPG47 and their unaffected same sex heterozygous parents. Data are from n = 4 differentiations per cell line, and the graph shows fold change in normalised DAGLB intensity in the patient relative to control (horizontal bars indicate mean). Log-transformed absolute normalised intensity values were subjected to a two-tailed paired t test for comparison of each patient with their matched control: **p  ≤  0.01; *p  ≤  0.05 (1: p = 0.001; 2; p = 0.036; 3: p = 0.019). e High-throughput confocal imaging was used to assay the density of DAGLB puncta in axons of iPSC neurons from patient 1 and their matched control. Representative images are shown of anti-DAGLB (red) in axons marked with the axonal marker antibody cocktail SMI312 (green). Scale bar: 10 μm. f Quantification of the number of DAGLB puncta per area (µm2) in axons from patient 1 and their matched control, from high-throughput confocal images as shown in (e). Each datapoint represents the mean number of DAGLB puncta per axon area per image (n = 324 images in the control group and n = 405 images in the patient group, covering 21902 and 25253 axon segments respectively). Data were subjected to a two-tailed unpaired t test: ***p  ≤  0.001 (p = 3.7 × 10−50). Source data are provided as a Source Data file.
Fig. 7
Fig. 7. 2-AG and AA are reduced in AP-4 knockout brains and MGLL inhibition rescues impaired neurite outgrowth in AP-4-deficient neurons.
a Diagram of the 2-AG biosynthesis pathway. Hydrolysis of diacylglycerol (DAG; blue) by DAG lipase (DAGL; blue) generates 2-arachidonoylglycerol (2-AG; green), which is hydrolysed by monoacylglycerol lipase (MGLL; green) to generate arachidonic acid (AA; purple). MGLL inhibition by the specific inhibitor ABX-1431 (red) blocks 2-AG hydrolysis and thereby increases the level of 2-AG. bd Mass spectrometry-based quantification of (b) 2-AG, (c) AA and (d) 1-stearoyl-2-arachidonoyl-sn-glycerol (SAG), from wild-type (WT) and Ap4e1 knockout (KO) mouse brains (n = 5 animals per group; horizontal bar indicates median; mice were aged 6 months). Data were subjected to a two-tailed Mann–Whitney U-test. e Neurite outgrowth was assayed in iPSC-derived cortical neurons from a patient with AP4B1-associated AP-4 deficiency syndrome (SPG47; patient 1) and their unaffected same sex heterozygous parent (control), using automated live cell imaging. Neurons were cultured in the presence of DMSO (vehicle control) or the MGLL inhibitor ABX-1431 at 10, 50, 100 or 500 nM (the highest two doses were administered only to the patient neurons). Neurons were monitored from 4 h post-plating, with images captured every 3 h until 25 h post-plating. Representative images are shown at 4 h (t0) and 25 h post-plating, with cell bodies outlined in green and neurites traced in red. Scale bar: 100 μm. fh Automated image analysis from neurite outgrowth assay of two separate neuronal differentiations per cell line shown in (e). Graphs show neurite length per image over time, normalised to cell body cluster area. Data are shown relative to normalised neurite length at t0. The same data are shown for the control plus DMSO condition in (fh) and for the patient plus DMSO condition in (f) and (g). f Average neurite length of patient neurons was significantly reduced compared to control neurons at all time points. Per group, n = 108 images from two biological replicates were analysed. Data were subjected to a two-way repeated measures ANOVA with Šídák’s multiple comparisons test for comparisons at each time point between control and patient: ***p  ≤  0.001. g Average neurite length of patient neurons was rescued by treatment with 10 nM ABX-1431. 50 and 100 nM ABX-1431 doses also increased neurite length, whereas neurite length was not improved by the highest dose (500 nM). Per treatment group, n = 18 images from two biological replicates were analysed. Data were subjected to a two-way repeated measures ANOVA with Dunnett’s multiple comparisons test for comparisons at each time point between each dose of ABX-1431 and the patient plus DMSO control: **p  ≤  0.01; *p  ≤  0.05. The control plus DMSO condition is shown for reference, but was not included in the statistical analysis. h Average neurite length of control neurons was not affected by treatment with 10 or 50 nM ABX-1431. Per treatment group, n = 18 images from two biological replicates were analysed. Data were subjected to a two-way repeated measures ANOVA with Dunnett’s multiple comparisons test for comparisons at each time point between each dose of ABX-1431 and the DMSO control: *p  ≤  0.05. In (fh) only significant changes are annotated; all other comparisons resulted in non-significant p values (p > 0.05). Source data are provided as a Source Data file.
Fig. 8
Fig. 8. A new cellular disease model for AP-4 deficiency syndrome.
Proposed model for the role of AP-4 in axonal transport based on our new and published data. AP-4 acts at the trans-Golgi network (TGN) membrane to package its cargo proteins, DAGLB, ATG9A, SERINC1 and SERINC3, into transport vesicles. RUSC2 mediates microtubule plus-end-directed transport of AP-4-derived vesicles, delivering cargo to the distal axon. DAGLB is an enzyme responsible for production of the endocannabinoid 2-AG, known to be required for axonal growth via autocrine activation of cannabinoid receptors. The previous model for AP-4 deficiency syndrome has focused on missorting of ATG9A, which is required for autophagy initiation and hence for axonal maintenance. We now propose that the neuronal pathology in AP-4 deficiency arises from the compound effects of DAGLB missorting on axonal development and ATG9A missorting on axonal autophagy.

References

    1. Guedes-Dias, P. & Holzbaur, E. L. F. Axonal transport: driving synaptic function. Science366, eaaw9997 (2019). - PMC - PubMed
    1. Davies AK, et al. AP-4 vesicles contribute to spatial control of autophagy via RUSC-dependent peripheral delivery of ATG9A. Nat. Commun. 2018;9:3958. - PMC - PubMed
    1. Mattera R, Park SY, De Pace R, Guardia CM, Bonifacino JS. AP-4 mediates export of ATG9A from the trans-Golgi network to promote autophagosome formation. Proc. Natl Acad. Sci. 2017;114:E10697–E10706. - PMC - PubMed
    1. De Pace R, et al. Altered distribution of ATG9A and accumulation of axonal aggregates in neurons from a mouse model of AP-4 deficiency syndrome. PLoS Genet. 2018;14:e1007363. - PMC - PubMed
    1. Ivankovic D, et al. Axonal autophagosome maturation defect through failure of ATG9A sorting underpins pathology in AP-4 deficiency syndrome. Autophagy. 2020;16:391–407. - PMC - PubMed

Publication types