. 2022 Feb 25;12(1):3200.
doi: 10.1038/s41598-022-07223-2.

Duchenne muscular dystrophy gene expression is an independent prognostic marker for IDH mutant low-grade glioma

Affiliations

Duchenne muscular dystrophy gene expression is an independent prognostic marker for IDH mutant low-grade glioma

Michael Naidoo et al. Sci Rep. .

Abstract

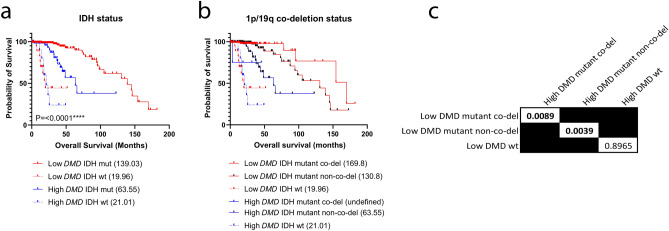
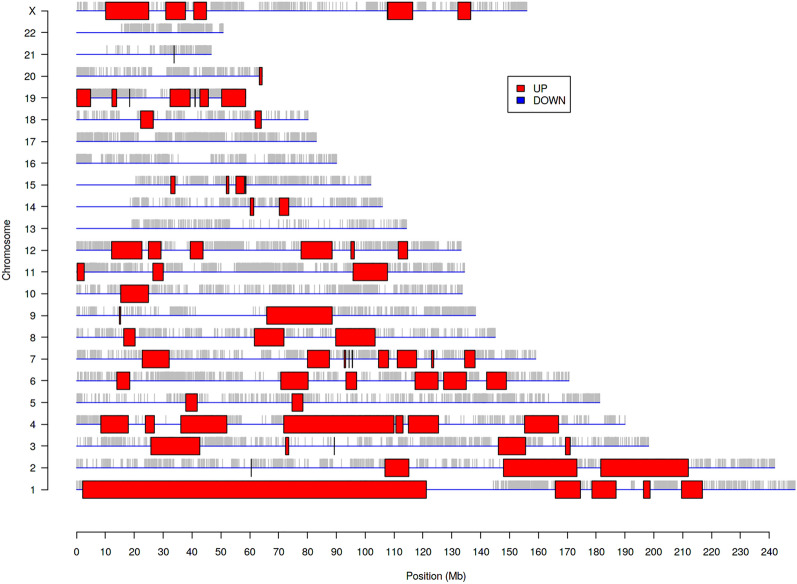
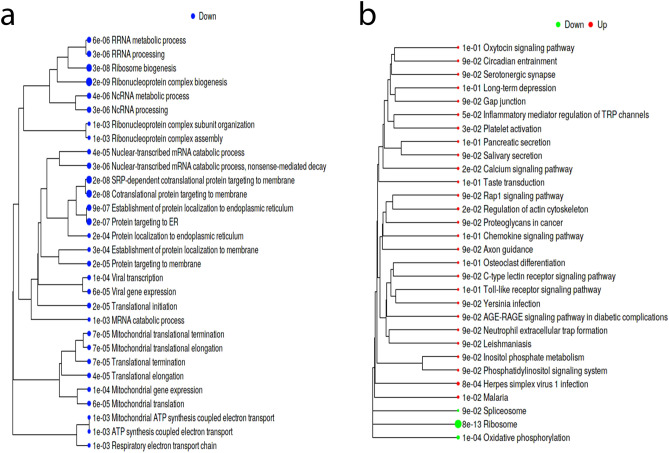
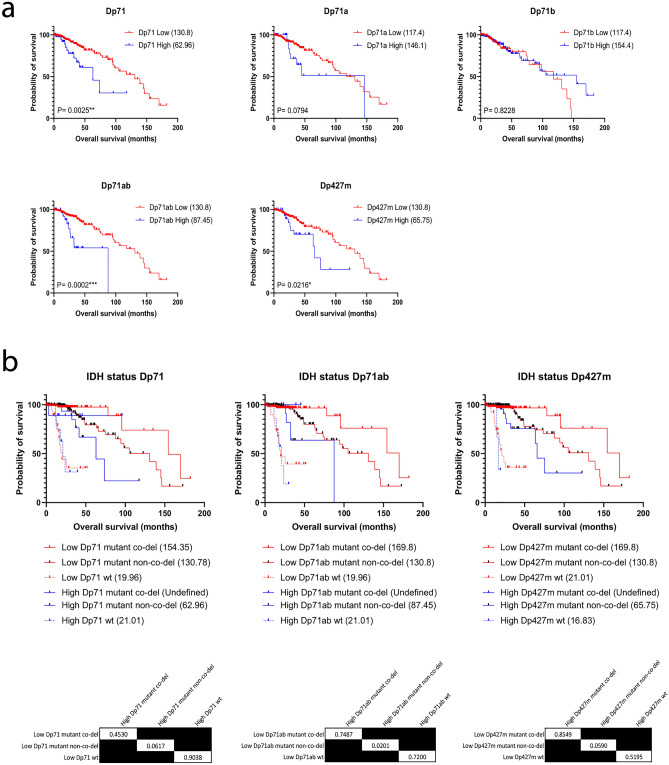
Alterations in the expression of the Duchenne muscular dystrophy (DMD) gene have been associated with the development, progression and survival outcomes of numerous cancers including tumours of the central nervous system. We undertook a detailed bioinformatic analysis of low-grade glioma (LGG) bulk RNAseq data to characterise the association between DMD expression and LGG survival outcomes. High DMD expression was significantly associated with poor survival in LGG with a difference in median overall survival between high and low DMD groups of over 7 years (P = < 0.0001). In a multivariate model, DMD expression remained significant (P = 0.02) and was an independent prognostic marker for LGG. The effect of DMD expression on overall survival was only apparent in isocitrate dehydrogenase (IDH) mutant cases where non-1p/19q co-deleted LGG patients could be further stratified into high/low DMD groups. Patients in the high DMD group had a median overall survival time almost halve that of the low DMD group. The expression of the individual DMD gene products Dp71, Dp71ab and Dp427m were also significantly associated with overall survival in LGG which have differential biological effects relevant to the pathogenesis of LGG. Differential gene expression and pathway analysis identifies dysregulated biological processes relating to ribosome biogenesis, synaptic signalling, neurodevelopment, morphogenesis and immune pathways. Genes spanning almost the entirety of chromosome 1p are upregulated in patients with high overall DMD, Dp71 and Dp427m expression which worsens survival outcomes for these patients. We confirmed dystrophin protein is variably expressed in LGG tumour tissue by immunohistochemistry and, overall, demonstrate that DMD expression has potential utility as an independent prognostic marker which can further stratify IDH mutant LGG to identify those at risk of poor survival. This knowledge may improve risk stratification and management of LGG.


Conflict of interest statement

The authors declare no competing interests.

Figures

Figure 1
Figure 1
High DMD expression is significantly associated with poor survival in LGG. (a) TCGA RNAseq data from WHO grade II LGG cases was dichotomised into high (blue) and low (red) DMD expressing groups and survival analysis performed in GraphPad using the log-rank test. Tumour subtype analysis was also performed. Numbers in brackets are median overall survival times in months. (b) Forest plot revealing the log-rank hazard ratio with 95% confidence intervals and number of patients for each group. A astrocytoma, OD oligodendroglioma, NOS not otherwise specified.
Figure 2
Figure 2
Pairwise comparison of Kaplan–Meier curves identifies a subgroup of IDH mutated LGG patients with poor survival. The Kaplan–Meier survival curves for high (blue) vs low (red) DMD expression for (a) IDH mutation status and (b) 1p/19q co-deletion status were compared. Numbers in brackets are median overall survival times in months. The table provides the log-rank test P values for each planned comparison from (b); the alpha value was adjusted to 0.017 to correct for multiple testing.
Figure 3
Figure 3
Genomic regions significantly dysregulated in WHO grade II LGG cases with high vs low DMD expression. Significantly altered regions are highlighted with coloured boxes.
Figure 4
Figure 4
Exploratory analysis of the DEGs in LGG cases with high versus low DMD expression. (a) Volcano and M-A plots of the log fold change of all genes. Upregulated and downregulated genes are indicated by red and blue points respectively. (b) STRING PPI network of DEGs with 60 edges (versus 20 expected) and an enrichment P value of 7.92e−13. Edge thickness indicates confidence, disconnected nodes are hidden. (c) Identification of significant hub genes from DEGs using the Cytohubba MCC and DMNC algorithms within Cytoscape. Colour represents ranking based on corrected P values from red to yellow, the expanded subnetwork is displayed by blue nodes. (d) Venn analysis of both sets of hub genes reveals 13 common significant hub genes. (e) Network tree visualisation of the enriched pathways in DEGs using the GO biological processes annotation, dot size corresponds to adjusted P values. (f) Visualisation of the relationship among enriched GO categories. Connected gene sets share more genes, colour of node represents adjusted P values.
Figure 5
Figure 5
Pathway analysis reveals high DMD expression downregulates biological processes related to ribosome biogenesis. iDEP was used to conduct pathway analysis using the generally applicable gene set enrichment (GAGE) method and the genes were annotated according to GO biological processes (a) or with Kyoto Encyclopaedia of Genes and Genomes (KEGG, b). The size of the dot corresponds to the adjusted P values.
Figure 6
Figure 6
WGCNA of the TCGA WHO grade II LGG dataset identified a network of 882 genes divided into five co-expression modules. (a) Gene dendrogram. Colours are randomly assigned except grey which represents areas unassigned to a module. (b) Networks of the top 20 genes for the entire network and each module individually. (c) Visualisation of the GO enrichment analysis for each module; heatmap was produced in GraphPad. (d) Venn analysis to identify common genes returned by both WGCNA and DEG analysis.
Figure 7
Figure 7
The expression of multiple DMD gene products are significantly associated with LGG survival outcomes. (a) LGG TCGA RNAseq data for each DMD isoform was dichotomised into high (blue) and low (red) expression groups and survival analysis performed in GraphPad using the log-rank test. Numbers in brackets are median overall survival times in months. (b) Kaplan–Meier survival curves for high (blue) vs low (red) Dp71, Dp71ab or Dp427m expression for each IDH mutation status group were compared. Numbers in brackets are median overall survival times in months. The tables provide the log-rank test P values for each planned comparison; the alpha value was adjusted to 0.017 to correct for multiple testing.
Figure 8
Figure 8
Exploratory analysis of the DEGs in LGG cases with high versus low Dp71, Dp71ab and Dp427m expression. (a) Venn analysis of the DEGs identified from high vs low overall DMD, Dp71, Dp71ab and Dp427m expression. The five DEGs common to all are listed. (b) STRING PPI networks of DEGs. Edge thickness indicates confidence, disconnected nodes are hidden. (c) Network tree visualisation of the enriched pathways in DEGs using the GO biological processes gene annotation, dot size corresponds to adjusted P values. Note no significant enrichment was found for Dp71 DEGs. (d) Pathway analysis using GO biological processes gene annotation. The heatmap was produced in GraphPad and displays the top 10 GO terms for high vs low DMD, Dp71, Dp71ab and Dp427m. Upregulated (red) and downregulated (blue) pathways are indicated.
Figure 9
Figure 9
Immunohistochemistry for dystrophin in LGG. Representative images of grade II astrocytoma (a), gemistocytic astrocytoma (b), oligodendroglioma (c) and NOS (d). Images were taken at × 20 magnification except for image (b) which was taken at × 40 magnification to better visualise the gemistocytic staining.

References

    1. McAvoy S, Ganapathiraju S, Perez DS, James CD, Smith DI. DMD and IL1RAPL1: Two large adjacent genes localized within a common fragile site (FRAXC) have reduced expression in cultured brain tumors. Cytogenet. Genome Res. 2007;119:196–203. doi: 10.1159/000112061. - DOI - PubMed
    1. McAvoy S, et al. Non-random inactivation of large common fragile site genes in different cancers. Cytogenet. Genome Res. 2007;118:260–269. doi: 10.1159/000108309. - DOI - PubMed
    1. Muntoni F, Torelli S, Ferlini A. Dystrophin and mutations: One gene, several proteins, multiple phenotypes. Lancet Neurol. 2003;2:731–740. doi: 10.1016/S1474-4422(03)00585-4. - DOI - PubMed
    1. Naidoo M, Anthony K. Dystrophin Dp71 and the neuropathophysiology of Duchenne muscular dystrophy. Mol. Neurobiol. 2020;57:1748–1767. doi: 10.1007/s12035-019-01845-w. - DOI - PMC - PubMed
    1. Ash A, Machado L, Raleigh SM, Anthony K. Neuropathophysiology of Duchenne muscular dystrophy: Involvement of the dystrophin isoform Dp71 in cell migration and proliferation. Neuromuscul. Disord. 2018;28:S13–S14. doi: 10.1016/S0960-8966(18)30328-6. - DOI