. 2022 Apr;41(15):2196-2209.
doi: 10.1038/s41388-022-02239-4. Epub 2022 Feb 25.

Effective targeting of breast cancer stem cells by combined inhibition of Sam68 and Rad51

Affiliations

Effective targeting of breast cancer stem cells by combined inhibition of Sam68 and Rad51

Alice Turdo et al. Oncogene. 2022 Apr.

Abstract

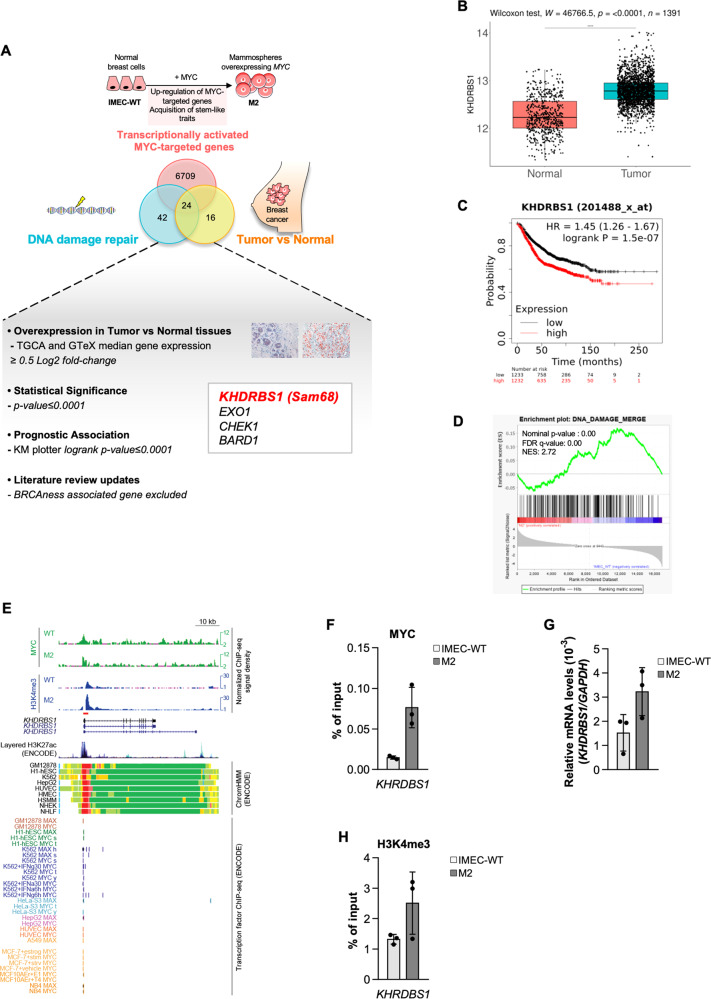
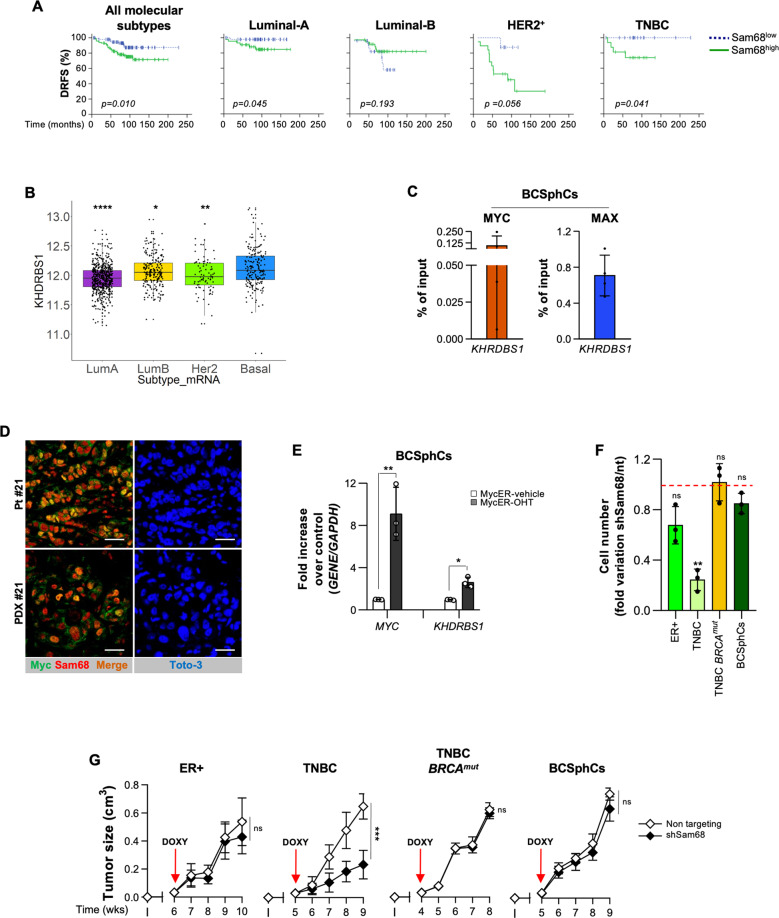
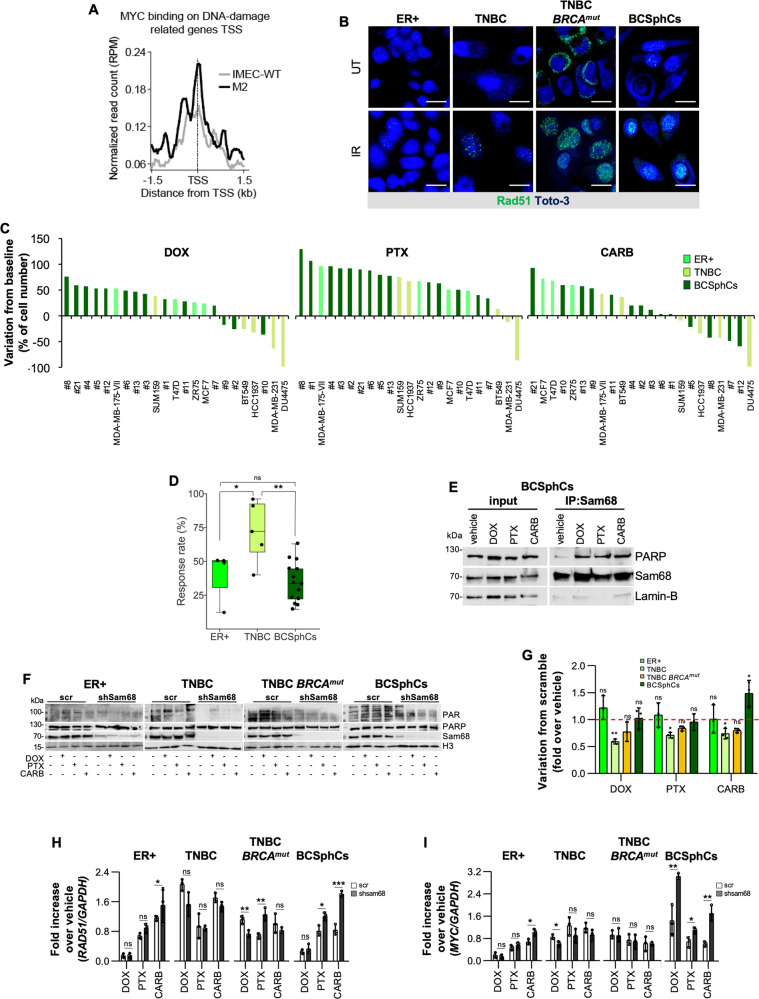
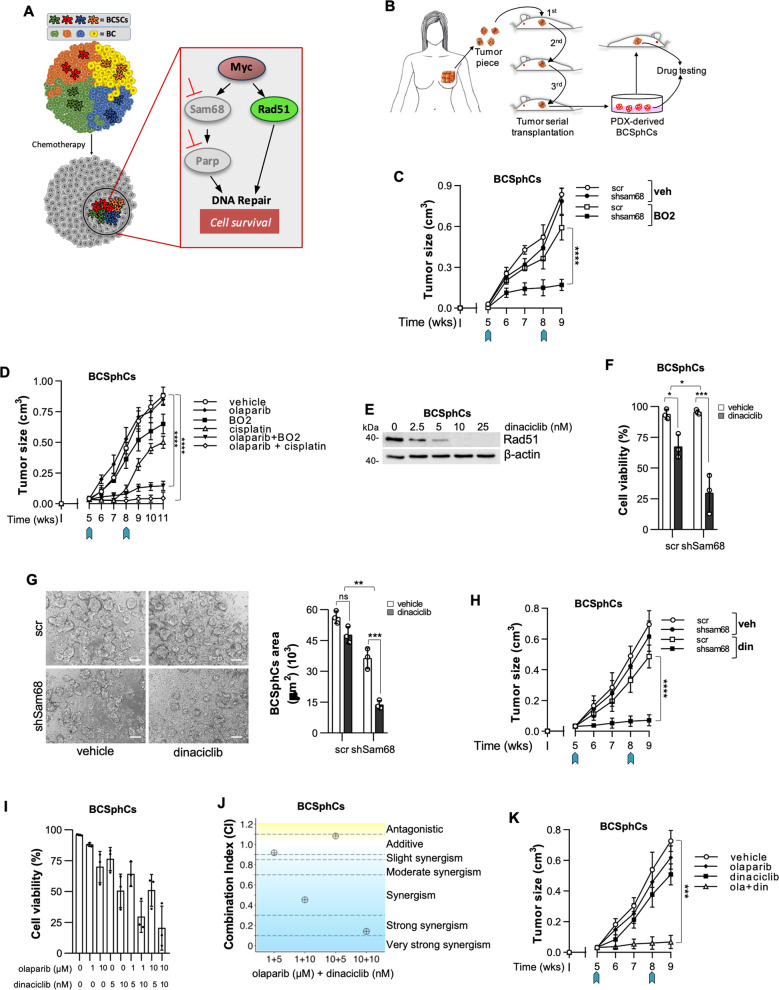
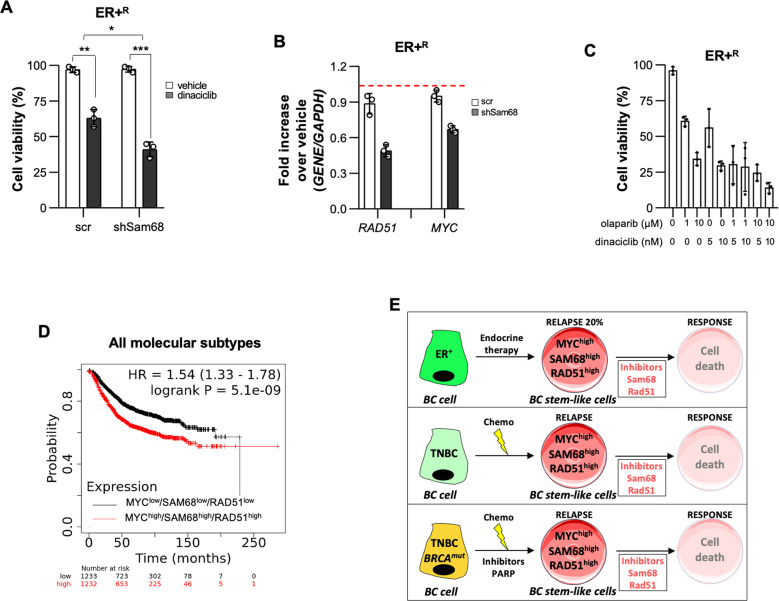
Breast cancer (BC) is the second cause of cancer-related deceases in the worldwide female population. Despite the successful treatment advances, 25% of BC develops resistance to current therapeutic regimens, thereby remaining a major hurdle for patient management. Current therapies, targeting the molecular events underpinning the adaptive resistance, still require effort to improve BC treatment. Using BC sphere cells (BCSphCs) as a model, here we showed that BC stem-like cells express high levels of Myc, which requires the presence of the multifunctional DNA/RNA binding protein Sam68 for the DNA-damage repair. Analysis of a cohort of BC patients displayed that Sam68 is an independent negative factor correlated with the progression of the disease. Genetic inhibition of Sam68 caused a defect in PARP-induced PAR chain synthesis upon DNA-damaging insults, resulting in cell death of TNBC cells. In contrast, BC stem-like cells were able to survive due to an upregulation of Rad51. Importantly, the inhibition of Rad51 showed synthetic lethal effect with the silencing of Sam68, hampering the cell viability of patient-derived BCSphCs and stabilizing the growth of tumor xenografts, including those TNBC carrying BRCA mutation. Moreover, the analysis of Myc, Sam68 and Rad51 expression demarcated a signature of a poor outcome in a large cohort of BC patients. Thus, our findings suggest the importance of targeting Sam68-PARP1 axis and Rad51 as potential therapeutic candidates to counteract the expansion of BC cells with an aggressive phenotype.


Conflict of interest statement

The authors declare no competing interests.

Figures

Fig. 1
Fig. 1. BCSphCs express high levels of Myc.
A Workflow showing the selection strategy for KHDRBS1 among DNA-damage response genes transcriptionally activated by Myc and significantly associated to breast cancer prognosis. Venn diagram showing the overlap between Myc-transcriptionally activated genes, DNA-damage response genes and genes associated to breast cancer. Specifically, genes were retrieved from: (i) microarray data of Myc-overexpressing mammospheres (M2) (GSE86407); (ii) published dataset (MD Anderson Human-DNA Repair Genes, https://www.mdanderson.org/documents/Labs/Wood-Laboratory/human-dna-repair-genes.html), BioRad DNA-damage signaling pathway (SAB Target List H96) and recently published DNA-damage-associated genes (Supplementary Table 6); and (iii) breast cancer versus normal breast tissues TCGA BRCA and GTeX gene expression data (Supplementary Table 7). Genes were further selected for association to the worse relapse-free survival probability in breast cancer (Supplementary Table 8) [25] and novelty in the field, excluding known genes associated with BRCAness. B Box plot representing the distribution of log2 gene expression of KHDRBS1 retrieved from TCGA BRCA (n = 1212) and GTeX (n = 179) gene expression data (RNASeq2GeneNorm). p value was calculated with Wilcoxon rank sum test. C Kaplan–Meier plots of relapse-free survival (RFS) probability of BC patients stratified by high or low KHDRBS1 expression levels. D GSEA of DNA-repair gene signatures in IMEC-WT versus M2 (n =3). E Scheme showing MYC and H3K4me3 PCR amplicons localization (red box) on IMEC-WT and M2 cells and layered H3K27ac signals on KHDRBS1 (SAM68) promoter from ENCODE. Chromatin state was assessed by ChromHMM from ENCODE. MYC-MAX binding on multiple cell lines was assessed by ChIP-seq from ENCODE. F ChIP-qPCR estimating MYC binding at SAM68 promoter in IMEC-WT and M2 cells. Data are mean ± SEM (n = 3). G qRT-PCR analysis of SAM68 gene expression in IMEC-WT and M2 cells. Data are mean ± SEM (n = 3). H ChIP-qPCR of H3K4me3 deposition at KHDRBS1 (SAM68) promoter in IMEC-WT and M2 cells. Data are mean ± SEM (n = 3).
Fig. 2
Fig. 2. Sam68 is a marker of poor prognosis in breast cancer.
A Kaplan–Meier plots of distant relapse-free survival (DRFS) of BC patients stratified by high or low Sam68 protein expression levels. Patients were categorized according to all molecular subtypes (n = 211) and Luminal-A (n = 91), Luminal-B (n = 61), HER2+ (n = 27), TNBC (n = 32), HER2+ + TNBC (n = 59) BCs. B Box plot representing the distribution of log2 gene expression of KHDRBS1 retrieved from TCGA BRCA gene expression data (RNASeq2GeneNorm). p value was calculated with Wilcoxon rank sum test. The indicated statistics refer to each molecular subtype versus basal subtypes. *p value ≤ 0.05; **p value ≤ 0.01; ****p value ≤ 0.0001. C ChIP-qPCR estimating MYC and MAX binding at SAM68 promoter in BCSphCs (#4 and #15). Data are mean ± SEM of two independent experiment for each BCSphCs. D Expression of Myc (green color) and Sam68 (red color) on paraffin-embedded sections on parental BC and corresponding PDX tissue. Nuclei were counterstained with Toto-3 (blue color). Scale bar represents 40 µm. E Relative mRNA expression levels of MYC and KHDRBS1 on BCSphCs (#4, #13, and #21) expressing a MycER fusion protein induced by 50 nM of OHT. Data are represented as fold mRNA level changes of OHT-treated cells over vehicle. Data are represented as mean ± SD of three independent experiments. *p value ≤ 0.05; **p value ≤ 0.01. F Cell proliferation analysis of ER+ (MCF7), TNBC (BT549), TNBC BRCAmut (HCC1937) BC cell lines and BCSphCs (#1, #4, #13, and #21) transduced with doxycyclin-inducible non-targeting (nt) and short hairpin Sam68 (shSam68). Data are represented as fold variation of shSam68 over scr. ns not significant; **p value ≤ 0.01. G Size of tumors generated by orthotopic injection of ER+ (MCF7), TNBC (BT549), TNBC BRCAmut (HCC1937) BC cell lines and BCSphCs (#4, #13) in immunocompromised mice (NOD/SCID) at the indicated time points. Data are expressed as mean ± SD (n = 5 mice per group). ns not significant, ***p value ≤ 0.001.
Fig. 3
Fig. 3. Breast cancer sphere cells are chemoresistant and show activation of the HR pathway.
A MYC binding on DNA-damage related genes transcription start sites (TSS) on IMEC-WT and M2 breast cells. B Representative immunofluorescence analysis of Rad51 foci formation in ER+ (MCF7), TNBC (BT549), TNBC BRCAmut (HCC1937) BC established cell lines and BCSphCs (#4) untreated (UT) and after 6 h of 8 Gy single dose γ-irradiation (IR). Nuclei were counterstained by Toto-3 (blue). Scale bar represents 10 µm. C Waterfall plot analysis of doxorubicin (DOX, 200 nM, left panel), paclitaxel (PTX, 10 nM, middle panel) and carboplatin (CARB, 100 µM, left panel) response at 72 h in ER+ and TNBC BC established cell lines and BCSphCs. D Response rate distribution to chemotherapy for ER+ and TNBC BC established cell lines and BCSphCs treated as in (C). Middle line shows the median value of response per group, while single points represent the average value of BC cell response to DOX, PTX and CARB. Data are mean of three independent experiments. Statistical analysis was performed by using Kruskal–Wallis test. Ns not significant, *p value ≤ 0.05; **p value ≤ 0.01. E Immunoblot analysis of PARP and Sam68 (input) and after immunoprecipitation (IP) with Sam68 antibody in BCSphCs (#15) treated for 4 h with vehicle, doxorubicin (DOX), paclitaxel (PTX) and carboplatin (CARB). Lamin-B was used as loading control. F Immunoblot analysis of nuclear PAR, PARP, and Sam68 in scramble (scr) and short hairpin Sam68 (shSam68) ER+ (MCF7), TNBC (BT549), and TNBC BRCAmut (HCC1937) BC cell lines and BCSphCs (#4) treated with vehicle, doxorubicin (DOX), paclitaxel (PTX) and carboplatin (CARB) for 4 h. H3 was used as loading control. G Cell proliferation analysis of ER+ (MCF7), TNBC (BT549), and TNBC BRCAmut (HCC1937) BC cell lines and BCSphCs (#1, #4, #13, #21) transduced with scramble and short hairpin Sam68 (shSam68) treated with vehicle, doxorubicin (DOX), paclitaxel (PTX) and carboplatin (CARB) for 72 h. Data are represented as fold variation of shSam68 over scramble. Data are mean ± SD of three independent experiments. ns not significant; *p value ≤ 0.05; **p value ≤ 0.01. H, I Relative mRNA expression levels of RAD51 (H) and MYC (I) on scramble (scr) and short hairpin Sam68 (shSam68) ER+ (MCF7), TNBC (BT549), and TNBC BRCAmut (HCC1937) BC cell lines and BCSphCs (#12 and #13) treated with vehicle, doxorubicin (DOX), paclitaxel (PTX), and carboplatin (CARB) for 24 h. Data are represented as fold mRNA level changes of treated scr and shSam68 cells over vehicle. Data are represented as mean ± SD of three independent experiments. Ns not significant, *p value ≤ 0.05; **p value ≤ 0.01; ***p value ≤ 0.001.
Fig. 4
Fig. 4. Combined inhibition of Sam68 and Rad51 counteracts the growth of breast cancer sphere cells.
A Schematic model of DNA-repair signaling pathways mediating the resistance of BC stem-like cells to chemotherapy. B Workflow of purification of sphere cells from serially transplanted BC PDX and their use for in vitro and in vivo drug toxicity testing. C Size of tumors generated by orthotopic injection of scramble (scr) and short hairpin Sam68 (shSam68) BCSphCs treated with vehicle (veh) and BO2. Arrows indicate the start and the end of treatment. Data are expressed as mean of tumors generated by the injection of BCSphCs (#4, #13, and #21) ± SEM (n = 5 mice per group). D Size of tumors generated by orthotopic injection of scramble (scr) and short hairpin Sam68 (shSam68) BCSphCs (#4, #13, #21) treated with vehicle, olaparib, BO2, cisplatin and olaparib plus BO2 and olaparib plus cisplatin and BO2. Arrows indicate the beginning and the end of treatment. Data are expressed as mean of tumors generated by the injection of BCSphCs (#4, #13, and #21) ± SEM (n = 5 mice per group). ****p value ≤ 0.0001. E Immunoblot analysis of Rad51 in BCSphCs (#15) treated with dinaciclib for 24 h at the indicated concentration. Β-actin was used as loading control. F Cell viability percentage of scramble (scr) and short hairpin Sam68 (shSam68) BCSphCs (#4, #13, #15, and #21) treated with vehicle and dinaciclib (10 nM) for 6 days. Data are represented as mean ± SEM (n = 2). *p value ≤ 0.05; ***p value ≤ 0.001. G Representative images (left panel) and quantification of area (right panel) of BC sphere cells (#21), transduced with scramble (scr) and short hairpin Sam68 (shSam68) lentiviral vectors, treated with vehicle and dinaciclib for 6 days. Data are represented as mean ± SEM (n = 3). Ns not significant, **p value ≤ 0.01; ***p value ≤ 0.001. Scale bar represents 100 µm. H Size of tumors generated by orthotopic injection of scramble (scr) and short hairpin Sam68 (shSam68) BCSphCs treated with vehicle (veh) and dinaciclib (din). Arrows indicate the start and the end of treatment. Data are expressed as mean of tumors generated by the injection of BCSphCs (#4, #7, #13) ± SEM (n = 5 mice per group). ****p value ≤ 0.0001. I Cell viability percentage of BCSphCs (#4, #13, #14, #15, #21) treated with vehicle, olaparib and dinaciclib, alone or in combination, at the indicated concentrations for 6 days. Data are represented as mean ± SD (n = 3). J Synergy plot representing the combination index (CI), computed in CompuSyn by using Chou-Talalay method, for each olaparib and dinaciclib dose pair, calculated from cell viability data of BCSphCs (#13). K Size of tumors generated by orthotopic injection of BCSphCs treated with vehicle, olaparib, dinaciclib and olaparib plus dinaciclib. Arrows indicate the start and the end of treatment. Data are expressed as mean of tumors generated with BCSphCs (#4, #7, #13) ± SEM (n = 5 mice per group). ***p value ≤ 0.001.
Fig. 5
Fig. 5. Myc, Sam68 and Rad51 characterize breast cancers with poor clinical outcome.
A Cell viability percentage of scramble (scr) and short hairpin Sam68 (shSam68) ER+R (MCF7) BC cell line treated with vehicle and dinaciclib (10 nM) for 6 days. Data are represented as mean ± SEM (n = 4). *p value ≤ 0.05; **p value ≤ 0.01; ***p value ≤ 0.001. B Relative mRNA expression levels of RAD51 and MYC on scramble (scr) and short hairpin Sam68 (shSam68) ER+R (MCF7) BC cells treated with vehicle and dinaciclib for 6 days. Data are represented as fold mRNA level changes of treated scr and shSam68 over vehicle (n = 3). C Cell viability percentage in ER+R (MCF7) BC cells treated with vehicle, olaparib and dinaciclib, alone or in combination, at the indicated concentrations for 6 days. Data are represented as mean ± SD (n = 3). D Kaplan–Meier plots of relapse-free survival (RFS) probability of BC patients of all molecular subtypes stratified by high or low MYC, KHDRBS1, and RAD51 expression levels. E Schematic model showing the persistence of a BC stem-like population, characterized by high expression levels of MYC, SAM68, and RAD51, following standard anticancer therapies.

References

    1. Harbeck N, Penault-Llorca F, Cortes J, Gnant M, Houssami N, Poortmans P, et al. Breast cancer. Nat Rev Dis Prim. 2019;5:66. doi: 10.1038/s41572-019-0111-2. - DOI - PubMed
    1. Sung H, Ferlay J, Siegel RL, Laversanne M, Soerjomataram I, Jemal A, et al. Global Cancer Statistics 2020: GLOBOCAN Estimates of Incidence and Mortality Worldwide for 36 Cancers in 185 Countries. CA Cancer J Clin. 2021;71:209–49. doi: 10.3322/caac.21660. - DOI - PubMed
    1. Polyak K, Metzger, Filho O. SnapShot: breast cancer. Cancer Cell. 2012;22:562–e1. doi: 10.1016/j.ccr.2012.06.021. - DOI - PubMed
    1. Siegel RL, Miller KD, Jemal A. Cancer statistics, 2020. CA Cancer J Clin. 2020;70:7–30. doi: 10.3322/caac.21590. - DOI - PubMed
    1. Turdo A, Veschi V, Gaggianesi M, Chinnici A, Bianca P, Todaro M, et al. Meeting the challenge of targeting cancer stem cells. Front Cell Dev Biol. 2019;7:16. doi: 10.3389/fcell.2019.00016. - DOI - PMC - PubMed

MeSH terms