. 2022 Feb;54(2):194-205.
doi: 10.1038/s12276-022-00735-x. Epub 2022 Feb 25.

The m6A reader IGF2BP3 promotes acute myeloid leukemia progression by enhancing RCC2 stability

Affiliations

The m6A reader IGF2BP3 promotes acute myeloid leukemia progression by enhancing RCC2 stability

Nan Zhang et al. Exp Mol Med. 2022 Feb.

Abstract

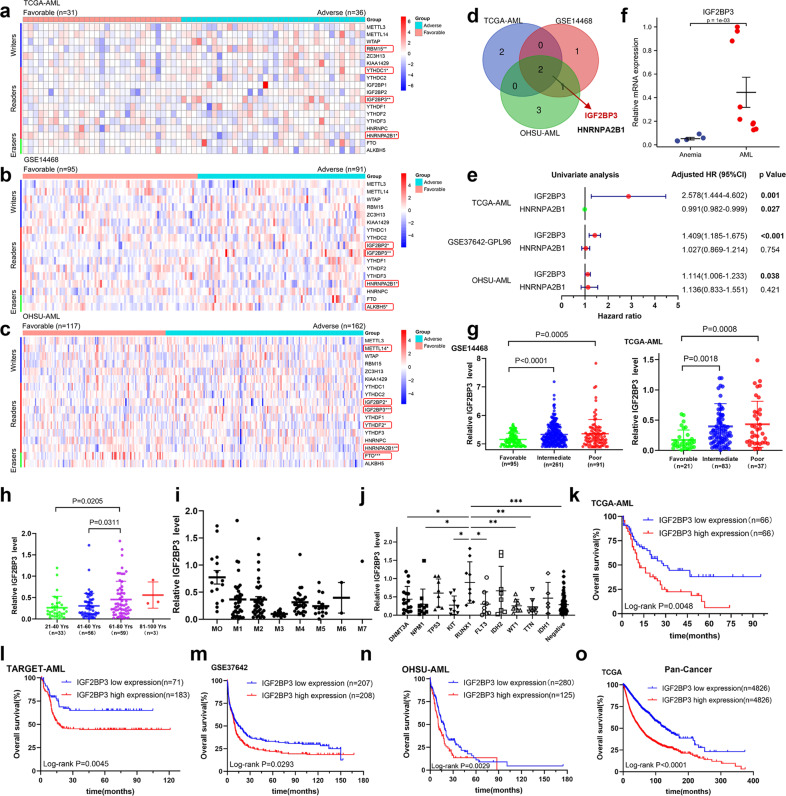
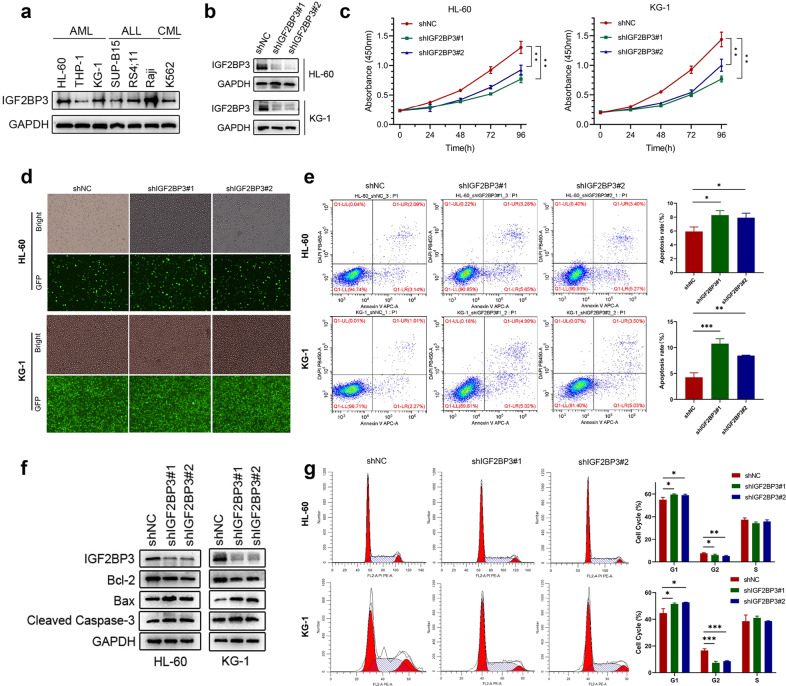
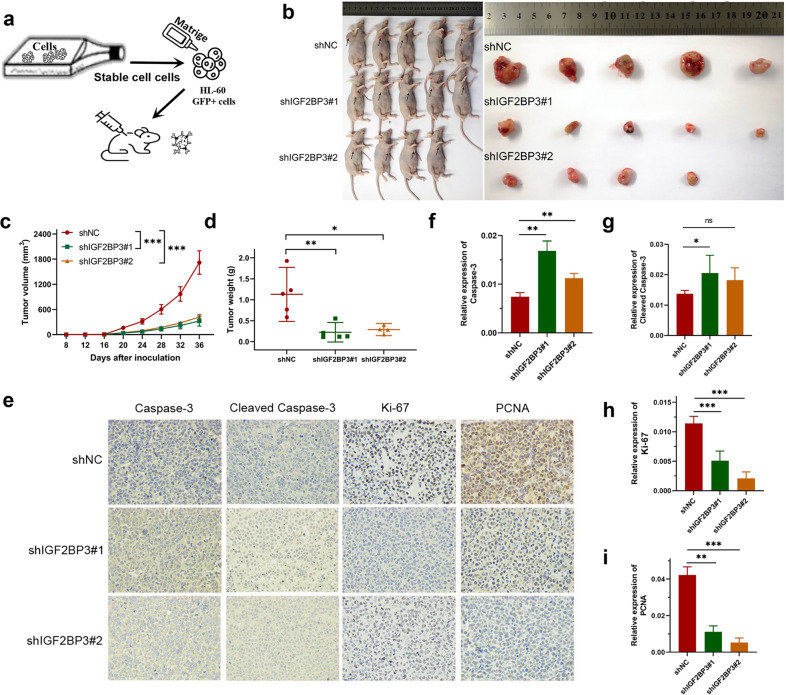
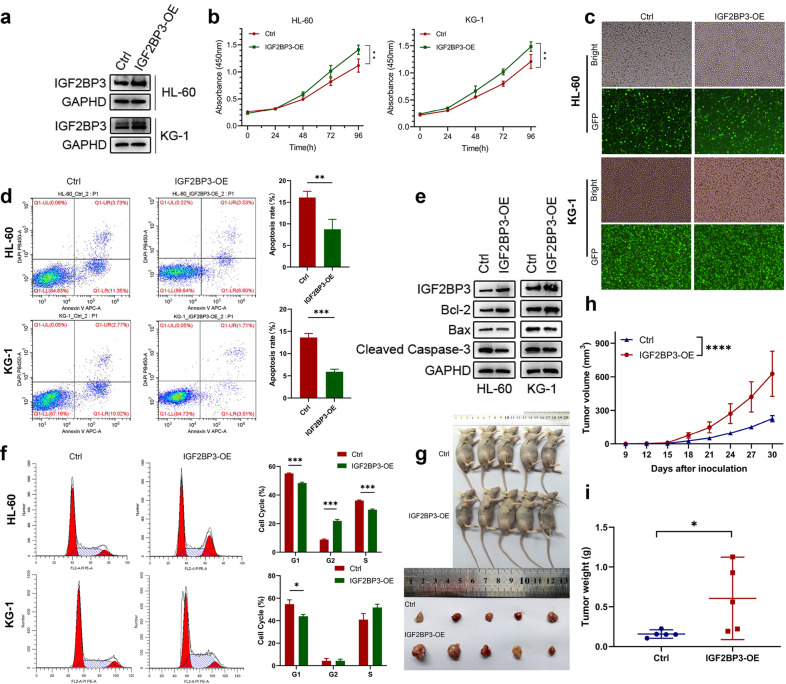
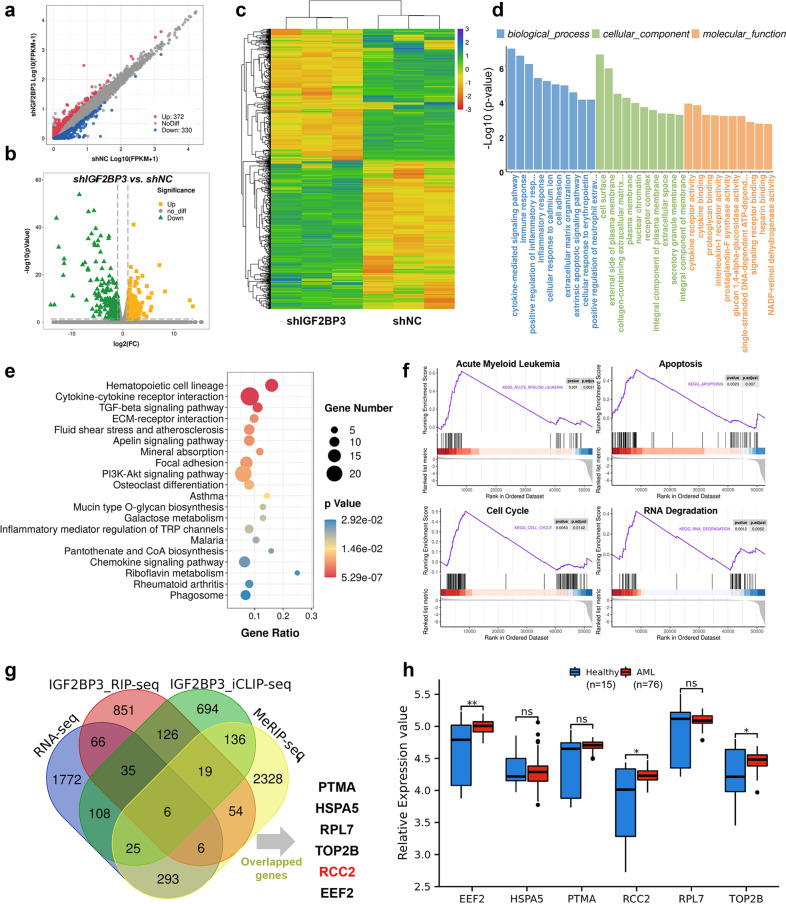
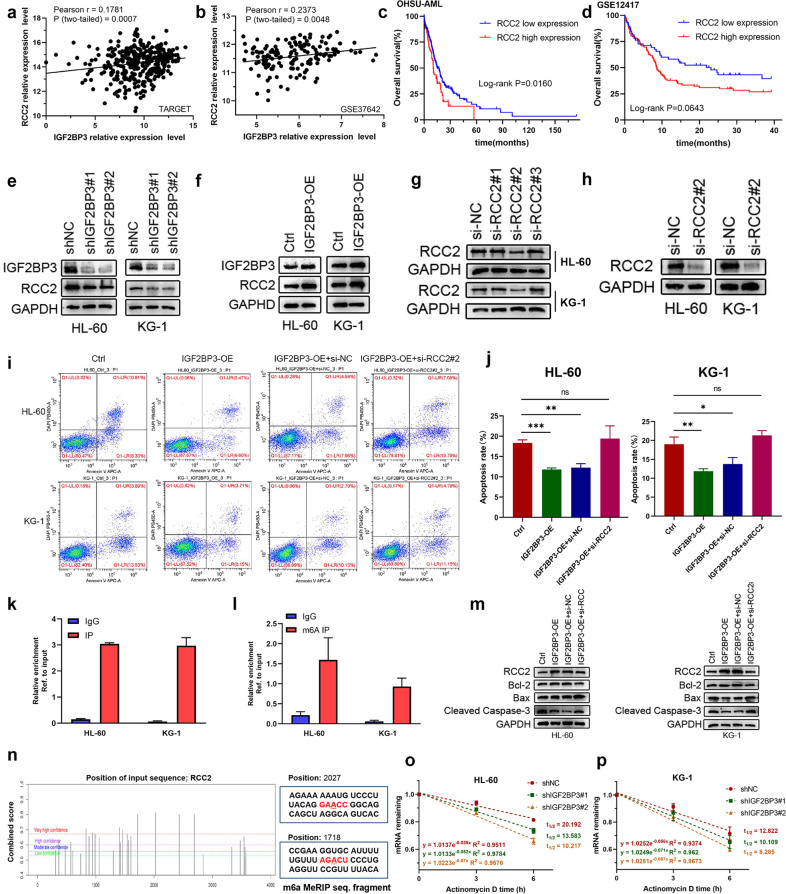
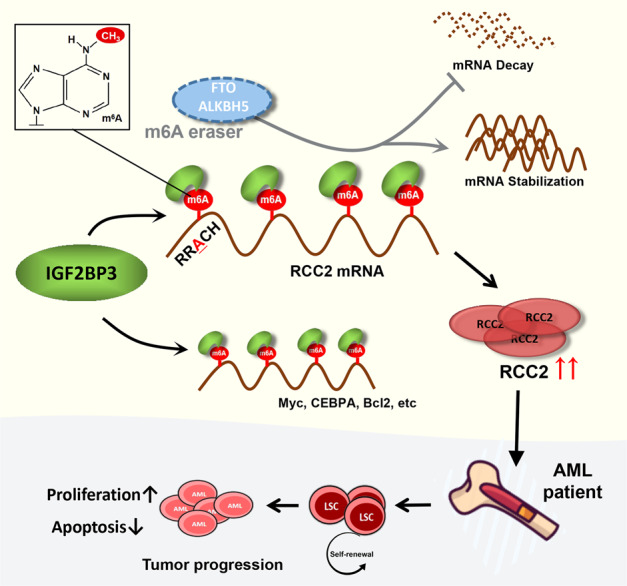
N6-methyladenosine (m6A) is the most abundant posttranscriptional modification of mRNA in eukaryotes. Recent evidence suggests that dysregulated m6A-associated proteins and m6A modifications play a pivotal role in the initiation and progression of diseases such as cancer. Here, we identified that IGF2BP3 is specifically overexpressed in acute myeloid leukemia (AML), a subtype of leukemia associated with poor prognosis and high genetic risk. IGF2BP3 is required for maintaining AML cell survival in an m6A-dependent manner, and knockdown of IGF2BP3 dramatically suppresses the apoptosis, reduces the proliferation, and impairs the leukemic capacity of AML cells in vitro and in vivo. Mechanistically, IGF2BP3 interacts with RCC2 mRNA and stabilizes the expression of m6A-modified RNA. Thus, we provided compelling evidence demonstrating that the m6A reader IGF2BP3 contributes to tumorigenesis and poor prognosis in AML and can serve as a target for the development of cancer therapeutics.


Conflict of interest statement

The authors declare no competing interests.

Figures

Fig. 1
Fig. 1. High-throughput library screening identifies IGF2BP3 as a core m6A regulator in AML.
ac Heatmap representation of transcriptome array data for the expression levels of m6A-associated regulators in AML from the TCGA-AML, GSE14468, and OHSU-AML datasets. d Both IGF2BP3 and HNRNPA2B1 are significantly differentially regulated m6A functional effectors in different datasets. e A forest plot showing the HR and 95% CI for the association between IGF2BP3 and HNRNPA2B1 candidate genes and overall survival times in patients with AML calculated by univariate Cox regression analysis. f Real-time PCR was used to determine the expression of IGF2BP3 in bone marrow specimens from patients with AML. g The aberrantly high expression of IGF2BP3 in AML patients was significantly correlated with more unfavorable clinical characteristics on measures such as cytogenetic risk stratification. h Expression of IGF2BP3 mRNA with increasing age. i, j IGF2BP3 expression was lowest in patients with the AML-M3 subtype (French-American-British classification) and higher in patients with RUNX1 mutation. kn Kaplan–Meier survival analysis showed that AML patients with high IGF2BP3 expression exhibited worse overall survival, based on analysis of TCGA, TARGET, GSE37642, and OHSU-AML datasets. o Pancancer analysis of 9652 tumor patients in the TCGA cohort showed that high expression of IGF2BP3 was strongly associated with poor prognosis. *P < 0.05; **P < 0.01; ***P < 0.001.
Fig. 2
Fig. 2. Knockdown of IGF2BP3 significantly inhibits AML progression in vitro.
a The protein expression level of IGF2BP3 in various hematologic tumor cell lines was measured by western blotting. b The knockdown efficiency of IGF2BP3 shRNAs (shIGF2BP3#1 and shIGF2BP3#2) delivered via lentiviral vectors in HL-60 and KG-1 cell lines was confirmed by western blotting. GAPDH was used as the internal reference. c Cell proliferation was measured by a CCK-8 assay at different time points (0, 24, 48, 72, and 96 h) in HL-60 and KG-1 cells after shRNA transduction. d The transduction efficiency after puromycin selection was evaluated by GFP fluorescence imaging in both cell lines. e Flow cytometry (representative images are presented) was used to confirm the induction of apoptosis by IGF2BP3 knockdown. f Western blotting was used to explore apoptosis-related protein levels. The levels of cleaved caspase-3 and Bax were increased but the level of Bcl-2 was decreased under shIGF2BP3 treatment compared with control treatment. g Flow cytometry (representative images are presented) was used to analyze the cell cycle distribution. *P < 0.05; **P < 0.01; ***P < 0.001.
Fig. 3
Fig. 3. Knockdown of IGF2BP3 decreases AML cell viability in vivo.
a Schematic diagram showing the schedule of nude mouse xenograft assays. b Subcutaneous tumors were observed at 36 days in two different groups (the black arrows indicate xenograft tumors). c The xenograft growth curves for the shIGF2BP3#1, shIGF2BP3#2, and shNC groups were plotted by measuring the tumor size (width2 × length × π/6) with a Vernier caliper every four days. d Nude mice were sacrificed, and xenografts were harvested and weighed. ei Representative images of immunohistochemical staining for Caspase-3, cleaved Caspase-3, Ki-67, and PCNA in tumors excised from xenograft model mice. *P < 0.05; **P < 0.01; ***P < 0.001; ns, not significant.
Fig. 4
Fig. 4. Overexpression of IGF2BP3 promoted the proliferation and tumorigenesis of AML cells.
a IGF2BP3 overexpression with lentiviral constructs in HL-60 and KG-1 cell lines was confirmed by western blotting. GAPDH was used as the internal reference. b Cell proliferation was measured by a CCK-8 assay at different time points (0, 24, 48, 72, and 96 h) in HL-60 and KG-1 cells. c The transduction efficiency after puromycin selection was evaluated by GFP fluorescence imaging in both cell lines. d Flow cytometry (representative images are presented) was used to confirm the induction of apoptosis by overexpression of IGF2BP3. e Western blotting was used to explore apoptosis-related protein levels. f Flow cytometry (representative images are presented) was used to analyze the cell cycle distribution. g Subcutaneous tumors were observed at 30 days in two different groups (the black arrows indicate xenograft tumors), and the excised tumors were photographed and weighed. h The xenograft growth curves for the IGF2BP3-OE and Ctrl groups were plotted by measuring the tumor size with a Vernier caliper every three days. i Nude mice were sacrificed, and xenografts were harvested and weighed. *P < 0.05; **P < 0.01; ***P < 0.001; ****P < 0.0001.
Fig. 5
Fig. 5. Identification of the potential IGF2BP3 targets in AML.
a Scatter plot of differentially expressed genes. The values on the X and Y axes in the scatter plot are the average FPKM values of each group (log10 scale). The dots above the top line (372 red dots, upregulated in the shIGF2BP3 group) or below the bottom line (330 blue dots, upregulated in the shNC group) indicate genes with a change in expression of more than 2-fold between the two comparison groups. b Volcano plot of differentially expressed genes. The values on the X and Y axes in the volcano plot are the fold change (log2 transformed) values and P values (−log10 transformed) between the two groups, respectively. The green/yellow dots indicate differentially expressed genes with a statistically significant change in expression of greater than 2-fold. c Heatmap generated from the RNA-seq data showing the representative genes after IGF2BP3 knockdown. d, e Gene Ontology (GO) and Kyoto Encyclopedia of Genes and Genomes (KEGG) analyses revealed the potential roles of differentially expressed genes following IGF2BP3 knockdown in HL-60 cells. f Representative GSEA results showed that apoptosis, the cell cycle, and RNA degradation were closely correlated with IGF2BP3 expression. g Venn diagram showing that 6 candidate genes—PTMA, HSPA5, RPL7, TOP2B, RCC2, and EEF2—overlapped with the predicted direct targets of IGF2BP3. h The expression differences in candidate genes were analyzed from GSE12662, and EEF2, RCC2, and TOP2B were verified to be highly expressed. *P < 0.05; **P < 0.01; ***P < 0.001.
Fig. 6
Fig. 6. IGF2BP3 regulates RCC2 expression in an m6A-dependent manner.
a, b RCC2 expression was positively correlated with IGF2BP3 expression in the GSE37642 and TARGET datasets. c, d Kaplan–Meier survival analysis revealed that high RCC2 expression indicated a poor prognosis in AML patients. e, f Protein expression level of RCC2 following knockdown or overexpression of IGF2BP3 in HL-60 and KG-1 cells. g, h The interference efficiency of the siRNAs was evaluated to confirm the feasibility of the siRNAs, and si-RCC2#2 was found to be effective in reducing RCC2 expression. i, j Apoptosis was detected by flow cytometry. RCC2 deficiency promoted the induction of apoptosis by IGF2BP3 overexpression. k The mRNA of RCC2 was enriched by the anti-IGF2BP3 antibody compared to IgG in the HL-60 and KG-1 cell lines. l The mRNA of RCC2 was enriched by the m6A-specific antibody compared to IgG in the HL-60 and KG-1 cell lines. m Overexpression of IGF2BP3 restored the increases in the levels of proapoptotic proteins (Bax and cleaved Caspase 3) caused by silencing RCC2, and the level of the antiapoptotic protein Bcl-2 was slightly decreased. n The potential m6A sites in RCC2 were predicted by SRAMP. The different colored lines indicate different confidence levels. o, p Loss of IGF2BP3 reduced RCC2 stability in HL-60 and KG-1 cells. Transfected cells were treated with 5 µg/ml actinomycin D for 0 h, 3 h, or 6 hours prior to RNA extraction. *P < 0.05; **P < 0.01; ***P < 0.001.
Fig. 7
Fig. 7. Schematic diagram showing the mechanism by which IGF2BP3 contributes to tumorigenesis and poor prognosis in AML through m6A RNA methylation.
Model showing mechanism by which pro-oncogenic trigger may impair the cross-talk among m6A reader IGF2BP3, stabilize m6A-labeled genes and promote the abnormal accumulation of carcinogens (such as Myc, CEBPA, Bcl2, RCC2, etc.), thereby regulating the survival of leukemia cells and leading to AML progression.

Similar articles

Cited by

References

    1. Westermann, J. and Bullinger, L. Precision medicine in myeloid malignancies. Semin. Cancer Biol. 10.1016/j.semcancer.2021.03.034 (2021). - PubMed
    1. Wouters BJ, Delwel R. Epigenetics and approaches to targeted epigenetic therapy in acute myeloid leukemia. Blood. 2016;127:42–52. doi: 10.1182/blood-2015-07-604512. - DOI - PubMed
    1. Zhang N, Chen Y, Shen Y, Lou S, Deng J. Comprehensive analysis the potential biomarkers for the high-risk of childhood acute myeloid leukemia based on a competing endogenous RNA network. Blood Cells Mol. Dis. 2019;79:102352. doi: 10.1016/j.bcmd.2019.102352. - DOI - PubMed
    1. Zhang N, et al. Clusterization in acute myeloid leukemia based on prognostic alternative splicing signature to reveal the clinical characteristics in the bone marrow microenvironment. Cell Biosci. 2020;10:118. doi: 10.1186/s13578-020-00481-5. - DOI - PMC - PubMed
    1. Zhang, N. et al. Overexpression of annexin A5 might guide the gemtuzumab ozogamicin treatment choice in patients with pediatric acute myeloid leukemia. Ther. Adv. Med. Oncol. 10.1177/1758835920927635 (2020). - PMC - PubMed

Publication types