. 2022 Apr;34(16):e2201095.
doi: 10.1002/adma.202201095. Epub 2022 Mar 10.

Anionic Lipid Nanoparticles Preferentially Deliver mRNA to the Hepatic Reticuloendothelial System

Affiliations

Anionic Lipid Nanoparticles Preferentially Deliver mRNA to the Hepatic Reticuloendothelial System

Roy Pattipeiluhu et al. Adv Mater. 2022 Apr.

Abstract

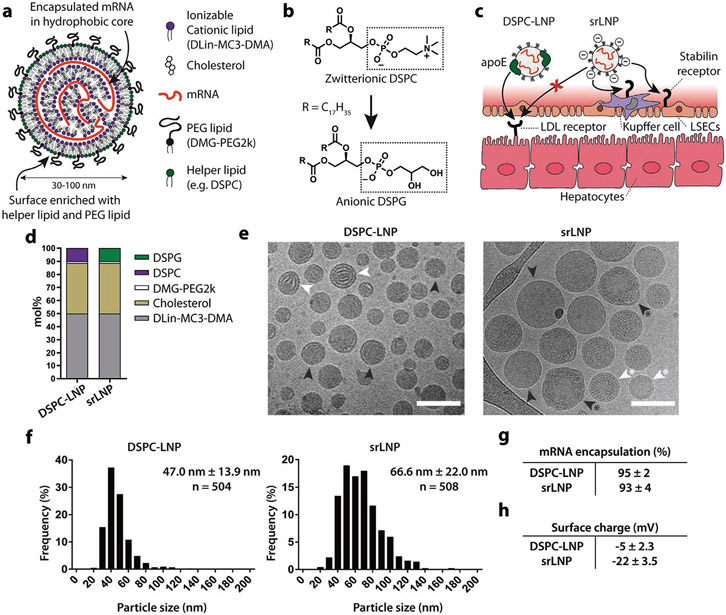
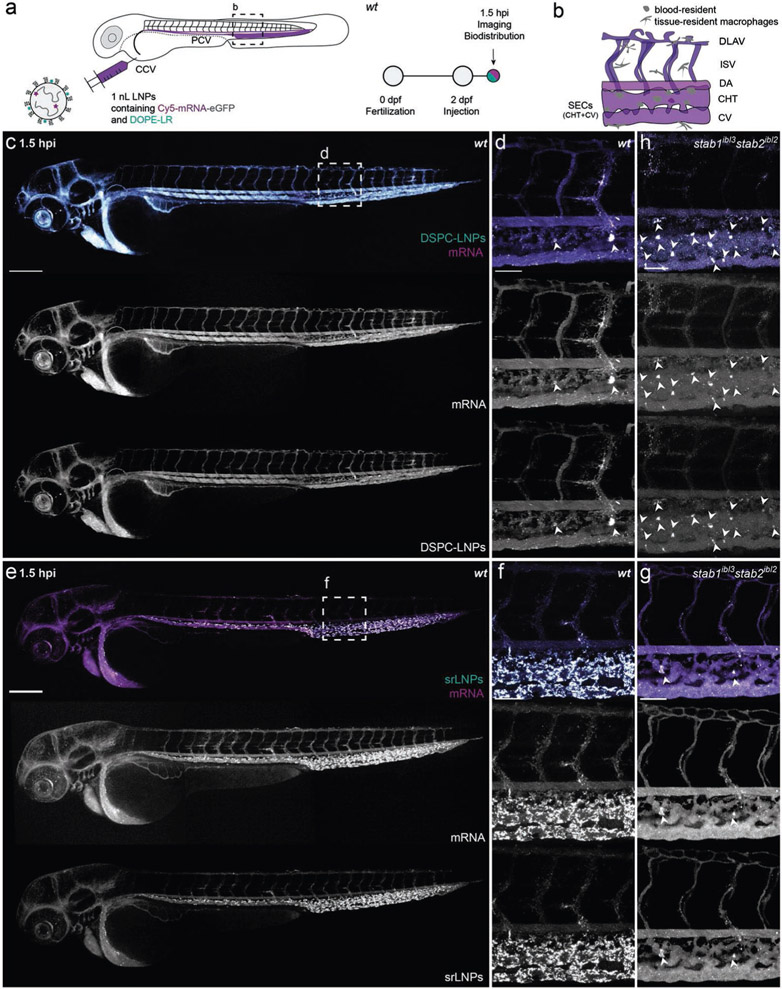
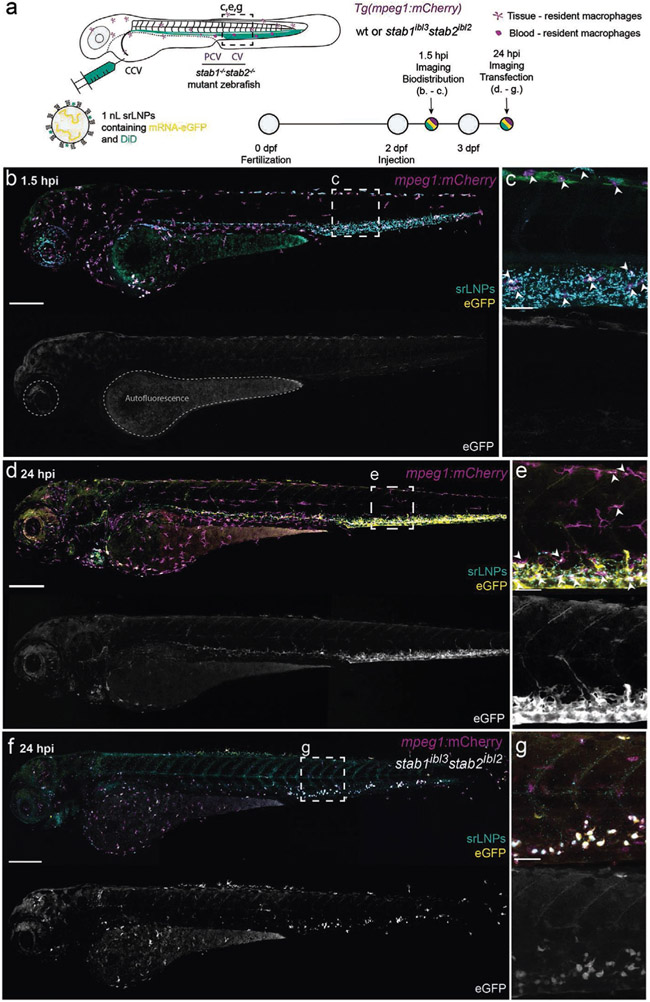
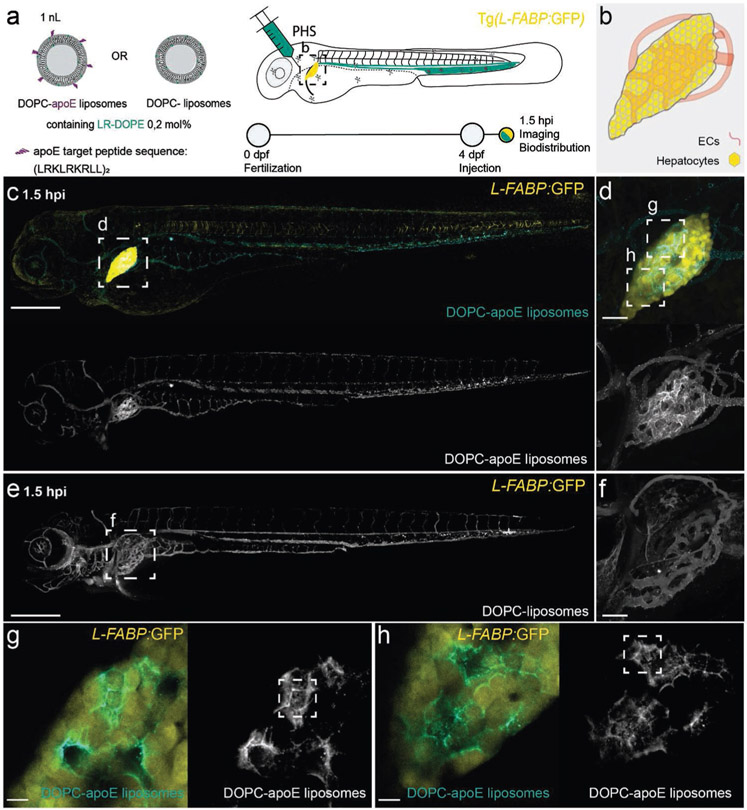
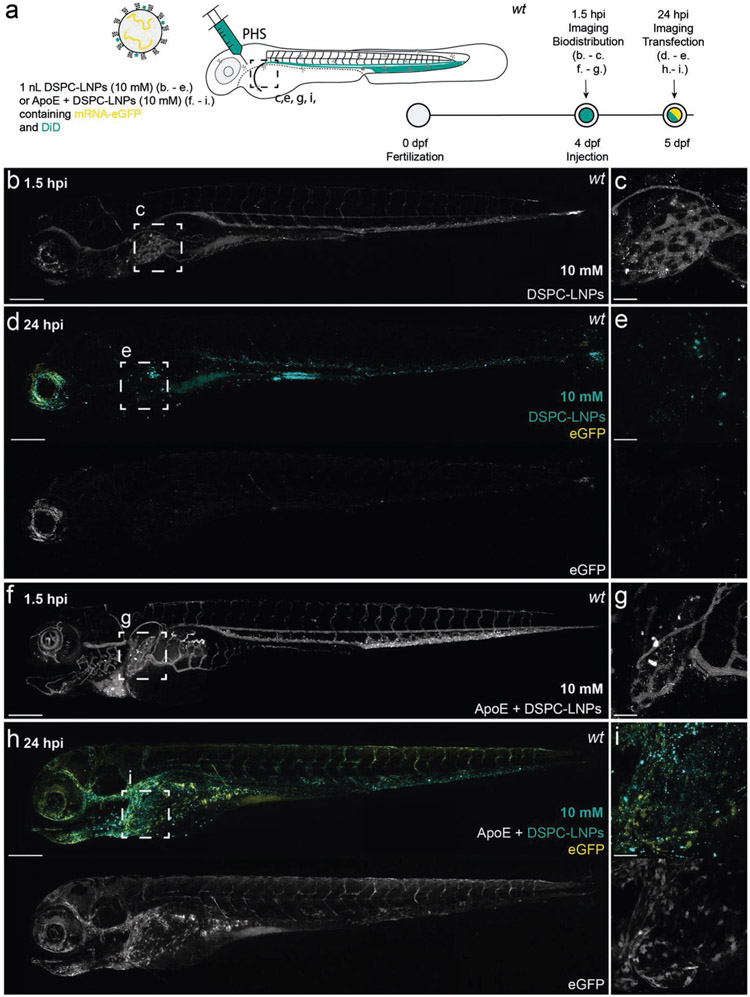
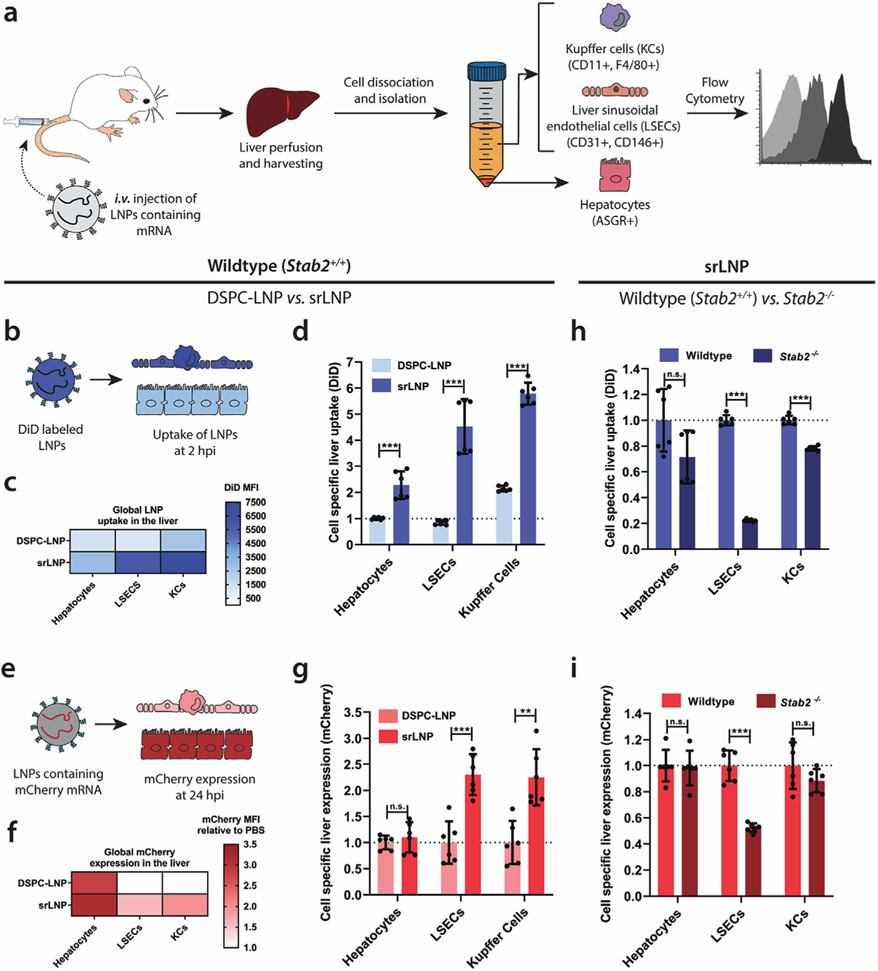
Lipid nanoparticles (LNPs) are the leading nonviral technologies for the delivery of exogenous RNA to target cells in vivo. As systemic delivery platforms, these technologies are exemplified by Onpattro, an approved LNP-based RNA interference therapy, administered intravenously and targeted to parenchymal liver cells. The discovery of systemically administered LNP technologies capable of preferential RNA delivery beyond hepatocytes has, however, proven more challenging. Here, preceded by comprehensive mechanistic understanding of in vivo nanoparticle biodistribution and bodily clearance, an LNP-based messenger RNA (mRNA) delivery platform is rationally designed to preferentially target the hepatic reticuloendothelial system (RES). Evaluated in embryonic zebrafish, validated in mice, and directly compared to LNP-mRNA systems based on the lipid composition of Onpattro, RES-targeted LNPs significantly enhance mRNA expression both globally within the liver and specifically within hepatic RES cell types. Hepatic RES targeting requires just a single lipid change within the formulation of Onpattro to switch LNP surface charge from neutral to anionic. This technology not only provides new opportunities to treat liver-specific and systemic diseases in which RES cell types play a key role but, more importantly, exemplifies that rational design of advanced RNA therapies must be preceded by a robust understanding of the dominant nano-biointeractions involved.

Keywords: embryonic zebrafish; lipid nanoparticles; mRNA delivery; reticuloendothelial system; stabilin-2.


Conflict of interest statement

Conflict of Interest

P.R.C. is a co-founder of Acuitas Therapeutics and Precision Nanosystems, former Scientific Director and CEO of the NMIN, and co-founder and Board Chair of NanoVation Therapeutics. D.W. is the co-founder and CEO of NanoVation Therapeutics. F.C. is the Director of Science at NanoVation Therapeutics (UK Hub).

Figures

Figure 1.
Figure 1.
Design and characterization of srLNPs. a) Schematic of the structural organization of a LNP containing mRNA, as described previously.[44] Helper phospholipids (typically incorporated at 10 mol%) are enriched at the LNP surface. b,c) Within the liver sinusoids, switching of the helper phospholipid from zwitterionic DSPC (as in Onpattro) to anionic DSPG created anionic srLNPs that are directed to the hepatic RES, via stabilin-receptor-mediated recognition and uptake in LSECs. srLNP uptake within hepatic RES cells is further enhanced by the inhibition of apoE–LDLr interactions mediated by anionic phospholipids (e.g., DSPG).[45] The mechanism(s) of recognition and uptake of srLNPs by blood resident macrophages (i.e., KCs) are not fully known. d) Lipid composition of DSPC–LNPs (i.e., Onpattro) and srLNPs. e) Cryo-EM images of DSPC–LNPs and srLNPs (entrapping capped mRNA–eCFP) showing solid lipid nanoparticle structures. Scale bars: 100 nm. Internal structures indicated with arrows: lamellar (white), amorphous (black), polymorphous (black*), and unilamellar (white*). f) Size distribution of DSPC–LNPs and srLNPs, as determined by cryo-EM. The values derived from the frequency distribution graphs represent the mean ± standard deviation (s.d.). g) mRNA encapsulation efficiency within DSPC–LNPs and srLNPs, as determined by RiboGreen assay. h) Surface charge of DSPC–LNPs and srLNPs, as determined by zeta potential measurements. See Table S1 in the Supporting Information for full biophysical characterization of all formulations used in this study.
Figure 2.
Figure 2.
Biodistribution of DSPC–LNPs and srLNPs in two-day old embryonic zebrafish at 1.5 hpi. a) Schematic showing the site of LNP injection (i.v.) within embryonic zebrafish (2 dpf) and imaging timeframe. LNPs contained DOPE-LR (cyan, 0.2 mol%) as fluorescent lipid probe and Cy5-labeled eGFP mRNA (magenta) as fluorescent mRNA probe. Injected dose: ≈10 × 10−3 m lipid, ≈0.2 mg kg−1 mRNA. Injection volume: 1 nL. Major venous blood vessels: CCV: common cardinal vein; PCV: posterior cardinal vein. b) Tissue level schematic of a dorsal region of the embryo containing scavenging cell types (i.e., SECs and blood resident macrophages). Blood vessels: DA: dorsal aorta, CHT: caudal hematopoietic tissue; CV: caudal vein; ISV: intersegmental vessel; DLAV: dorsal longitudinal anastomotic vessel. c,d) Whole embryo (10× magnification) and tissue level (40× magnification) views of DSPC–LNP biodistribution within wild-type (AB/TL) embryonic zebrafish (2 dpf) at 1.5 hpi. DSPC–LNPs were mostly freely circulating, confined to, and distributed throughout, the vasculature of the embryo. Low level phagocytotic uptake within blood resident macrophages is highlighted with white arrowheads. e,f) Whole embryo (10× magnification) and tissue level (40× magnification) views of srLNP biodistribution within wild-type (AB/TL) embryonic zebrafish (2 dpf) at 1.5 hpi. srLNPs were mainly associated with SECs within the PCV, CHT, and CV of the embryo and were largely removed from circulation at 1.5 hpi. Phagocytotic uptake of both DSPC–LNPs and srLNPs within blood resident macrophages at 1.5 hpi was confirmed by analogous LNP injections in transgenic mpeg:mCherry zebrafish embryos, stably expressing mCherry within all macrophages (see Figure S1 in the Supporting Information). g) Tissue level (40× magnification) view of srLNP biodistribution within stab1−/−/stab2−/− mutant zebrafish embryos[56] at 1.5 hpi. Within stabilin KOs, srLNPs were now mostly freely circulating, with low level phagocytotic uptake within blood resident macrophages highlighted by white arrowheads. h) Tissue level (40× magnification) view of DSPC–LNP biodistribution within stab1−/−/stab2−/− mutant zebrafish embryos[56] at 1.5 hpi. Within stabilin KOs, DSPC–LNPs remain mostly freely circulating, with low level phagocytotic uptake within blood resident macrophages highlighted by white arrowheads. For whole embryo images of LNP biodistribution within stab1−/−/stab2−/− mutant zebrafish embryos[56] at 1.5 hpi, please see Figure S2 in the Supporting Information. Scale bars: 200 μm (whole embryo) and 50 μm (tissue level).
Figure 3.
Figure 3.
srLNP biodistribution, eGFP–mRNA delivery, and eGFP expression within mpeg1:mCherry transgenic zebrafish embryos at 1.5 and 24 hpi. a) Schematic showing the site of srLNP injection (i.v.) within embryonic zebrafish (2 dpf) and imaging timeframe. srLNPs contained DiD (Cy5, 0.1 mol%) as fluorescent lipid probe and unlabeled, eGFP mRNA (capped) payload. Injected dose: ≈10 × 10−3 m lipid, ≈0.2 mg kg−1 mRNA. Injection volume: 1 nL. Transgenic Tg(mpeg1:mCherry) zebrafish embryos stably express mCherry (magenta) within all macrophages. b,c) Whole embryo (10× magnification) and tissue level (40× magnification) views of srLNP biodistribution and eGFP expression within the embryonic zebrafish at 1.5 hpi. At this timepoint, srLNPs were mainly associated with SECs and blood resident macrophages (white arrowheads) within the PCV, CHT, and CV of the embryo and largely removed from circulation. Low-level autofluorescence in the GFP channel is highlighted within the yolk sac and pigment cells of the embryo. d,e) Whole embryo and tissue level views of srLNP biodistribution and eGFP expression within the embryonic zebrafish at 24 hpi. At this timepoint, srLNPs remain associated with SECs and blood resident macrophages (white arrowheads) within the PCV, CHT, and CV of the embryo. However, intense eGFP expression was now observed specifically within the PCV, CHT, and CV confirming successful cytosolic delivery and translation of functional eGFP mRNA within SECs and blood resident macrophages. f,g) Whole embryo and tissue level views of srLNP biodistribution and eGFP expression within stab1−/−/stab2−/− mutant embryos at 24 hpi. In these mutant embryos, eGFP expression was predominantly observed in blood resident macrophages of the CHT, confirming the requirement of stabilin receptors for srLNP-mediated mRNA expression within SECs. Scale bars: 200 μm (whole embryo) and 50 μm (tissue level).
Figure 4.
Figure 4.
Biodistribution of apoE-targeted liposomes in four-day old zebrafish embryos. a) Schematic showing the site of apoE-targeted DOPC or (nontargeted) DOPC liposome injection (i.v.) within 4-day old embryonic zebrafish and imaging timeframe. Liposomes contained 0.2 mol% DOPE–lissamine rhodamine as fluorescent lipid probe (cyan). Injected dose: ≈5 × 10⁻³ m lipid, ≈5 mol% apoE target ligand (amino acid primary sequence: (LRKLRKRLL)2), injection volume: 1 nL. PHS: primary head sinus. Transgenic Tg(L-FABP:eGFP) zebrafish embryos stably express eGFP (yellow) within all hepatocytes. b) Tissue level schematic of the embryonic liver at 4 dpf. c,d) Whole embryo (10× magnification) and tissue (liver) level (40× magnification) view of apoE-targeted DOPC liposome biodistribution within four-day old embryonic zebrafish at 1.5 hpi. At this timepoint, apoE-target DOPC liposomes clearly accumulated within the liver of the embryo. e,f) Whole embryo (10× magnification) and tissue (liver) level (40× magnification) views of DOPC liposome biodistribution within four-day old embryonic zebrafish at 1.5 hpi. At this timepoint, unmodified DOPC liposomes are predominantly freely circulating throughout the vasculature of the zebrafish embryo. g,h) Zoom in regions of liver of apoE-targeted DOPC liposome biodistribution. Stacks of 3 confocal slices (6 μm thickness) show diffuse liposome-associated fluorescence within hepatocytes (i.e., uptake) as well as clear delineation of the characteristic hexagonal morphology of hepatocytes (i.e., stockpiling within the space of Disse)—examples of both phenomena highlighted in white boxes. Scale bars: 200 μm (whole embryo), 50 μm (tissue level), and 10 μm (zoom).
Figure 5.
Figure 5.
DSPC–LNP biodistribution and mRNA expression within, four-day old, wild-type (AB/TL) embryonic zebrafish, with and without preincubation with human apoE. a) Schematic showing the site of DSPC–LNP injection (i.v.) within embryonic zebrafish (4 dpf). DSPC–LNPs (10 × 10−3 m) contained DiD (0.1 mol%) as fluorescent lipid probe and unlabeled, eGFP mRNA (capped) payload after 1 h incubation with/without human apoE. Injection and imaging timeframe. Injection volume: 1 nL. PHS: primary head sinus. b,c) Whole embryo (10× magnification) and tissue level (liver region, 40× magnification) views of DSPC–LNP biodistribution at 1.5 hpi. Injected dose: ≈10 × 10−3 m lipid, ≈0.2 mg kg−1 mRNA. LNPs were mostly freely circulating with no significant accumulation in the liver at 1.5 hpi. Intense fluorescent punctae within the liver region are likely due to macrophage uptake. d,e) Whole embryo (10× magnification) and tissue level (liver region, 40× magnification) views of eGFP expression at 24 hpi. f,g) Whole embryo (10× magnification) and tissue level (liver region, 40× magnification) views of DSPC–LNP biodistribution, following preincubation (1 h) with apoE (5 mg μL−1; 1:1 v/v), at 1.5 hpi. Injected dose: ≈10 × 10−3 m lipid, ≈0.2 mg kg−1 mRNA. LNPs were mostly freely circulating with no significant accumulation in the liver observed at 1.5 hpi. Intense fluorescent punctae within the liver region are likely due to macrophage LNP uptake. h,i) Whole embryo (10× magnification) and tissue level (liver region, 40× magnification) views of eGFP expression at 24 hpi. In this case, a qualitative increase in liver-specific eGFP expression was observed. Scale bars: 200 μm (whole embryo) and 50 μm (tissue level).
Figure 6.
Figure 6.
LNP uptake and functional mRNA delivery within different hepatic cell types following i.v. administration in mice. a) Schematic illustrating the procedure to isolate different hepatic cell types and determine LNP–mRNA targeting and functional mRNA delivery. Following intravenous LNP–mRNA injection (i.v.) the liver was perfused with collagenase IV, hepatic cells were isolated and stained with specific antibodies, and flow cytometry was used to analyze LNP uptake and gene expression. Specific antibody markers used to uniquely identify hepatocytes, LSECs and KCs, respectively, are defined in parentheses. b) For intrahepatic biodistribution studies, LNPs contained DiD (0.5 mol%) as fluorescent lipid probe. Cellular uptake of DSPC–LNP and srLNP was assessed following mouse sacrifice at 2 hpi. Injected dose: 42.75 mg kg−1 total lipid. c) Heatmap of global LNP uptake in the liver determined by absolute DiD fluorescence. srLNP demonstrated significantly enhanced LNP uptake within all hepatic cell types, and significant redirection to hepatic RES compared to DSPC–LNPs. d) Cell-specific liver uptake normalized to DSPC–LNP in liver hepatocytes. e) For gene expression experiments, LNPs contained capped, mCherry–mRNA. Functional mRNA delivery was assessed based on mCherry fluorescence levels following mouse sacrifice at 24 hpi. f) Heatmap of mCherry expression in different liver cell types following functional mRNA delivery using DSPC–LNP and srLNP. Injected dose: 0.25 mg kg−1 mRNA. g) Cell-specific mCherry expression normalized to DSPC–LNP for each cell type. h) Cell-specific liver uptake of srLNP in wild-type and mutant stab2−/− KO mice, normalized to srLNP in wild-type for each cell type. i) Cell-specific liver expression of srLNP in wild-type and mutant stab2−/− KO mice, normalized to srLNP in wild-type for each cell type. In all cases, n = 6; representing 3 separate liver tissue samples from 2 mice sorted into individual cell types. Bars and error bars in (d) and (g) represent mean ± s.d. The data were normalized to the average uptake and expression of DSPC–LNPs within each cell type. Statistical significance was evaluated using a two-tailed unpaired Student’s t-test. n.s. = not significant p > 0.01, * p < 0.01, ** p < 0.01, *** p < 0.001. Exact p values for (d): hepatocytes p = 0.000147, LSECs p = 6.20 × 10⁻⁶, KCs p = 1.65 × 10⁻⁹. Exact p values for (g): hepatocytes p = 0.464, LSECs p = 0.000215, KCs p = 0.00113. Exact p values for (h): hepatocytes p = 0.0531, LSECs p = 5.62 × 10⁻¹³, KCs p = 5.78 × 10⁻⁸. Exact p values for (i): hepatocytes p = 0.808, LSECs p = 2.33 × 10⁻⁶, KCs p = 0.188.

References

    1. Nat. Med 2019, 25, 1321. - PubMed
    1. Dammes N, Peer D, Trends Pharmacol. Sci 2020, 41, 755. - PMC - PubMed
    1. Yin H, Kanasty RL, Eltoukhy AA, Vegas AJ, Dorkin JR, Anderson DG, Nat. Rev. Genet 2014, 15, 541. - PubMed
    1. Cullis PR, Hope MJ, Mol. Ther 2017, 25, 1467. - PMC - PubMed
    1. Kulkarni JA, Witzigmann D, Chen S, Cullis PR, van der Meel R, Acc. Chem. Res 2019, 52, 2435. - PubMed