. 2022 Feb 26;79(3):155.
doi: 10.1007/s00018-022-04186-5.

ROS-induced PADI2 downregulation accelerates cellular senescence via the stimulation of SASP production and NFκB activation

Affiliations

ROS-induced PADI2 downregulation accelerates cellular senescence via the stimulation of SASP production and NFκB activation

Hyun-Jung Kim et al. Cell Mol Life Sci. .

Abstract

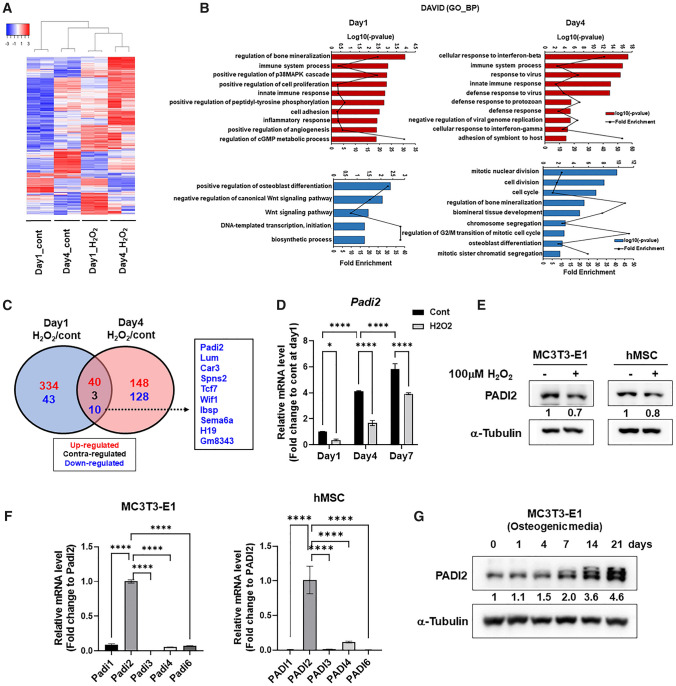
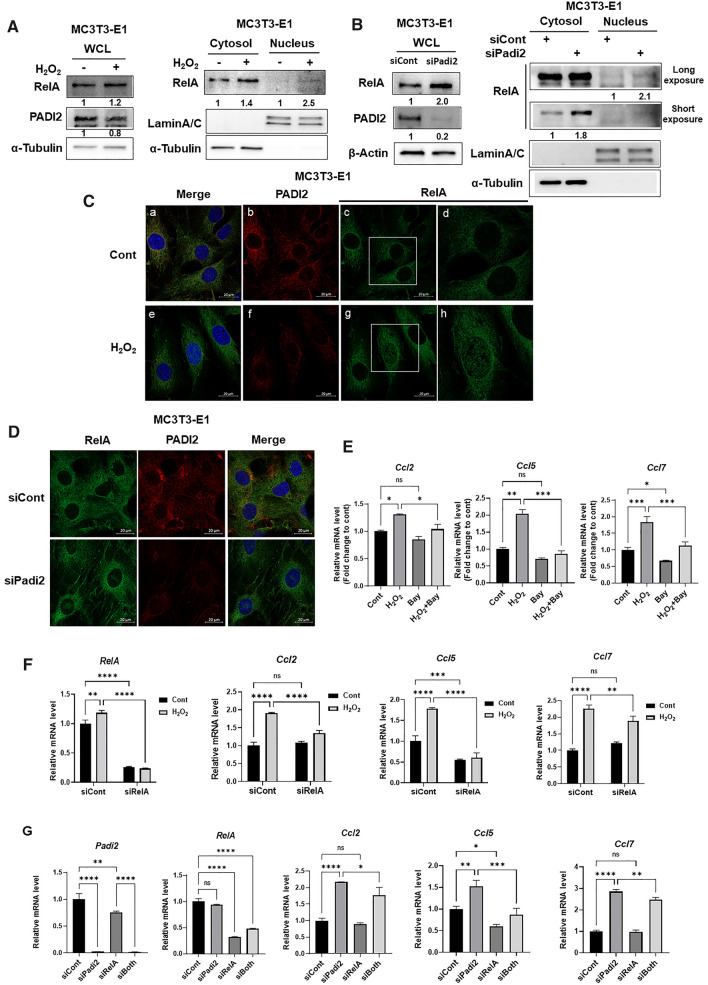
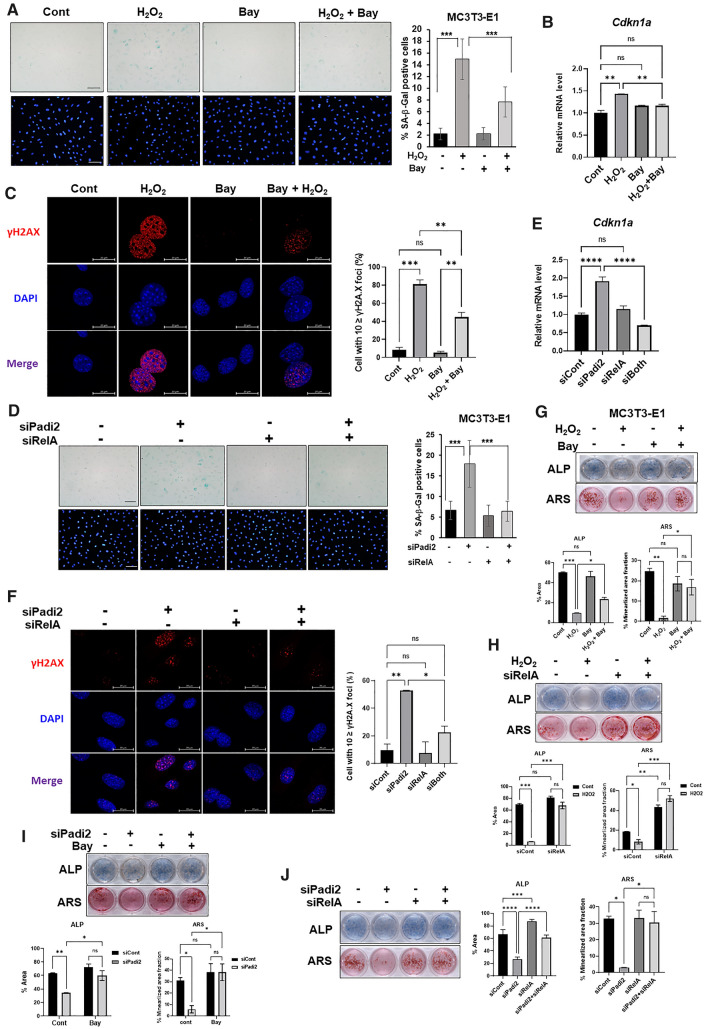
Cellular senescence is closely related to tissue aging including bone. Bone homeostasis is maintained by the tight balance between bone-forming osteoblasts and bone-resorbing osteoclasts, but it undergoes deregulation with age, causing age-associated osteoporosis, a main cause of which is osteoblast dysfunction. Oxidative stress caused by the accumulation of reactive oxygen species (ROS) in bone tissues with aging can accelerate osteoblast senescence and dysfunction. However, the regulatory mechanism that controls the ROS-induced senescence of osteoblasts is poorly understood. Here, we identified Peptidyl arginine deiminase 2 (PADI2), a post-translational modifying enzyme, as a regulator of ROS-accelerated senescence of osteoblasts via RNA-sequencing and further functional validations. PADI2 downregulation by treatment with H2O2 or its siRNA promoted cellular senescence and suppressed osteoblast differentiation. CCL2, 5, and 7 known as the elements of the senescence-associated secretory phenotype (SASP) which is a secretome including proinflammatory cytokines and chemokines emitted by senescent cells and a representative feature of senescence, were upregulated by H2O2 treatment or Padi2 knockdown. Furthermore, blocking these SASP factors with neutralizing antibodies or siRNAs alleviated the senescence and dysfunction of osteoblasts induced by H2O2 treatment or Padi2 knockdown. The elevated production of these SASP factors was mediated by the activation of NFκB signaling pathway. The inhibition of NFκB using the pharmacological inhibitor or siRNA effectively relieved H2O2 treatment- or Padi2 knockdown-induced senescence and osteoblast dysfunction. Together, our study for the first time uncover the role of PADI2 in ROS-accelerated cellular senescence of osteoblasts and provide new mechanistic and therapeutic insights into excessive ROS-promoted cellular senescence and aging-related bone diseases.

Keywords: NFκB; Osteoblast; Peptidyl arginine deiminase 2; Reactive oxygen species; Senescence; Senescence-associated secretory phenotype.


Conflict of interest statement

The authors declare that they have no conflicts of interest.

Figures

Fig. 1
Fig. 1
ROS induce the reduction of PADI2 level in murine- and human-derived mesenchymal lineage cells. A Hierarchical clustering analysis of 706 DEGs from MC3T3-E1 cells treated with or without 100 μM H2O2 for 1 or 4 days in osteogenic medium (fold change, 1.5; log2-normalized read count of ≥ 5; P < 0.05). B DAVID GO term analysis for biological processes of the upregulated (Red) or downregulated (Blue) genes on each day. C The Venn diagram shows the numbers of DEGs with shared and unique expression between day 1 and day 4. Commonly downregulated genes are listed in the right box. D MC3T3-E1 cells were treated with or without 100 μM H2O2 in the osteogenic medium for each indicated period. The Padi2 mRNA level was determined by RT-qPCR and the fold change in mRNA levels was calculated by normalization to Gapdh. Data are presented as the mean of three replicates; bars, ± SD; statistical significance was determined using two-way ANOVA for multiple comparisons, *P < 0.05, ****P < 0.0001. E Western blot analysis of PADI2 in MC3T3-E1 and hMSC treated with or without 100 μM H2O2 for 24 h. Protein level is quantified using ImageJ and normalized with a-Tubulin. After normalization, fold changes of treated /non-treated control are presented. F RT-qPCR of PADI isoforms in MC3T3-E1 and hMSC. Data are presented as the mean of three replicates; bars, ± SD; statistical significance was determined using one-way ANOVA for multiple comparisons, ****P < 0.0001. G Western blot analysis of PADI2 expression levels at the indicated time points during osteogenic differentiation of MC3T3-E1. Protein level is quantified using ImageJ and normalized with a-Tubulin. After normalization, fold changes to day0 are presented
Fig. 2
Fig. 2
Padi2 knockdown accelerates cellular senescence and functional decline of osteoblasts. A MC3T3-E1 cells were transfected with scrambled control siRNA (siCont), Padi2 siRNA #2 (siPadi2 #2), or Padi2 siRNA #3 (siPadi2 #3) and then incubated for 72 h. The mRNA levels of Padi2 and Cdkn1a were determined by RT-qPCR and the fold change in mRNA levels was calculated by normalization to Gapdh. Data are presented as the mean of three replicates; bars, ± SD; statistical significance was determined using one-way ANOVA for multiple comparisons, *P < 0.05, **P < 0.01, ***P < 0.001. Three independent experiments were performed. B A total of 4×10³ cells transfected with each siRNA were seeded on 24-well plates on day 0 and then cells were cultured in growth medium and counted on day 4. Data are presented as the mean of three replicates; bars, ± SD; statistical significance was determined using two-way ANOVA for multiple comparisons, ****P < 0.0001. Three independent experiments were performed. C Representative confocal microcopy images of γH2AX immunostaining. Cells were plated on coverslips to approximately 40–50% confluence 48 h after MC3T3-E1 cells were transfected with each siRNA and then incubated for additional 24 h, followed by γH2AX staining (Red). The nuclei were stained with DAPI (Blue). Scale bar, 50 μm for magnification × 40, 20 μm for magnification × 100. In the graph on the right, the number of cells with ≥ 10 γH2AX foci was presented as a percentage. Bars, mean ± SD of two independent experiments; statistical significance was determined using two-way ANOVA for multiple comparisons, **P < 0.01; ns, not significant. D Representative images of SA-β-Gal staining (upper panel) of MC3T3-E1 transfected with siCont or siPadi2. Transfected cells were cultured for 4 days and SA-β-Gal staining was performed after fixation with 4% paraformaldehyde. Nuclei were stained with DAPI (lower panel). SA-β-Gal-positive cells in each group were calculated as the percentage of SA-β-Gal-positive cells relative to the total cells stained with DAPI in the same field (10 fields/group). Magnification ×20, Scale bars 100 μm. Bars, ± SD; statistical significance was determined using one-way ANOVA for multiple comparisons, ***P < 0.001. Three independent experiments were performed. E MC3T3-E1 cells transfected with siCont or siPadi2 were cultured in osteogenic medium for 4 and 18 days for ALP and ARS staining, respectively. Quantification of each staining was performed by ImageJ. Bars, mean ± SD; statistical significance was determined using one-way ANOVA for multiple comparisons, ***P < 0.001, ****P < 0.0001. Three independent experiments were performed
Fig. 3
Fig. 3
Upregulation of the SASP by ROS and Padi2 knockdown leads to cellular senescence and the inhibition of the SASP ameliorates cellular senescence and osteogenic dysfunction. A Representative images of SA-β-Gal staining. MC3T3-E1 cells were cultured in the conditioned medium (CM) from MC3T3-E1 transfected with siCont or siPadi2 for 8 days and SA-β-Gal staining was performed. Percentage of SA-β-Gal-positive cells in each group was calculated as the percentage of SA-β-Gal-positive cells relative to the total cells stained with DAPI in the same field (8–10 fields/group). Magnification ×20, Scale bars 100 μm. Bars, statistical significance was determined using one-way ANOVA for multiple comparisons, *P < 0.05, ***P < 0.001. Three independent experiments were performed. B MC3T3-E1 cells were cultivated under Padi2 KD-CM for 8 days or siCont-CM, followed by performing RT-qPCR of Cdkn1a. Data for RT-qPCR are presented as the mean of three replicates; bars, ± SD. Statistical significance was determined using one-way ANOVA for multiple comparisons, **P < 0.01, ***P < 0.001; n.s., not significant. Two independent experiments were performed. C Analysis of the relative expression levels of the SASP genes by RNA-seq data (black bar) and RT-qPCR (gray bar). Data are the fold change of 4 day-H2O2-treated group relative to the non-treated control. The red and blue-dotted lines mean fold change 1 and − 1, respectively. Data for RT-qPCR are presented as the mean of three replicates; bars, ± SD. statistical significance was determined using two-tailed Student’s t-test, *P < 0.05, **P < 0.01, ***P < 0.001, ****P < 0.0001; n.s., not significant. Three independent experiments were performed for RT-qPCR. D MC3T3-E1 cells were transfected with siCont, siPadi2 #2 or siPadi2 #3 and then incubated for additional 4 days in the osteogenic medium. The expression level of each gene was measured by RT-qPCR and the fold change in mRNA levels was calculated by normalization to Gapdh. Data are presented as the mean of three replicates; bars, ± SD; statistical significance was determined using one-way ANOVA for multiple comparisons, *P < 0.05, ***P < 0.001, ****P < 0.0001. Three independent experiments were performed. E Five days-cell culture soup from MC3T3-E1 cells transfected with siCont, siPadi2 #2, or siPadi2 #3 was collected and the levels of CCL2, CCL5, and CCL7 in each cell culture soup were measured by ELISA. Data are presented as the mean of three replicates; bars, ± SD; statistical significance was determined using one-way ANOVA for multiple comparisons, *P < 0.05, **P < 0.01, ***P < 0.001, ****P < 0.0001. Three independent experiments were performed. F Representative images of SA-β-Gal staining. MC3T3-E1 cells knocked down with siCont or siPadi2 were treated with IgG or each neutralizing antibody for 4 days and SA-β-Gal staining was performed. Quantity of SA-β-Gal-positive cells was expressed as the percentage of SA-β-Gal-positive cells relative to the total cells stained with DAPI in the same field (8–10 fields/group). Magnification ×20, Scale bars 100 μm. bars, mean ± SD. statistical significance was determined using two-way ANOVA for multiple comparisons, ***P < 0.001. Three independent experiments were performed. G When MC3T3-E1 cells transfected with siCont, siCcl2, siCcl5, or siCcl7 were fully confluent, cells were treated with 100 μM H2O2 for 4 days in osteogenic medium and ALP staining was performed. Quantification of ALP staining was performed by ImageJ. Bars, mean ± SD; statistical significance was determined using one-way or two-way ANOVA for multiple comparisons, *P < 0.05, **P < 0.01, ****P < 0.0001; ns, not significant. H When MC3T3-E1 cells knocked down with siPadi2 in combination with or without siCcl2, 5, or 7 were fully confluent, cells were changed with osteogenic medium and incubated for 4 days and ALP staining was performed. Quantification of ALP staining (right). Bars, mean ± SD; statistical significance was determined using one-way or two-way ANOVA for multiple comparisons, *P < 0.05, **P < 0.01,; ns not significant. Three independent experiments were performed
Fig. 4
Fig. 4
Activation of NFkB signaling mediates ROS- or Padi2 knockdown-induced upregulation of the SASP. A and B When cells were fully confluent, MC3T3-E1 cells were treated with 100 μM H2O2 for 24 h (A) or cultured for additional 3 days after knockdown with siCont or siPadi2 (B), followed by the lysis of whole cell lysates and parallel subcellular fractionation. Western blot analysis was performed with the indicated antibodies. α-Tubulin or β-actin was used as an internal loading control. α-Tubulin and Lamin A/C were used as cytosolic and nuclear markers, respectively. Protein level is quantified using ImageJ and normalized with a-Tubulin, or β-actin, or Lamin A/C. After normalization, fold changes of treated/non-treated control are presented. The exposure time of membranes immunoblotted with anti-RelA was varied to distinguish band intensities (Long and short exposure). Three independent experiments were performed. C MC3T3-E1 cells were treated with 100 μM H2O2 for 24 h. Immunofluorescence staining was performed using the indicated antibodies and the nuclei were stained with DAPI. Boxed areas in c and g are enlarged and presented in the right column (d and h). Scale bar, 20 μm. Three independent experiments were performed. D Immunofluorescence staining of RelA and PADI2 in MC3T3-E1 cells knocked down with Padi2. Scale bar, 20 μm. Three independent experiments were performed. E When cells were fully confluent, MC3T3-E1 cells were treated with 100 μM H2O2 in combination with or without 2.5 μM Bay11-7082 in osteogenic medium for 4 days. The expression level of each gene was measured by RT-qPCR and the fold change in mRNA levels was calculated by normalization to Gapdh. Data are presented as the mean of three replicates; bars, ± SD; statistical significance was determined using one-way ANOVA for multiple comparisons, *P < 0.05, **P < 0.01, ***P < 0.001; ns, not significant. Three independent experiments were performed. F When MC3T3-E1 cells knocked down with siCont or siRelA were fully confluent, cells treated with 100 μM H2O2 in osteogenic medium for 4 days. RT-qPCR was performed. Data are presented as the mean of three replicates; bars, ± SD; statistical significance was determined using two-way ANOVA for multiple comparisons, **P < 0.01, ***P < 0.001, ***P < 0.001; ns, not significant. Three independent experiments were performed. G MC3T3-E1 cells were cultured in osteogenic medium for 4 days after knockdown of Padi2 and/or RelA. All data of RT-qPCR are presented as the mean of three replicates; bars, ± SD; statistical significance was determined using one-way ANOVA for multiple comparisons, *P < 0.05, **P < 0.01, ***P < 0.001, ***P < 0.0001; ns, not significant. Three independent experiments were performed
Fig. 5
Fig. 5
Inhibition of NFκB activity ameliorates ROS- or Padi2 knockdown-accelerated cellular senescence and functional decline of osteoblasts. A Representative images of SA-β-Gal staining. MC3T3-E1 cells were treated with 100 μM H2O2 in combination with or without 2.5 μM Bay11-7082 for 24 h. Quantity of SA-β-Gal-positive cells was calculated as the percentage of SA-β-Gal-positive cells relative to the total cells stained with DAPI in the same field (10 fields/group). Magnification ×20, Scale bars 100 μm. Bars, mean ± SD; statistical significance was determined using one-way ANOVA for multiple comparisons, ***P < 0.001. Three independent experiments were performed. B When cells were fully confluent, MC3T3-E1 cells were treated with 100 μM H2O2 in combination with or without 2.5 μM Bay11-7082 in osteogenic medium for 4 days. Cdkn1a mRNA level was analyzed by RT-qPCR. Data are presented as the mean of three replicates; bars, ± SD; statistical significance was determined using one-way ANOVA for multiple comparisons, **P < 0.01; ns, not significant. Three independent experiments were performed. C Representative confocal microcopy images of γH2AX immunostaining. When cells were approximately 70–80% confluent, MC3T3-E1 cells were treated with 100 μM H2O2 in combination with or without 2.5 μM Bay11-7082 for 24 h, followed by γH2AX immunostaining (Red). The nuclei were stained with DAPI (Blue). Magnification × 100, scale bar, 20 μm. For quantification, the number of cells with ≥ 10 γH2AX foci was presented as a percentage. Bars, mean ± SD of two independent experiments; statistical significance was determined using one-way ANOVA for multiple comparisons, **P < 0.01, ***P < 0.001; ns, not significant. D, E, F MC3T3-E1 cells knocked down with siCont or siPadi2 in combination with siRelA were cultured for 3 days. D Representative images of SA-β-Gal staining. Quantity of SA-β-Gal-positive cells was calculated as the percentage of SA-β-Gal-positive cells relative to the total cells stained with DAPI in the same field (10 fields/group). Magnification ×20, Scale bars 100 μm. Bars, mean ± SD; statistical significance was determined using one-way ANOVA for multiple comparisons, ***P < 0.001. Three independent experiments were performed. E Cdkn1a qRT-PCR were performed. Data are presented as the mean of three replicates; bars, ± SD; statistical significance was determined using one-way ANOVA for multiple comparisons, ****P < 0.0001; ns, not significant. Three independent experiments were performed. F Representative confocal microcopy images of γH2AX immunostaining. Magnification × 100, scale bar, 20 μm. For quantification, the number of cells with ≥ 10 γH2AX foci was presented as a percentage. Bars, mean ± SD of two independent experiments; statistical significance was determined using one-way ANOVA for multiple comparisons, *P < 0.05, **P < 0.01; n.s., not significant. G MC3T3-E1 cells were treated with 100 μM H2O2 in combination with or without 2.5 μM Bay11-7082 in osteogenic medium and ALP and ARS staining was performed at day 4 and day 18, respectively. H and I MC3T3-E1 cells knocked down with siRelA or siPadi2 were treated with 100 μM H2O2 or 2.5 μM Bay11-7082 in osteogenic medium and ALP and ARS staining was performed at day 4 and day 18, respectively. J MC3T3-E1 cells knocked down with siPadi2 in combination with or without siRelA were incubated in osteogenic medium and ALP and ARS staining was performed at day 4 and day 18, respectively. Quantification of each staining was performed by ImageJ. Bars, mean ± SD; statistical significance was determined using one-way ANOVA for multiple comparisons, *P < 0.05, **P < 0.01,***P < 0.001, ****P < 0.0001; ns, not significant. Three independent experiments were performed
Fig. 6
Fig. 6
Schematic diagram depicted in the mechanism of oxidative stress-accelerated senescence and dysfunction of osteoblasts. The reduction of PADI2 by oxidative stress induces upregulation of   CCL2, 5, and 7 known as the SASP, through the activation of NFκB signaling, leading to making a senescent environment and propagating cellular senescence to surrounding cells. Targeting these regulatory processes may be an effective way to prevent or treat excessive ROS-promoted cellular senescence and aging-related bone diseases

Similar articles

Cited by

References

    1. Pouresmaeili F, Kamalidehghan B, Kamarehei M, Goh YM. A comprehensive overview on osteoporosis and its risk factors. Ther Clin Risk Manag. 2018;14:2029–2049. doi: 10.2147/TCRM.S138000. - DOI - PMC - PubMed
    1. Brockstedt H, Kassem M, Eriksen EF, Mosekilde L, Melsen F. Age- and sex-related changes in iliac cortical bone mass and remodeling. Bone. 1993;14(4):681–691. doi: 10.1016/8756-3282(93)90092-o. - DOI - PubMed
    1. Kassem M, Marie PJ. Senescence-associated intrinsic mechanisms of osteoblast dysfunctions. Aging Cell. 2011;10(2):191–197. doi: 10.1111/j.1474-9726.2011.00669.x. - DOI - PubMed
    1. Sohal RS, Weindruch R. Oxidative stress, caloric restriction, and aging. Science. 1996;273(5271):59–63. doi: 10.1126/science.273.5271.59. - DOI - PMC - PubMed
    1. Mody N, Parhami F, Sarafian TA, Demer LL. Oxidative stress modulates osteoblastic differentiation of vascular and bone cells. Free Radic Biol Med. 2001;31(4):509–519. doi: 10.1016/s0891-5849(01)00610-4. - DOI - PubMed

MeSH terms

LinkOut - more resources