. 2022 Jul 15;151(2):240-254.
doi: 10.1002/ijc.33983. Epub 2022 Mar 14.

Integrated molecular profiling of patient-derived ovarian cancer models identifies clinically relevant signatures and tumor vulnerabilities

Affiliations

Integrated molecular profiling of patient-derived ovarian cancer models identifies clinically relevant signatures and tumor vulnerabilities

Michela Lupia et al. Int J Cancer. .

Abstract

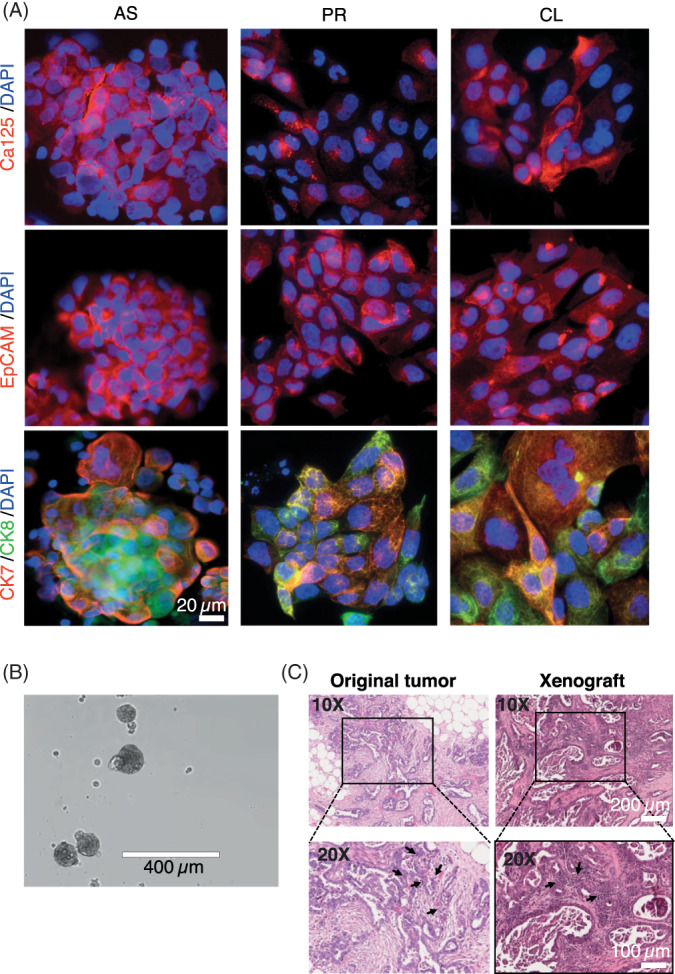
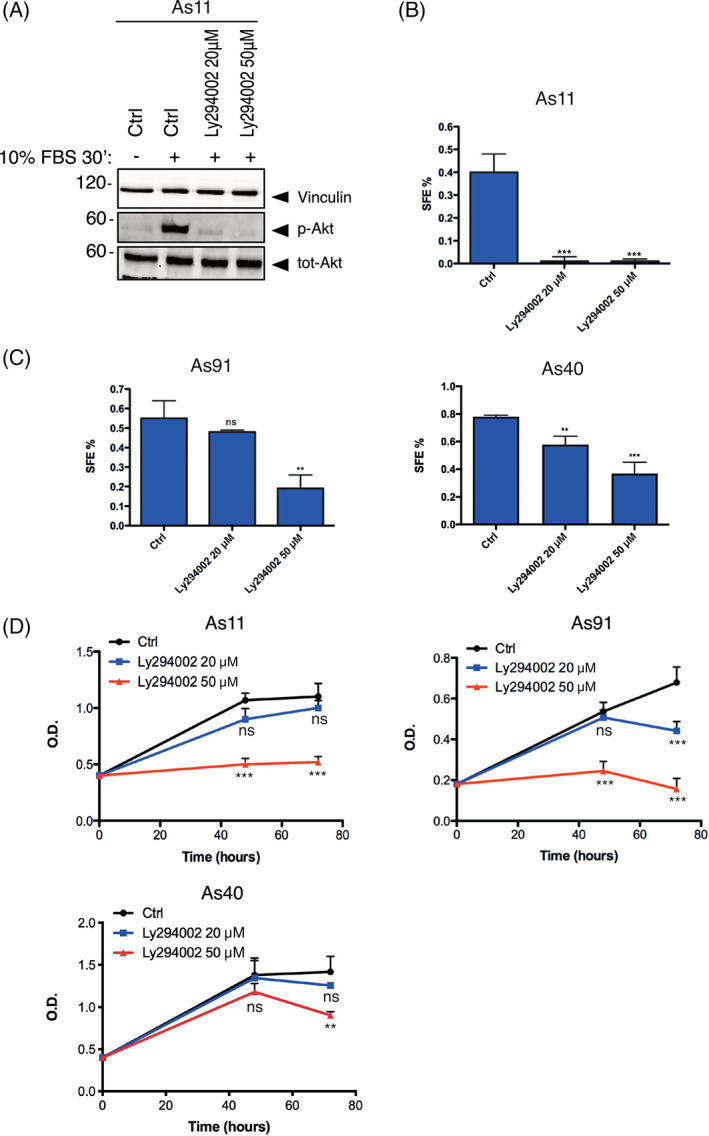
High-grade serous ovarian carcinoma (HGSOC) is a highly aggressive and intractable neoplasm, mainly because of its rapid dissemination into the abdominal cavity, a process that is favored by tumor-associated peritoneal ascites. The precise molecular alterations involved in HGSOC onset and progression remain largely unknown due to the high biological and genetic heterogeneity of this tumor. We established a set of different tumor samples (termed the As11-set) derived from a single HGSOC patient, consisting of peritoneal ascites, primary tumor cells, ovarian cancer stem cells (OCSC) and serially propagated tumor xenografts. The As11-set was subjected to an integrated RNA-seq and DNA-seq analysis which unveiled molecular alterations that marked the different types of samples. Our profiling strategy yielded a panel of signatures relevant in HGSOC and in OCSC biology. When such signatures were used to interrogate the TCGA dataset from HGSOC patients, they exhibited prognostic and predictive power. The molecular alterations also identified potential vulnerabilities associated with OCSC, which were then tested functionally in stemness-related assays. As a proof of concept, we defined PI3K signaling as a novel druggable target in OCSC.

Keywords: ascites; cancer stem cells; genomics; ovarian cancer; prognosis; xenograft.


Conflict of interest statement

The authors declare that they have no conflict of interest.

Figures

FIGURE 1
FIGURE 1
Characterization of the As11‐set. (A) Immunophenotypical characterization of As11 primary cells and the spontaneously immortalized cell line. Immunofluorescence staining for the HGSOC markers CA125, EpCAM, CK7 and CK8 was performed on freshly isolated ascites aggregates (AS), primary cells (PR) at early passage (p3) and the established cell line (CL). Nuclei were counterstained with DAPI. Scale bar, 20 μm. (B) Monoclonal spheroids from early‐passage primary As11 cells (PR). Scale bar, 400 μm. (C) Hematoxylin/eosin staining of the original As11 tumor (left panel) and the corresponding patient‐derived xenograft (right panel). The xenograft showed histopathological features of HGSOC highly similar to the original tumor. The arrows indicate tumor‐infiltrating immune cells. Scale bar is as per the legend (100 and 200 μm) [Color figure can be viewed at wileyonlinelibrary.com]
FIGURE 2
FIGURE 2
Transcriptomic profiles of the As11‐set. (A) Bioinformatic workflow for RNA‐seq analysis. (B) Quantitative trait analysis (QT) of the ovarian cancer transcriptome over analyzed samples: tumor ascites (AS), primary cells (PR), established cell line (CL), stem cells (OCSCs) and patient‐derived tumor xenografts (PDXs). QT‐A, genes putatively involved in HGSOC initiation; QT‐B, genes putatively involved in tumor‐host interaction; QT‐C, genes putatively involved in OCSC pathophysiology. Filled areas show the trend of global geometric means (geoM) of normalized reads (Reads; Y‐axis) of expressed genes (ie, with >0 reads) in every QTs, to allow better quantitative assessment of regulation of QTs across samples. N, number of genes in each cluster. FC, fold change (median centered). (C) The Molecular Signature Database (MSigDB) analysis was performed as described in Methods using the gene sets C2‐CGP database. The top 10 overlapping gene sets are displayed in a bubble plot where the size of bubbles indicates the significance (q‐value) of overlapping as indicated in the legend. In the X‐axis, the relative fraction of overlapping genes between the QT relative gene set (k) and C2‐CGP gene set (K) is indicated. (D) Distribution of the HGSOC molecular subtypes in the TCGA HGSOC dataset (N = 298; left pie chart) and in the tumor subsets identified by QT‐A, QT‐B and QT‐C. D, differentiated subtype (right charts); I, immunoreactive subtype; M, mesenchymal subtype; P, proliferating subtype. E) GSEA of QT‐A, QT‐B and QT‐C in the various HGSOC tumor subtypes (see also Figure S4B). Heatmap illustrates the normalized enrichment score (NES) calculated by GSEA. NES values are as per the legend. (F) Survival analysis of TCGA HGSOC patients (N = 307) stratified by using QT‐A, QT‐B and QT‐C (see Figure S4A and methods). 1‐QT, patients with tumors overexpressing genes from only one QT among QT‐A or QT‐B, or QT‐C. 2‐QTs, patients with tumors overexpressing genes from two QTs (QT‐A and QT‐B, QT‐B and QT‐C, or QT‐A and QT‐C). 3‐QTs, patients with tumors overexpressing genes from all three QTs. Other, patients with tumors not overexpressing QT‐A‐B‐C genes. Left and right panels show overall survival (OS) and disease‐free survival (DFS), respectively. Log‐rank P values are displayed (P a) together with linear trend P values (P b) [Color figure can be viewed at wileyonlinelibrary.com]
FIGURE 3
FIGURE 3
Genomic profiles of the As11‐set. (A) Bioinformatic workflow for DNA‐seq analysis. (B) Pattern of mutational substitutions identified in the As11 samples by DNA‐seq whole‐exome profile analysis. Bar plot indicates the average percentage of SNV and Indel over the samples analyzed (N = 7). Error bars indicate relative standard errors. (C) Distribution of the somatic mutations across all sample types. Colored circles in the middle represent the total number of mutations identified in all samples (green), or private to primary cells (PR), OCSCs and PDXs (pink) or private to primary cells and OCSCs (yellow). AS, tumor ascites. Colored histograms represent the average of the variant allele frequency in percentage. (D) Estimation of the molecular heterogeneity using clonevol R package and fish plot. PyClone analysis revealed three potential clusters (Mut. Cluster 1‐2‐3, gray, purple and blue, respectively) which are enriched in mutations with a diverse allele frequency in the different sample types. The indicated genes belong to the Cancer Gene Census of COSMIC database. Y‐axis, variant allele frequency (%). (E) Somatic copy number variants (CNV) were identified in the sequenced samples. Top panel: CNV in tumor ascites (AS), primary cells (PR) and stem cells (OCSCs); Bottom panel: CNV in the serial PDX samples. Y‐axis, number of copies (Log2). X‐axis, chromosomal position. Black dashed line indicates the diploid status. Gene symbols represent oncogenes or tumor suppressor genes (Section 2) with an altered copy number profile shared in at least two samples. (F) Heatmap representing CNA of genes involved in DNA repair mechanisms across As11 sample types. Copy number values are as per the legend [Color figure can be viewed at wileyonlinelibrary.com]
FIGURE 4
FIGURE 4
Role of the PIK3R1 mutation in OCSCs. (A) Early‐passage primary As11 cells were stimulated for 30 minutes with 10% fetal bovine serum either in the absence or in the presence of 20 or 50 μM LY294002. Cell extracts were immunoblotted for phospho‐AKT (p‐AKT), total AKT, using vinculin as equal loading control. (B) Primary As11 cells were cultured under nonadherent and serum‐free conditions and allowed to form OCSC‐enriched spheroids either in the absence or in the presence of LY294002 at 20 or 50 μM. (C) The same conditions were applied to As91 and As40, two additional primary HGSOC cell cultures that did not have PIK3R1 mutations. (D) Cell proliferation assay on early‐passage primary As11, As91 and As40 cells either in the absence or in the presence of LY294002 at 20 or 50 μM. (ns, not significant; **P < .001; ***P < .0001) [Color figure can be viewed at wileyonlinelibrary.com]

References

    1. Bray F, Ferlay J, Soerjomataram I, Siegel RL, Torre LA, Jemal A. Global cancer statistics 2018: GLOBOCAN estimates of incidence and mortality worldwide for 36 cancers in 185 countries. CA Cancer J Clin. 2018;68:394‐424. - PubMed
    1. Pavlik EJ, Smith C, Dennis TS, et al. Disease‐specific survival of type I and type II epithelial ovarian cancers‐stage challenges categorical assignments of indolence & aggressiveness. Diagnostics (Basel). 2020;10:56. - PMC - PubMed
    1. Torre LA, Trabert B, DeSantis CE, et al. Ovarian cancer statistics, 2018. CA Cancer J Clin. 2018;68:284‐296. - PMC - PubMed
    1. McPherson A, Roth A, Laks E, et al. Divergent modes of clonal spread and intraperitoneal mixing in high‐grade serous ovarian cancer. Nat Genet. 2016;48:758‐767. - PubMed
    1. Eckert MA, Pan S, Hernandez KM, et al. Genomics of ovarian cancer progression reveals diverse metastatic trajectories including intraepithelial metastasis to the fallopian tube. Cancer Discov. 2016;6:1342‐1351. - PMC - PubMed

Publication types