. 2022 May 1:489:84-97.
doi: 10.1016/j.neuroscience.2022.02.021. Epub 2022 Feb 23.

Dendritic Spine Density Scales with Microtubule Number in Rat Hippocampal Dendrites

Affiliations

Dendritic Spine Density Scales with Microtubule Number in Rat Hippocampal Dendrites

Kristen M Harris et al. Neuroscience. .

Abstract

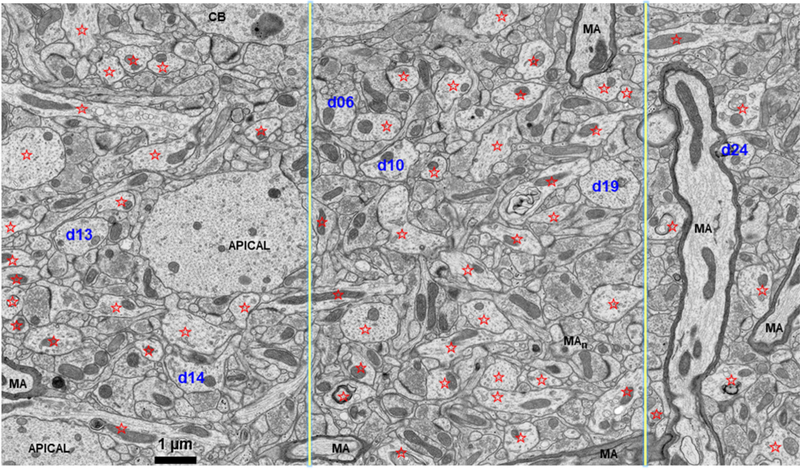
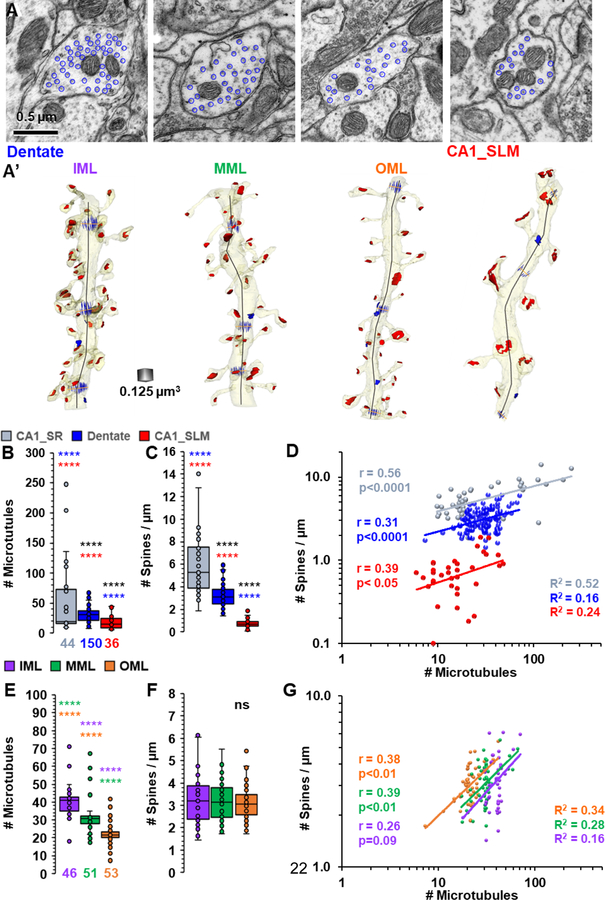
Microtubules deliver essential resources to and from synapses. Three-dimensional reconstructions in rat hippocampus reveal a sampling bias regarding spine density that needs to be controlled for dendrite caliber and resource delivery based on microtubule number. The strength of this relationship varies across dendritic arbors, as illustrated for area CA1 and dentate gyrus. In both regions, proximal dendrites had more microtubules than distal dendrites. For CA1 pyramidal cells, spine density was greater on thicker than thinner dendrites in stratum radiatum, or on the more uniformly thin terminal dendrites in stratum lacunosum moleculare. In contrast, spine density was constant across the cone shaped arbor of tapering dendrites from dentate granule cells. These differences suggest that thicker dendrites supply microtubules to subsequent dendritic branches and local dendritic spines, whereas microtubules in thinner dendrites need only provide resources to local spines. Most microtubules ran parallel to dendrite length and associated with long, presumably stable mitochondria, which occasionally branched into lateral dendritic branches. Short, presumably mobile, mitochondria were tethered to microtubules that bent and appeared to direct them into a thin lateral branch. Prior work showed that dendritic segments with the same number of microtubules had elevated resources in subregions of their dendritic shafts where spine synapses had enlarged, and spine clusters had formed. Thus, additional microtubules were not required for redistribution of resources locally to growing spines or synapses. These results provide new understanding about the potential for microtubules to regulate resource delivery to and from dendritic branches and locally among dendritic spines.

Keywords: 3D-reconstruction; microtubules; spine density; synapses; ultrastructure.


Figures

Figure 1:
Figure 1:
Image from an adult rat hippocampus (perfusion-fixed in vivo) from the middle of CA1 stratum radiatum illustrating the non-uniform composition of the neuropil. Dendrites are indicated by red stars, and five that were analyzed for this paper are numbered (blue). The two yellow lines divide this image into three parts. The left side is occupied by several longitudinally sectioned thin dendrites and two large caliber apical dendrites that reduce the area where synapses could form. In the middle region, most of the processes are cross-sectioned and constitute smaller dendrites, axons, synapses, and glia. The right side has several longitudinally sectioned myelinated axons (MA, also, the process labelled MAn in the middle region was initially confused with dendrites until viewed through serial sections and then recognized as a node of Ranvier with perinodal folds on later sections in the series).
Figure 2:
Figure 2:
Example cross-sectioned dendrite in the middle of stratum radiatum of area CA1 in adult rat hippocampus illustrating how microtubules and dendrite diameters were quantified in the dendritic shafts and compared to spine density. A-B) Microtubules were readily identified as cylindrical structures (~20 nm diameter) with average inter-microtubule spacing of ~35 nm to accommodate microtubule-associated proteins. A and B are section 110 and 111 of a series, and A’ and B’ illustrate outlines of the same microtubules (blue circles). The dendrite diameter (orange line) was measured across the middle of the narrowest orientation of the cut dendrite. C) Complete three-dimensional reconstruction of the dendritic segment used to compute spine density per unbiased segment length (length, thick black line). Three locations along the length where microtubules were counted are illustrated (blue ellipses, 60 by 10 nm) along with the three dendrite diameter measures (orange lines). Dendrite and spines are a translucent, pale yellow with postsynaptic density areas in red. D) Same dendrite illustrating a section through the origin of a large spine, and three organelles that are associated with microtubules: smooth endoplasmic reticulum (green), a mitochondrion (orange), and a multivesicular body (pink with vesicles outlined in light blue). E) Enlarged reconstruction of this dendrite containing the microtubules (dark blue), mitochondrion (orange), SER (green), and the multivesicular body (pink with black vesicles for illustration in 3D). (Scale bar in A is for A-B and D.) F) Significant correlations (Spearman’s r) between average dendrite diameter and associated number of microtubules in the dendritic shaft, where a power analysis reveals that 52% of the variance can be attributed to this relationship (black values; trendline y=0.2×0.4). However, dendrite diameter was essentially uniform over the range of 9–21 microtubules, where the correlation became non-significant (red values; y=0.3×0.2). G) The significant correlation (Spearman’s r) between spine density and microtubules (black values, y=1.8×0.3) became statistically non-significant when restricted to dendrites with 9–21 microtubules (red; y=2.3×0.2). H) The relationship between spine density and number of microtubules depended on the functional status of the hippocampus. For all three conditions there is a statistically significant correlation between spine density and number of microtubules (Spearman’s r), although the goodness of fit was less in the 30 min condition (perf y = 2×0.3, R2= 0.45; 2 hr y = 1.8×0.3, R2 = 0.70; and 30 min y = 2×0.3, R2=0.29). As expected, an ANCOVA revealed no significant difference in this relationship between the 2 hr and perfusion-fixed hippocampus (green, perfused data points are hidden for clarity). In contrast, ANCOVA comparing the 30-minute data to the combined perf and 2 hr data revealed a significant difference by condition (F= 6 by condition, p<0.02, n=72, df=69), with an effect size of 46% (eta-squared). Overall, ANCOVA results show the relationship between spine density and number of microtubules is strong (F=53 for MT, p<0.0001, n=72, df=69).
Figure 3:
Figure 3:
Conservation of microtubule number and spine density across dendritic branch points. A-C) Three electron microscopic images before, at, and after the branch point. Yellow is the primary dendrite and blue is the lateral branch. D) 3D reconstruction of the primary and lateral dendritic branch with subcellular organelles reconstructed surrounding the branch point (green SER, red synapses). E) Microtubules (MT, gray and blue lines) and three mitochondria (pink, blue, orange) pass by and/or into the lateral branch. F) Microtubules in the primary dendrite before and after the branch point (gray) and crossing into the lateral branch (blue). MT counts and spine densities (Sp/μm) are provided for each location. G-I) Circles were placed on each section just outside the boundaries of the dendrites to measure the lengths of the primary dendrites before (yellow) and after branch points (blue, pink). Unique dendritic spines are illustrated as spheres (20 nm) and color coded to match the dendritic segments or lateral branches (turquoise, orange). The microtubules are illustrated as dark blue 60 nm tall by 10 nm wide ellipses in each branch (black arrows). G) The primary dendrite splits into two nearly equal sized branches that each receive about half of the microtubules. H) A large dendrite gives rise to one thinner lateral branch with a proportionate number of microtubules and spine densities. I) A large dendrite gives rise to two lateral dendrites. J) Range in number of microtubules lost or added across branch points. K) Proportionality of microtubules to spine density across branch points differs depending on the type of branching.
Figure 4:
Figure 4:
Differences in the relationship between spine density and microtubule number across axonal input layers in the hippocampus. A) Representative electron micrographs, and A’) matching 3D reconstructions from dendrites in the inner molecular (IML), middle molecular layer (MML), and outer molecular layer (OML) of the dentate gyrus, and CA1 stratum lacunosum moleculare (CA1_SLM). Scale in A is for all EMs; blue circles surround each microtubule. The reconstructed dendrites are displayed in translucent yellow with red postsynaptic density areas, blue microtubules illustrated at 3 measurement points along their lengths, and the length (black line) measured down the center of the dendrite. B) The average number of microtubules in each dendrite. CA1 stratum radiatum (CA1_SR) dendrites are from the perfusion-fixed and two-hour control dendrites described in Figure 2. C) Spine density along reconstructed dendritic segments. D) Correlations between spine density and the number of microtubules across regions. E) Average microtubule number and F) spine density across input layers in dentate gyrus. G) Correlations between spine density and the number of microtubules for input layers of the dentate gyrus. (B, C; E, F: Total number of dendrites in each location is indicated at the base of each box plot, multiple dendrites overlap each data point; **** indicate p<0.001 in post-hoc Dunn’s test following a significant overall KW(127, 6); p<0.0001; stars above each bar are color coded for differences between locations or layers. D, G: r = Spearman’s correlation coefficient with p values. R2 provides goodness of fit of the power analysis model).
Figure 5:
Figure 5:
Number of spines associated with each microtubule. A) The number of spines per microtubule (MT) was greater in CA1_SR than more distally in CA1_SLM (KW(42, 4), p<0.0001, n=number of dendrites beneath the box plots). B) Significant negative correlations between the number of spines per microtubule and number of microtubules in each CA1-SR or CA1_SLM dendrite (Spearman’s r; power analyses R2). C) Number of spines per microtubule increased with distance from the soma in the dentate gyrus (Overall KW(64, 6), p<0.001), and Dunn’s post-hoc tests with Bonferroni correction set to 0.017, ***p=0.005, ****p<0.001 with comparisons color coded above each box plot). D) Significant negative correlations between the number of spines per microtubule and number of microtubules in each MML and OML dendrite, but not in the IML dendrites (Spearman’s r; power analyses R2. For these calculations previously calculated average microtubule lengths were used: 91 μm for perfusion fixed brain and 84 μm for recovered brain slices.)

References

    1. Ehlers MD, Dendritic trafficking for neuronal growth and plasticity, Biochem. Soc. Trans, 41 (2013) 1365–1382. - PubMed
    1. Fiala JC, Kirov SA, Feinberg MD, Petrak LJ, George P, Goddard CA, Harris KM, Timing of neuronal and glial ultrastructure disruption during brain slice preparation and recovery in vitro, J Comp Neurol, 465 (2003) 90–103. - PubMed
    1. Chirillo MA, Waters MS, Lindsey LF, Bourne JN, Harris KM, Local resources of polyribosomes and SER promote synapse enlargement and spine clustering after long-term potentiation in adult rat hippocampus, Sci Rep, 9 (2019) 3861. - PMC - PubMed
    1. Kulik YD, Watson DJ, Cao G, Kuwajima M, Harris KM, Structural plasticity of dendritic secretory compartments during LTP-induced synaptogenesis, Elife, 8 (2019). - PMC - PubMed
    1. Bowen AB, Bourke AM, Hiester BG, Hanus C, Kennedy MJ, Golgi-independent secretory trafficking through recycling endosomes in neuronal dendrites and spines, Elife, 6 (2017). - PMC - PubMed

Publication types