Automated evaluation of respiratory signals to provide insight into respiratory drive
- PMID: 35218924
- PMCID: PMC9157394
- DOI: 10.1016/j.resp.2022.103872
Automated evaluation of respiratory signals to provide insight into respiratory drive
Abstract
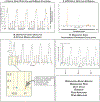
The diaphragm muscle (DIAm) is the primary inspiratory muscle in mammals and is highly active throughout life displaying rhythmic activity. The repetitive activation of the DIAm (and of other muscles driven by central pattern generator activity) presents an opportunity to analyze these physiological data on a per-event basis rather than pooled on a per-subject basis. The present study highlights the development and implementation of a graphical user interface-based algorithm using an analysis of critical points to detect the onsets and offsets of individual respiratory events across a range of motor behaviors, thus facilitating analyses of within-subject variability. The algorithm is designed to be robust regardless of the signal type (e.g., EMG or transdiaphragmatic pressure). Our findings suggest that this approach may be particularly beneficial in reducing animal numbers in certain types of studies, for assessments of perturbation studies where the effects are relatively small but potentially physiologically meaningful, and for analyses of respiratory variability.
Keywords: Diaphragm muscle; Motor control; Motor unit; Respiratory; Statistics; Variability.
Copyright © 2022 Elsevier B.V. All rights reserved.
Figures


Similar articles
-
Neuromotor control of spontaneous quiet breathing in awake rats evaluated by assessments of diaphragm EMG stationarity.J Neurophysiol. 2023 Nov 1;130(5):1344-1357. doi: 10.1152/jn.00267.2023. Epub 2023 Oct 25. J Neurophysiol. 2023. PMID: 37877195 Free PMC article.
-
Activation of human respiratory muscles during different voluntary manoeuvres.J Physiol. 1990 Sep;428:387-403. doi: 10.1113/jphysiol.1990.sp018218. J Physiol. 1990. PMID: 2231418 Free PMC article.
-
Synchronization of presynaptic input to motor units of tongue, inspiratory intercostal, and diaphragm muscles.J Neurophysiol. 2011 May;105(5):2330-6. doi: 10.1152/jn.01078.2010. Epub 2011 Feb 9. J Neurophysiol. 2011. PMID: 21307319 Free PMC article.
-
Convergence of pattern generator outputs on a common mechanism of diaphragm motor unit recruitment.Prog Brain Res. 2014;209:309-29. doi: 10.1016/B978-0-444-63274-6.00016-3. Prog Brain Res. 2014. PMID: 24746055 Free PMC article. Review.
-
Assessment of diaphragm function.Chest Surg Clin N Am. 1998 May;8(2):225-36. Chest Surg Clin N Am. 1998. PMID: 9619303 Review.
Cited by
-
An update on spinal cord injury and diaphragm neuromotor control.Expert Rev Respir Med. 2025 Jul;19(7):679-695. doi: 10.1080/17476348.2025.2495165. Epub 2025 Apr 22. Expert Rev Respir Med. 2025. PMID: 40258801 Review.
-
Chloroquine impairs maximal transdiaphragmatic pressure generation in old mice.J Appl Physiol (1985). 2023 Nov 1;135(5):1126-1134. doi: 10.1152/japplphysiol.00365.2023. Epub 2023 Oct 12. J Appl Physiol (1985). 2023. PMID: 37823202 Free PMC article.
-
Neuromotor control of spontaneous quiet breathing in awake rats evaluated by assessments of diaphragm EMG stationarity.J Neurophysiol. 2023 Nov 1;130(5):1344-1357. doi: 10.1152/jn.00267.2023. Epub 2023 Oct 25. J Neurophysiol. 2023. PMID: 37877195 Free PMC article.
-
Impact of upper cervical spinal cord hemisection on diaphragm neuromotor control.J Neurophysiol. 2025 Aug 1;134(2):698-714. doi: 10.1152/jn.00279.2025. Epub 2025 Jul 28. J Neurophysiol. 2025. PMID: 40720229 Free PMC article.
-
Hypercapnia impacts neural drive and timing of diaphragm neuromotor control.J Neurophysiol. 2024 Dec 1;132(6):1966-1976. doi: 10.1152/jn.00466.2024. Epub 2024 Nov 16. J Neurophysiol. 2024. PMID: 39548981
References
-
- Addelman S, 1970. Variability of treatments and experimental units in the design and analysis of experiments. Journal of the American Statistical Association 65, 1095–1108.
-
- Bellemare F, Grassino A, 1982. Effect of pressure and timing of contraction on human diaphragm fatigue. J Appl Physiol Respir Environ Exerc Physiol 53, 1190–1195. - PubMed
-
- Bien MY, Hseu SS, Yien HW, Kuo BI, Lin YT, Wang JH, Kou YR, 2004. Breathing pattern variability: a weaning predictor in postoperative patients recovering from systemic inflammatory response syndrome. Intensive Care Med 30, 241–247. - PubMed
Publication types
MeSH terms
Grants and funding
LinkOut - more resources
Full Text Sources

