. 2022 Apr:569:13-28.
doi: 10.1016/j.virol.2022.01.002. Epub 2022 Feb 15.

Azadirachta indica A. Juss bark extract and its Nimbin isomers restrict β-coronaviral infection and replication

Affiliations

Azadirachta indica A. Juss bark extract and its Nimbin isomers restrict β-coronaviral infection and replication

Lucky Sarkar et al. Virology. 2022 Apr.

Abstract

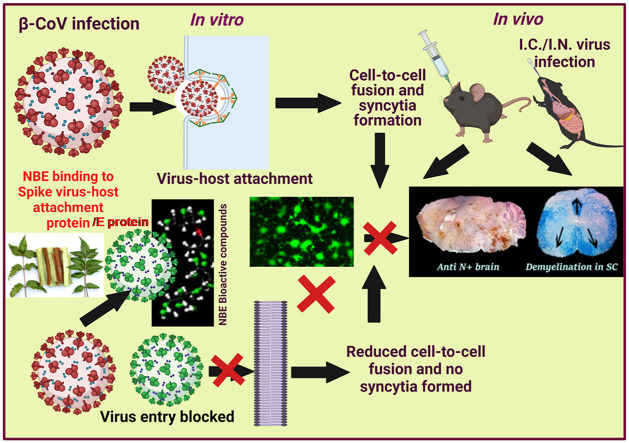
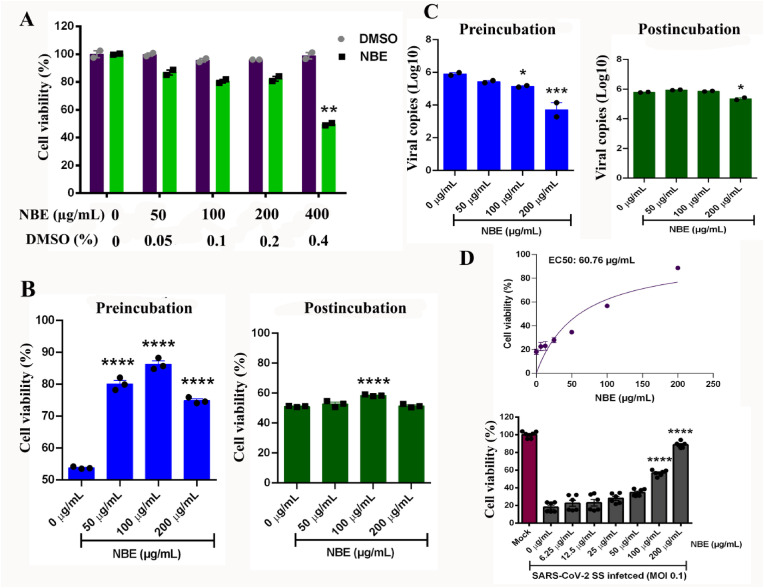
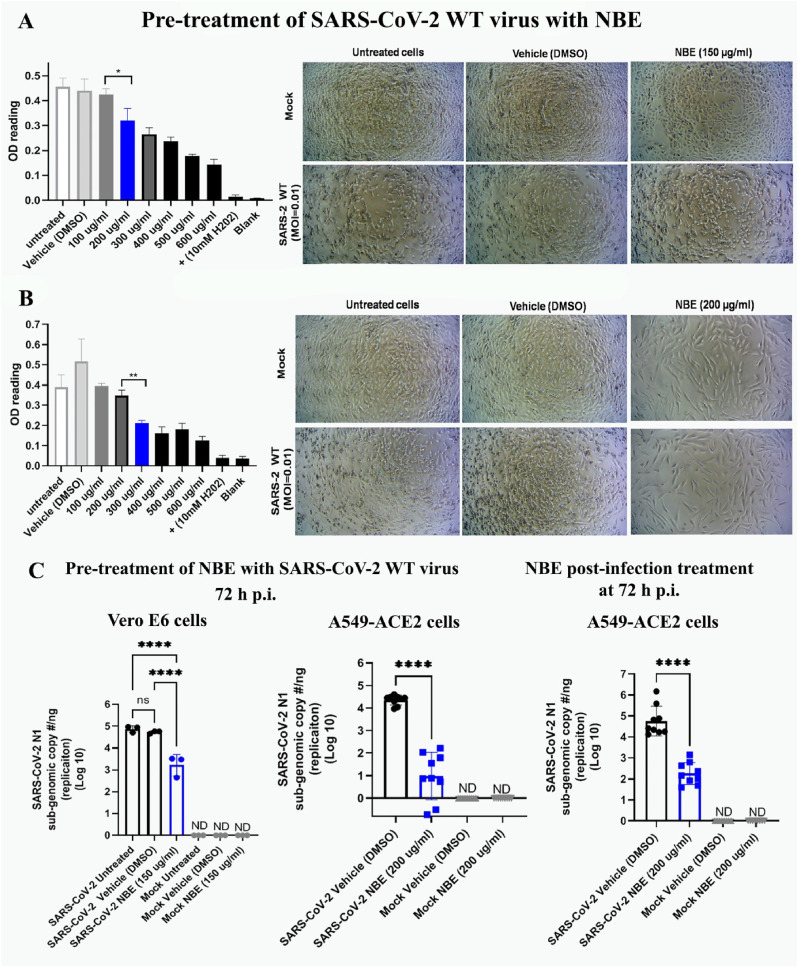
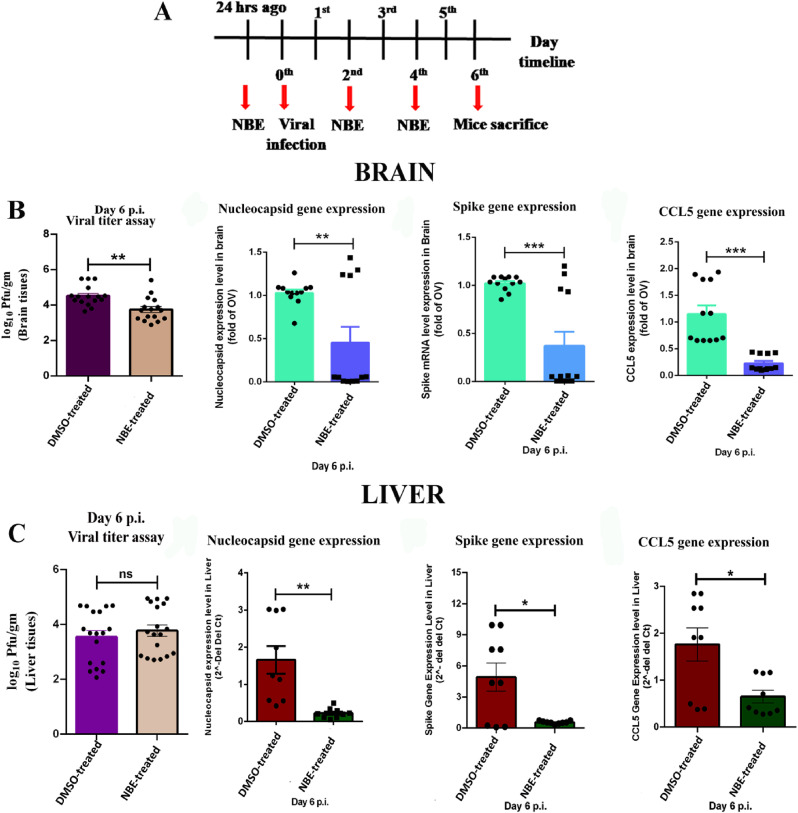
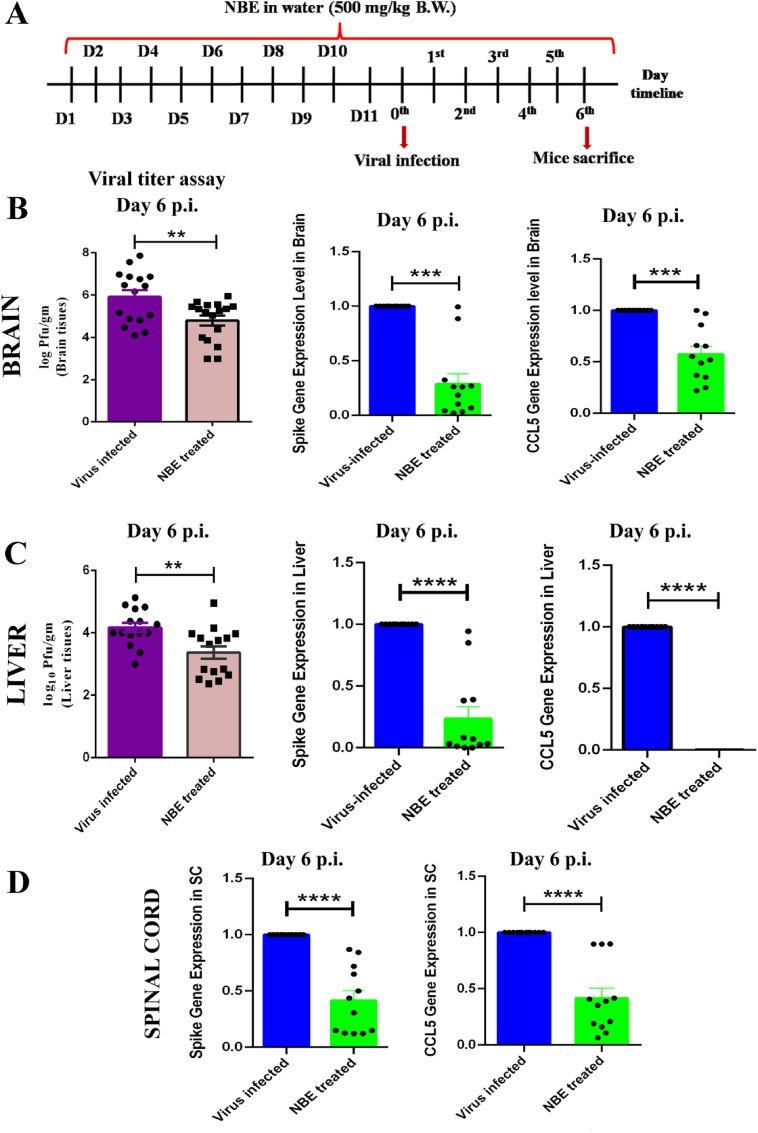
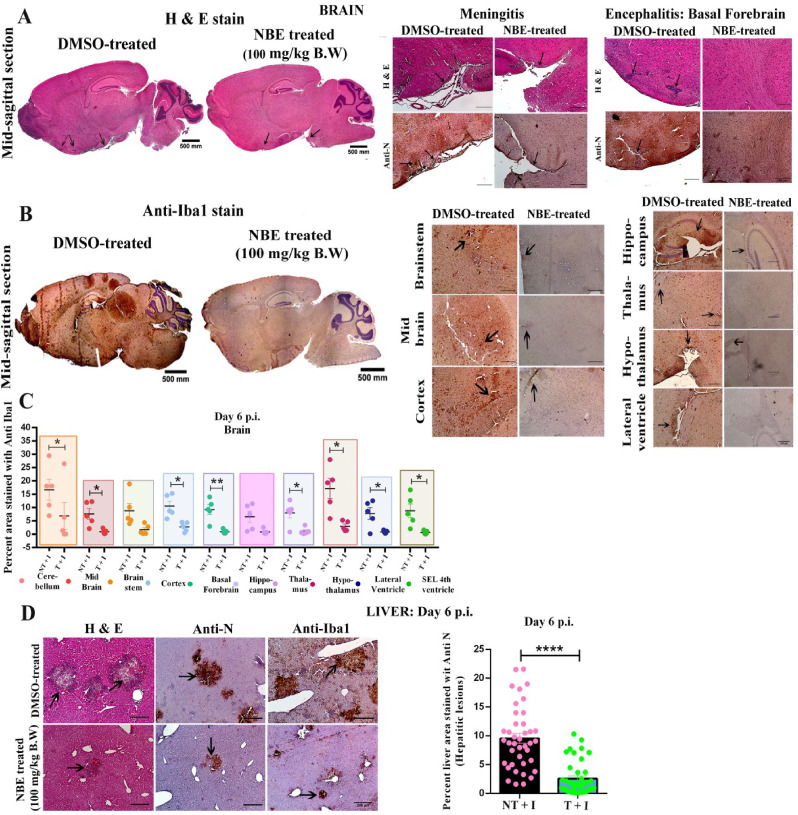
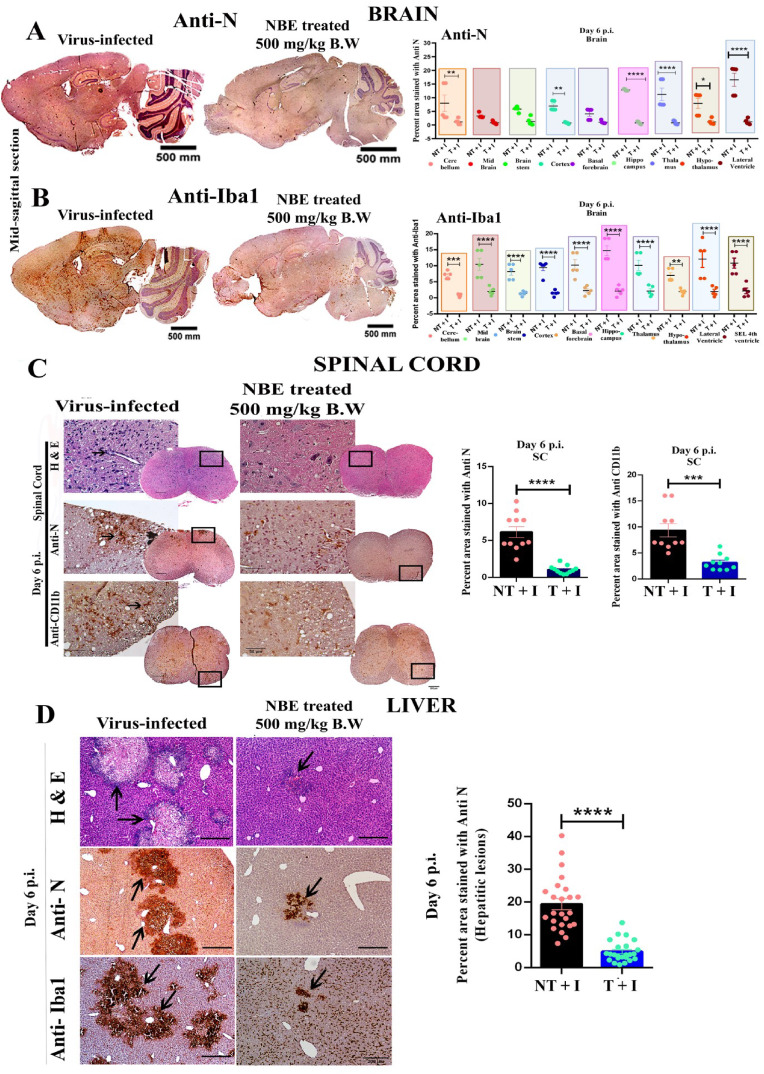
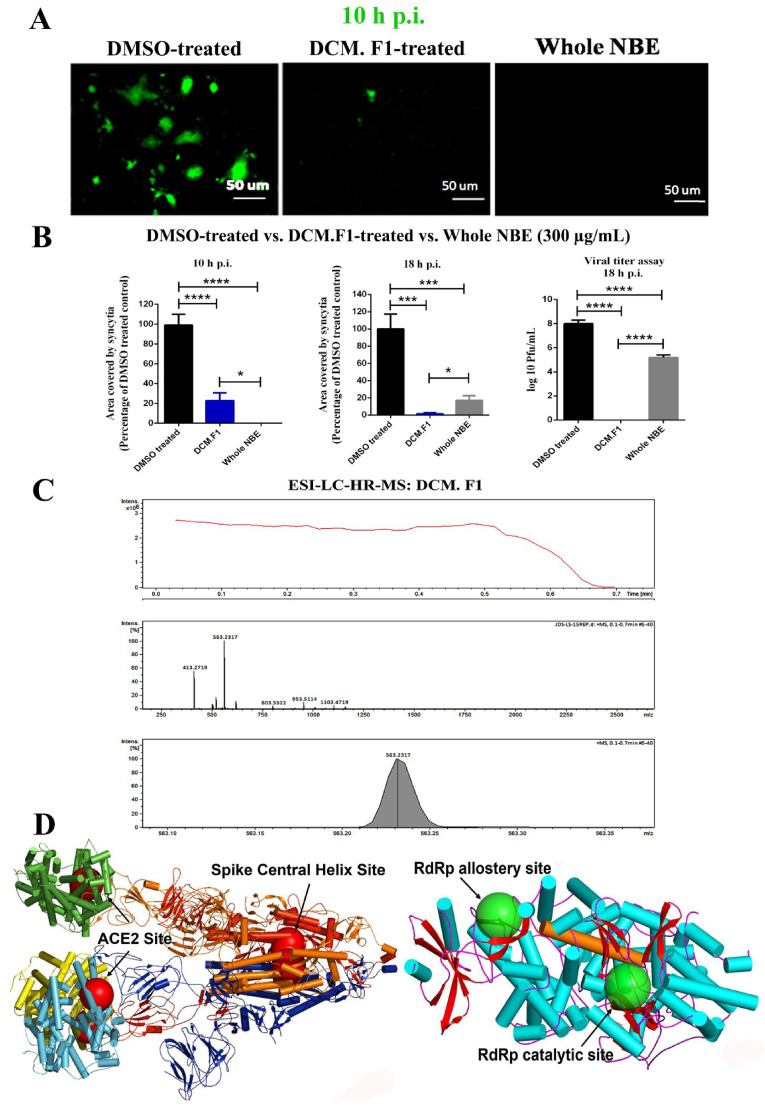
Emerging mutations in the SARS-CoV-2 genome pose a challenge for vaccine development and antiviral therapy. The antiviral efficacy of Azadirachta indica bark extract (NBE) was assessed against SARS-CoV-2 and m-CoV-RSA59 infection. Effects of in vivo intranasal or oral NBE administration on viral load, inflammatory response, and histopathological changes were assessed in m-CoV-RSA59-infection. NBE administered inhibits SARS-CoV-2 and m-CoV-RSA59 infection and replication in vitro, reducing Envelope and Nucleocapsid gene expression. NBE ameliorates neuroinflammation and hepatitis in vivo by restricting viral replication and spread. Isolated fractions of NBE enriched in Nimbin isomers shows potent inhibition of m-CoV-RSA59 infection in vitro. In silico studies revealed that NBE could target Spike and RdRp of m-CoV and SARS-CoV-2 with high affinity. NBE has a triterpenoids origin that may allow them to competitively target panoply of viral proteins to inhibit mouse and different strains of human coronavirus infections, suggesting its potential as an antiviral against pan-β-Coronaviruses.

Keywords: Antiviral; Azadirachtaindica A. Juss (Neem bark extract); Beta-coronavirus; Epinimbin/Nimbin; Inhibitor of viral entry and spread; RdRp (RNA dependant RNA polymerase); SARS-CoV-2; Virus spike protein; m-CoV-MHV-A59/RSA59.


Figures

Image 1
Graphical abstract
Fig. 1
Fig. 1
NBE shows an inhibitory effect in SARS-CoV-2 (SS) susceptibility in Vero E6 cells. (A) The cytotoxic effect of NBE at indicated concentrations (0–400 μg/mL) and their corresponding DMSO concentrations is represented as bar-scatter graphs as a measure of % cell viability. The cell viability was measured by detecting ATP using ToxGlo assay, and the % cell viability was calculated for the respective agents compared to untreated cells. The data is representative of technical duplicates and presented as mean ± SEM. Statistical significance compared to the DMSO control is shown. (B) NBE (0–200 μg/mL) was either preincubated with SARS-CoV-2 SS (MOI 0.1) prior to infection of Vero E6 cells or added to cell cultures immediately after SARS-CoV-2 SS (MOI 0.1) infection. Preincubation of the virus with NBE (50–200 μg/mL) significantly reduced virus-induced cellular cytotoxicity but not post-incubation. The data is represented as % cell viability in comparison to untreated and mock-infected cells. The bar-scatter graph is representative of technical triplicate and presented as mean ± SEM. Statistical significance compared to the NBE-untreated is shown. (C) NBE preincubation significantly reduced virus production in the cell culture supernatant (E gene expression) at 100–200 μg/mL. Post-infection NBE treatment showed a low but significant reduction of viral replication (E gene expression) only at 200 μg/mL. The bar-scatter graph is representative of technical duplicates and presented as mean ± SEM. Statistical significance compared to the NBE-untreated is shown. (D) The EC50 concentration of NBE was determined by pre-incubating the virus with NBE concentrations ranging from 6.25 to 200 μg/mL as indicated. The cellular cytotoxicity at 48 h after SARS-CoV-2 SS infection (MOI 0.1) was determined by viral ToxGlo™ assay (Luminescence). The values were normalized as % viability to the Mock-infected and untreated cells. The EC50 was calculated using GraphPad Prism. The bar-scatter graphs show the calculated % viability (mean ± SEM) and represent biological duplicates with technical triplicates in each. The significance level between treatment groups and respective controls was calculated by unpaired student's t-test and RM two-way ANOVA test followed by Sidak's multiple comparison test, *p < 0.05, **p < 0.01; ***p < 0.001; ****p < 0.0001.
Fig. 2
Fig. 2
NBE restricts SARS-CoV-2 WT (U.S.-WA1/2020)-induced Cytopathy (CPE) and replication. (A) Vero E6 cells were treated with a range of NBE concentrations (100–600 μg/mL) for 72 h and analyzed utilizing an MTT toxicity assay. Ten mM H2O2 was used as a positive control, which causes cell death at 3 days post-infection (dpi). SARS-CoV-2 WT infected (MOI 0.01) untreated and DMSO treated Vero E6 cells revealed characteristic CPE (few rounded cells) at 72 h p.i. Vero E6 cells were sensitive to NBE at 200 μg/mL; hence the MTT assay estimated the EC value of NBE is 150 μg/mL, which had significantly less CPE on Vero E6 cells upon preincubation of SARS-CoV-2 with NBE. (B) A549-ACE2 cells were sensitive to NBE at 300 μg/mL, and 200 μg/mL as EC value was used for subsequent analyses. There was significantly less CPE upon 200 μg/mL NBE preincubated SARS-CoV-2 infection in A549-ACE2 cells. NBE (200 μg/mL) pre-treated SARS-CoV-2 WT infection had significantly less CPE (slightly elongated in morphology) like mock + NBE samples. (C) SARS-CoV-2 N1 gene replication was measured at 3 dpi from RNA harvested from cells infected with SARS-CoV-2-WT that was preincubated with NBE (150 μg/mL) for Vero E6 cells; 200 μg/mL for A549-ACE2 cells, and from A549-ACE2 cells treated with NBE (200 μg/mL) beginning immediately after infection. Data represent mean ± SEM; level of significance was calculated using unpaired student's t-test, and RM one-way ANOVA test followed by Tukey's multiple comparison test (*p < 0.05, **p < 0.01, ***p < 0.0001, ****p < 0.0001; ND = not detected, LOD = limit of detection); [n = 3].
Fig. 3
Fig. 3
Intranasal NBE administration followed by intranasal m-CoV-RSA59 inoculation significantly restricts viral replication and pro-inflammatory chemokine expression in vivo. (A) Mice were treated with NBE (100 mg/kg B.W) or DMSO intranasally 24 h before intranasal infection of m-CoV-RSA59 (10^6 PFU) and subjected for NBE/DMSO treatment every alternate day until day 6 p.i. The schematic represents the timeline for NBE administration, m-CoV-RSA59 inoculation, and euthanasia for tissue harvesting. (B) Viral burden and mRNA level expression of viral N, S, and CCL5 from brains of DMSO treated and NBE-treated infected mice. (C) Viral burden and mRNA level expression of viral N, S, and CCL5 from livers of DMSO treated and NBE-treated infected mice. Brain and liver tissue homogenates were analyzed by routine plaque assay and represented as PFU/gm of brain or liver from individual mice. Data represent mean ± SEM and statistical significance was determined by unpaired student's t-test, *p < 0.05, **p < 0.01, ***p < 0.001, ****p < 0.0001, significantly different from DMSO treated sets, [n = 4–5].
Fig. 4
Fig. 4
Oral NBE administration through drinking water before and after intracranial m-CoV-RSA59 infection significantly reduces viral S gene and pro-inflammatory chemokine CCL5 expression. (A) The schematic represents the timeline of NBE treatment and m-CoV-RSA59 infection. 2.5-week-old C57BL/6 mice were bottle-fed with NBE (500 mg/kg B.W) in drinking water for 11 days prior to infection, and then both NBE-treated and age-matched untreated mice were inoculated intracranially with m-CoV-RSA59 (half of the LD50 dose, 20, 000 PFU) at age 4-weeks old. At day 6 p.i., viral load and mRNA level expression of viral S and CCL5 from untreated and NBE-treated infected mouse brain (B) and liver tissues (C) shows that NBE treated mice had significantly lower viral titers (based on routine plaque assay of tissue homogenates and represented as PFU/gm) and reduced expression of viral S and CCL5. (D) mRNA level expression of viral S and CCL5 from spinal cords of untreated and NBE-treated infected mice shows reduced expression in NBE-treated mice. Data represent mean ± SEM and statistical significance was determined by unpaired student's t-test and RM two-way ANOVA and Tukey's multiple comparison test analyses; *p < 0.05, **p < 0.01, ***p < 0.001, ****p < 0.0001, significantly different from untreated sets, [n = 4–5].
Fig. 5
Fig. 5
Intranasal NBE treatment reduces m-CoV-RSA59-induced neuroinflammatory pathology and hepatitis. (A) Mice were treated with intranasal NBE(100 mg/kg B.W) or DMSO (control) 24 h before intranasal infection of m-CoV-RSA59 (10^6 PFU) and subjected to NBE/DMSO treatment every alternate day until day 6 p.i. when tissues were harvested as depicted in Fig. 3A. Five μm thin paraffin-embedded serial sections of m-CoV-RSA59 infected + DMSO treated (no-NBE), and NBE-treated brain tissues were processed for H & E, anti-Nucleocapsid (A) and Iba1 staining (B). (A) Representative images of the whole brain with selected neuroanatomic regions are shown for DMSO treated mice with meningeal infiltration and encephalitis characterized by perivascular cuffing much more prominent in untreated control mice than in NBE-treated mice. (B) Iba1 staining in different neuroanatomic regions like cerebellum, midbrain, cortex, ventral striatum/basal forebrain, thalamus, hypothalamus, lateral ventricle, and the sub-ependymal layer of 4th ventricle is shown for DMSO treated mice brains. NBE-treated mice showed significantly reduced inflammation determined by no perivascular cuffing and less scattered Iba-1+ cells without apparent nodule formation. (C) Quantification of the intensity of Iba-1 staining representing microglial activation in different neuroanatomic regions of DMSO treated and NBE-treated mice brain sections were plotted in the graph and showed significantly reduced inflammation in most brain regions in NBE-treated mice. (D) Serial sections from liver tissues of the same DMSO treated and NBE-treated mice were stained with H&E or immunostained with anti-N and anti-Iba1. DMSO treated mice liver sections show a characteristic hepatic lesion with profuse anti-N and Iba-1+ cells. In contrast, NBE-treated mice showed comparatively much less anti-N and anti-Iba1 staining. The graph plotted the quantification of the intensity of anti-N staining in hepatic lesions in DMSO treated and NBE-treated liver sections. Arrows indicate the presence of viral antigen and Iba1+ cells in hepatic lesions. Data represent mean ± SEM and statistical significance was determined by unpaired student's t-test, and RM two-way ANOVA and Tukey's multiple comparison tests; *p < 0.05, **p < 0.01, ***p < 0.001, ****p < 0.0001, significantly different from untreated sets; T + I = NBE treated + infected; NT + I = DMSO treated + infected [n = 4–5].
Fig. 6
Fig. 6
Oral NBE treatment through drinking water reduces m-CoV-RSA59-induced meningitis, encephalitis, myelitis, and hepatitis. 2.5-week-old age mice received oral NBE (500 mg/kg B.W) treatment through drinking water for 11 days and were infected intracranially with m-CoV-RSA59 (20000 PFU) at 4-weeks old, as depicted in Fig. 4A. NBE treatment continued until day 6 p.i. when the brain, spinal cord, and liver tissues were harvested for histopathological and immunohistochemical analyses. (A–B) Five μm thin serial brain sections from NBE-treated and age-matched untreated infected mice were processed for anti-Nucleocapsid and anti-Iba1 staining. (A) Representative images of anti-N stained brain sections. Untreated mouse brains revealed meningeal infiltration and encephalitis characterized by perivascular cuffing and well-disseminated viral antigen throughout the brain, including cortex, hippocampus, thalamus, hypothalamus, lateral ventricle, and brain stem. In contrast, NBE-treated mice showed significantly restricted viral antigens with less accumulation. The viral antigen distribution of both mice groups was quantified and compared. (B) Representative Iba1 staining throughout the brain parenchyma, including cortex, hippocampus, thalamus, hypothalamus, lateral ventricle, brain stem, and the sub-ependymal layer of the 4th ventricle shows significantly reduced neuroinflammation and few resident microglia/macrophages without nodule formation in NBE-treated mice as compared with untreated mice. Quantification of the intensity of Iba-1 staining in different neuroanatomic regions of untreated and NBE-treated mouse brains is shown.(C) Serial cross-sections of the spinal cords from the same untreated and NBE-treated mice at day 6 p.i. were stained with H & E, anti-N, and anti-CD11b (microglia/macrophages) antibodies. Untreated mice showed significantly more viral antigen distributed in the white matter and the gray-white matter junction than the NBE-treated group. Iba1+ cells were well-disseminated, and a characteristic microglial nodule was formed in untreated spinal cord sections, whereas the NBE-treated group showed restricted viral antigen dissemination and microglial-mediated inflammation. The total anti-N+ areas and Iba1+ areas were quantified and plotted.(D) H&E stained liver sections from untreated mice show more severe necrotizing hepatitis with profuse viral antigen and Iba-1+ monocytes/macrophages than treated mice. NBE treatment significantly restricted viral antigen (anti-N) and accumulation of Iba1+ cells in hepatic lesions at day 6 p.i.; confirmed by quantitative analysis. Arrows indicate the presence of viral antigen and Iba1+ cells in hepatic lesions. Data represent mean ± SEM and statistical significance was determined by unpaired student's t-test and RM two-way ANOVA and Tukey's multiple comparison test analyses; *p < 0.05, **p < 0.01, ***p < 0.001, ****p < 0.0001, significantly different from DMSO treated sets, T + I = NBE treated + infected; NT + I = untreated + infected [n = 4–5].
Fig. 7
Fig. 7
Identification of bioactive NBE components and a cartoon diagram for SARS-CoV-2 proteins showing dominant binding sites for bioactive compounds. The DCM.F1 (300 μg/mL) fraction of NBE was analyzed to test the potential antiviral efficiency against m-CoV-RSA59 infection by preincubating it with the virus at MOI 1, followed by infection in Neuro-2A cells. Effects of DCM.F1 were compared to the effects of preincubation of the virus with NBE (300 μg/mL) prior to infection. (A) Both DCM.F1 and whole NBE show reduced syncytia formation at 10 h p.i. (B) Virus-induced cell-to-cell fusogenicity was significantly reduced to a similar degree in cultures infected with both DCM.F1 pre-treated and whole NBE pre-treated m-CoV-RSA59, as compared with cultures infected with the untreated virus at 10 h and 18 h p.i. Viral titer assay of cell culture supernatants revealed a significant reduction in viral replication upon preincubating the virus with DCM.F1 at 18 h p.i., indicating that DCM.F1 can inhibit viral cytopathy as well as viral replication effectively. Whole NBE also reduced viral replication but was less effective than DCM.F1. Data represent mean ± SEM. Level of significance was calculated using student's t-test and RM one-way ANOVA followed by Sidak's multiple comparison test (*p < 0.05, **p < 0.01, ***p < 0.0001, ****p < 0.0001); [n = 3]. (C) Mass spectrometry data corresponding to DCM.F1. The top panel shows the total ion chromatogram obtained from the elution of DCM.F1. The extracted ions from the total ion chromatogram are shown in the middle panel. The area under the curve (AUC) for the base peak is shown in the bottom-most panel. The peaks map to neem compounds Nimbin and 4- Epinimbin. (D) A cartoon diagram of Spike from SARS-CoV-2 complex with ACE2 protein is drawn using coordinates from PDB ID: 7A98. The top-ranked docking sites of the neem compounds from NBE fraction DCM.F1 are shown as large transparent spheres in red. These are anchored around residue L1024 in the Central helix for all three trimers of Spike. For ACE2, the top-ranked docking sites for a majority of neem compounds are around residue F40 located close to the ACE2-Spike interaction site. A cartoon diagram of RdRp protein is drawn using coordinates from the PDB ID: 7AAP. The top-ranked docking sites of the neem compounds are shown in large green transparent spheres. Of the two sites, one is the RdRp-associated nucleotidyl transferase catalytic site and may influence the binding at the main catalytic site that is bridged by a long helix (686-709) shown in orange. (For interpretation of the references to colour in this figure legend, the reader is referred to the Web version of this article.)

Similar articles

Cited by

References

    1. Alzohairy M.A. Therapeutics role of Azadirachta indica (neem) and their active constituents in diseases prevention and treatment. Evid. Based Complement. Alternat. Med. 2016:7382506. doi: 10.1155/2016/7382506. 2016. - DOI - PMC - PubMed
    1. Anisuzzman M., Hasan M.M., Acharzo A.K., Das A.K., Rahman S. In vivo and in vitro evaluation of pharmacological potentials of secondary bioactive Metabolites of Dalbergia candenatensis leaves. Evid. Based Complement. Alternat. Med. 2017:5034827. doi: 10.1155/2017/5034827. 2017. - DOI - PMC - PubMed
    1. Appelberg S., Gupta S., Svensson Akusjarvi S., Ambikan A.T., Mikaeloff F., Saccon E.…Neogi U. Dysregulation in Akt/mTOR/HIF-1 signaling identified by proteo-transcriptomics of SARS-CoV-2 infected cells. Emerg. Microb. Infect. 2020;9(1):1748–1760. doi: 10.1080/22221751.2020.1799723. - DOI - PMC - PubMed
    1. Baildya N., Khan A.A., Ghosh N.N., Dutta T., Chattopadhyay A.P. Screening of potential drug from Azadirachta Indica (Neem) extracts for SARS-CoV-2: an insight from molecular docking and MD-simulation studies. J. Mol. Struct. 2021;1227:129390. doi: 10.1016/j.molstruc.2020.129390. - DOI - PMC - PubMed
    1. Bandyopadhyay U., Biswas K., Chatterjee R., Bandyopadhyay D., Chattopadhyay I., Ganguly C.K.…Banerjee R.K. Gastroprotective effect of Neem (Azadirachta indica) bark extract: possible involvement of H(+)-K(+)-ATPase inhibition and scavenging of hydroxyl radical. Life Sci. 2002;71(24):2845–2865. doi: 10.1016/s0024-3205(02)02143-4. - DOI - PubMed