. 2022 Mar 17;82(6):1156-1168.e7.
doi: 10.1016/j.molcel.2022.02.006. Epub 2022 Feb 25.

Dynamic control of chromatin-associated m6A methylation regulates nascent RNA synthesis

Affiliations

Dynamic control of chromatin-associated m6A methylation regulates nascent RNA synthesis

Wenqi Xu et al. Mol Cell. .

Abstract

N6-methyladenosine (m6A) methylation is co-transcriptionally deposited on mRNA, but a possible role of m6A on transcription remains poorly understood. Here, we demonstrate that the METTL3/METTL14/WTAP m6A methyltransferase complex (MTC) is localized to many promoters and enhancers and deposits the m6A modification on nascent transcripts, including pre-mRNAs, promoter upstream transcripts (PROMPTs), and enhancer RNAs. PRO-seq analyses demonstrate that nascent RNAs originating from both promoters and enhancers are significantly decreased in the METTL3-depleted cells. Furthermore, genes targeted by the Integrator complex for premature termination are depleted of METTL3, suggesting a potential antagonistic relationship between METTL3 and Integrator. Consistently, we found the Integrator complex component INTS11 elevated at promoters and enhancers upon loss of MTC or nuclear m6A binders. Taken together, our findings suggest that MTC-mediated m6A modification protects nascent RNAs from Integrator-mediated termination and promotes productive transcription, thus unraveling an unexpected layer of gene regulation imposed by RNA m6A modification.

Keywords: ALKBH5; INTS11; METTL3; chromatin; enhancer; hnRNP G; m(6)A; nascent RNA; promoter.


Conflict of interest statement

Declaration of interests Y.S. is a co-founder of and holds equity in K36 Therapeutics. Y.S. is a consultant for Active Motif, a member of the Scientific Advisory Board of the College of Life Sciences, West Lake University, and a member of the MD Anderson External Advisory Board. K.A. received research funding from Novartis not related to this work, is a consultant for Syros Pharmaceuticals, is on the SAB of CAMP4 Therapeutics, and is a member of the Advisory Board of Molecular Cell. All other authors declare no competing interests.

Figures
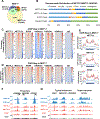
Figure 1.
Figure 1.. The m6A MTC components bind promoters and enhancers in MCF-7 cells
A. Venn diagram showing overlap of ChIP-seq peaks of METTL3, METTL14 and WTAP. B. Bar plots showing the peaks distribution of METTL3, METTL14 and WTAP. C-D. Heatmaps showing the enrichments (ChIP relative to Input) of METTL3, METTL14, WTAP and different histone modifications over promoters (H3K4me3 and H3K27Ac) (C) and enhancers (H3K4me1 and H3K27Ac) (D). Heatmaps were ranked by METTL3 enrichment. E. Aggregation plots showing the binding patterns of METTL3 (Top), METTL14 (Middle) and WTAP (Bottom) over super enhancers. F-G. Snapshots of UCSC genome browser showing METTL3, METTL14 and WTAP binding events at three representative promoters (F), and three representative typical enhancers and one super enhancer (G). See also Figures S1 and S2. For ChIP-seq, representative of two biological replicates were shown. Pearson correlation coefficients for the biological replicates are listed in Table S3.
Figure 2.
Figure 2.. The m6A MTC catalyzes m6A in mRNAs, PROMPTs and eRNAs in MCF-7 cells
A-C. Aggregation plots showing m6A enrichment over mRNA TSS (A) and PROMPT TSS (B) and eRNA TSS (C) in MCF-7 cells. D-F. Heatmaps showing METTL3, METTL14, WTAP enrichment and m6A signal over mRNA TSS (D) and PROMPT TSS (E) and eRNA TSS (F) in MCF-7 cells. G. Boxplots showing m6A enrichment (IP/Input) over m6A peaks localized to TSS to TSS+100 region of mRNA (Left), PROMPT (Middle) and eRNA (Right) in control and METTL3 KD MCF-7 cells. m6A signal at m6A peaks was calculated and Paired t-test was used. H. Snapshots of UCSC genome browser showing m6A enrichment (IP/Input) over mRNA TSSs (Left), PROMPT TSSs (Middle) and eRNA TSSs (Right) in control and METTL3 KD MCF-7 cells. See also Figure S3. For MeRIP-seq and ChIP-seq, representative of two biological replicates were shown. Pearson correlation coefficients for the biological replicates are listed in Table S3.
Figure 3.
Figure 3.. The m6A MTC regulates nascent RNA synthesis in MCF-7 cells
A-C. Aggregation plots (A), Snapshots of UCSC genome browser (B) and Boxplots (C) showing the nascent RNA level decreases upon METTL3 KD over Pre-mRNAs in MCF-7 cells. PRO-seq signal at TSS to TSS+100 region was calculated and Paired t-test was used for in C. D-F. Aggregation plots (D), Snapshots of UCSC genome browser (E) and Boxplots (F) showing the nascent RNA level decreases upon METTL3 KD over PROMPTs in MCF-7 cells. PRO-seq signal at TSS to TSS+100 region was calculated and Paired t-test was used for in F. G-I. Aggregation plots (G), Snapshots of UCSC genome browser (H) and Boxplots (I) showing the nascent RNA level decreases upon METTL3 KD over eRNAs in MCF-7 cells. PRO-seq signal at TSS to TSS+100 region was calculated and Paired t-test was used for in I. J-L. Aggregation plots showing the nascent RNA level change upon METTL3 KD over “METTL3 high” and “METTL3 low” mRNA TSSs (n=500) (J), PROMPT TSSs (n=200) (K), eRNA TSSs (n=200) (L) in MCF-7 cells. M-O. Boxplots showing nascent RNA changes after individual or combined siRNA treatment for METTL3 and INTS11 over mRNA TSSs (M), PROMPT TSSs (N) and eRNA TSSs (O) in MCF-7 cells. PRO-seq signal at TSS to TSS+100 region was calculated and Paired t-test was used. See also Figure S3. PRO-seq was carried out with spike-in Drosophila cells and normalized with reads mapped to the spike-in genome. For PRO-seq, representative of two biological replicates were shown. Pearson correlation coefficients for the biological replicates are listed in Table S3.
Figure 4.
Figure 4.. Nascent RNAs on promoters and enhancers are dynamically regulated by m6A demethylase ALKBH5 in MCF-7 cells
A. Venn diagram showing overlap of ChIP-seq peaks between HA-ALKBH5 and METTL3 in MCF-7 cells. B. Aggregation plots showing the HA-ALKBH5 binding levels over METTL3 bound promoters (Left) and enhancers (Right) in MCF-7 cells. C. Snapshots of UCSC genome browser showing METTL3 and HA-ALKBH5 binding at two representative promoters (Left) and two representative enhancers (Right). D. RT-qPCR assays showing nascent RNA level decreases upon ALKBH5 over-expression at two representative promoters and two representative enhancers. See also Figure S4. For RT-qPCR, all data are represented as mean±SD from three biological repeats; ** p-value<0.01; t-test. For ChIP-seq, representative of two biological replicates were shown. Pearson correlation coefficients for the biological replicates are listed in Table S3.
Figure 5.
Figure 5.. Loss of m6A promotes INTS11 recruitment, which mediates nascent RNA cleavage in MCF-7 cells
A-C. Aggregation plots showing the INTS11 binding level increases upon KD of METTL3, METTL14 or WTAP over mRNA TSS (A), PROMPT TSS (B), eRNA TSS (C) in MCF-7 cells. D-F. Snapshots of UCSC genome browser showing the INTS11 binding level increases upon KD of METTL3, METTL14 or WTAP over mRNA TSS (D), PROMPT TSS (E), eRNA TSS (F) in MCF-7 cells. G-I. Aggregation plots showing the INTS11 binding level change upon METTL3 KD over METTL3 high or low bound gene TSSs (n=500) (G), PROMPT TSSs (n=200) (H), eRNA TSSs (n=200) (I) in MCF-7 cells. See also Figure S4. For ChIP-seq, representative of two biological replicates were shown. Pearson correlation coefficients for the biological replicates are listed in Table S3.
Figure 6.
Figure 6.. METTL3 and Integrator bind to different sets of genes in Drosophila
A and B. Boxplots of the ChIP-seq signal (sum of reads TSS +/− 250) at each cluster of Pol II decay rates, defined in Elrod et al. (2019) for (A) IntS1 or (B) METTL3. Solid line represents median, with whiskers indicating 10th-90th percentiles. p-values are from Mann-whitney test. C. Heatmap representations of ChIP-seq reads for METTL3 and IntS1 in S2 cells. Data are aligned around mRNA TSSs, shown as a green arrow (n=8389). Data are ranked by Promoter Pol II decay rate, where promoters with fastest decay rates (≤2.5 min) are on top. Dotted line separates each group of genes. D. Average distribution of METTL3 ChIP-seq signal is shown, aligned around TSSs and divided into groups based on Pol II decay rate. E. Average distribution of the difference in IntS9-depleted vs. Control PRO-seq signal at the top 500 METTL3-bound genes (red) versus expression-matched METTL3-low genes (blue). See also Figure S4. PRO-seq was carried out with spike-in HEK293T cells and normalized with reads mapped to the spike-in genome. For PRO-seq, three biological repeats were combined. For ChIP-seq, two biological repeats were combined. Pearson correlation coefficients for the biological replicates are listed in Table S3.
Figure 7.
Figure 7.. m6A protects nascent RNAs from INST11-mediated cleavage through hnRNP G
A. Aggregation plots showing hnRNP G binding (determined by Cut&Tag) over METTL3 bound promoters (Left) and enhancers (Right) in MCF-7 cells. B. Snapshots of UCSC genome browser showing METTL3 and hnRNP G (Cut&Tag, and ChIP) binding at two representative promoters (Left) and two representative enhancers (Right) in MCF-7 cells. C. Aggregation plots showing increase in INTS11 binding level over METTL3 bound promoters (Left) and enhancers (Right) upon KD of hnRNP G in MCF-7 cells. D. RT-qPCR assays showing decrease in nascent RNA level upon hnRNP G KD at two representative promoters and two representative enhancers in MCF-7 cells. E. Schematic model showing how m6A MTC binds promoters and enhancers and protects local nascent RNAs from INTS11 dependent cleavage. See also Figure S5. For RT-qPCR, all data are represented as mean±SD from three biological repeats; ** p-value<0.01; t-test. For ChIP-seq and Cut&Tag-seq, representative of two biological replicates were shown. Pearson correlation coefficients for the biological replicates are listed in Table S3.

References

    1. Akhtar J, Renaud Y, Albrecht S, Ghavi-Helm Y, Roignant JY, Silies M, and Junion G (2021). m6A RNA methylation regulates promoter- proximal pausing of RNA polymerase II. MOL CELL 81, 3356–3367. - PubMed
    1. Akichika S, Hirano S, Shichino Y, Suzuki T, Nishimasu H, Ishitani R, Sugita A, Hirose Y, Iwasaki S, and Nureki O, et al. (2019). Cap-specific terminal N (6)-methylation of RNA by an RNA polymerase II-associated methyltransferase. SCIENCE 363. - PubMed
    1. Barbieri I, Tzelepis K, Pandolfini L, Shi J, Millan-Zambrano G, Robson SC, Aspris D, Migliori V, Bannister AJ, and Han N, et al. (2017). Promoter-bound METTL3 maintains myeloid leukaemia by m(6)A-dependent translation control. NATURE 552, 126–131. - PMC - PubMed
    1. Beckedorff F, Blumenthal E, DaSilva LF, Aoi Y, Cingaram PR, Yue J, Zhang A, Dokaneheifard S, Valencia MG, and Gaidosh G, et al. (2020). The Human Integrator Complex Facilitates Transcriptional Elongation by Endonucleolytic Cleavage of Nascent Transcripts. CELL REP 32, 107917. - PMC - PubMed
    1. Chelmicki T, Roger E, Teissandier A, Dura M, Bonneville L, Rucli S, Dossin F, Fouassier C, Lameiras S, and Bourc’His D (2021). m(6)A RNA methylation regulates the fate of endogenous retroviruses. NATURE 591, 312–316. - PubMed

Publication types