

Changes in Prevalence of Mental Illness Among US Adults During Compared with Before the COVID-19 Pandemic
- PMID: 35219431
- PMCID: PMC8585610
- DOI: 10.1016/j.psc.2021.11.013
Changes in Prevalence of Mental Illness Among US Adults During Compared with Before the COVID-19 Pandemic
Abstract
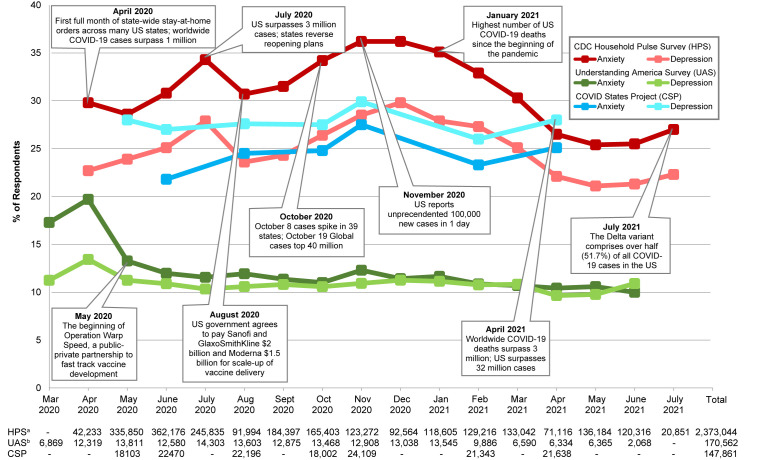
The authors review trend and cohort surveys and administrative data comparing prevalence of mental disorders during, versus, and before the COVID-19 pandemic and changes in mental health disparities. Best evidence suggests clinically significant anxiety-depression point prevalence increased by relative-risk (RR) = 1.3 to 1.5 during the pandemic compared with before. This level of increase is much less than the implausibly high RR = 5.0 to 8.0 estimates reported in trend studies early in the pandemic based on less-appropriate comparisons. Changes in prevalence also occurred during the pandemic, but relative prevalence appears not to have changed substantially over this time.
Keywords: COVID-19; Cohort study; Health disparities; Mental disorders; Trend study.
Copyright © 2021 Elsevier Inc. All rights reserved.
Conflict of interest statement
Disclosure In the past 3 years, Dr R.C. Kessler was a consultant for Datastat, Inc, Holmusk, RallyPoint Networks, Inc, and Sage Therapeutics. He has stock options in Mirah, PYM, and Roga Sciences. The other authors report no conflicts.
Figures
Similar articles
-
Covid-19-related stressors, mental disorders, depressive and anxiety symptoms: a cross-sectional, nationally-representative, face-to-face survey in Serbia.Epidemiol Psychiatr Sci. 2022 May 24;31:e36. doi: 10.1017/S2045796022000117. Epidemiol Psychiatr Sci. 2022. PMID: 35607805 Free PMC article.
-
Global prevalence and burden of depressive and anxiety disorders in 204 countries and territories in 2020 due to the COVID-19 pandemic.Lancet. 2021 Nov 6;398(10312):1700-1712. doi: 10.1016/S0140-6736(21)02143-7. Epub 2021 Oct 8. Lancet. 2021. PMID: 34634250 Free PMC article.
-
Prevalence and Factors Associated with Mental Health Impact of COVID-19 Pandemic in Bangladesh: A Survey-Based Cross-Sectional Study.Ann Glob Health. 2021 Apr 26;87(1):43. doi: 10.5334/aogh.3269. Ann Glob Health. 2021. PMID: 33981590 Free PMC article.
-
Mental health and COVID-19 in a general population cohort in Spain (COVICAT study).Soc Psychiatry Psychiatr Epidemiol. 2022 Dec;57(12):2457-2468. doi: 10.1007/s00127-022-02303-0. Epub 2022 May 28. Soc Psychiatry Psychiatr Epidemiol. 2022. PMID: 35633398 Free PMC article.
-
Changes in the prevalence of mental health problems during the first year of the pandemic: a systematic review and dose-response meta-analysis.BMJ Ment Health. 2024 Jun 13;27(1):e301018. doi: 10.1136/bmjment-2024-301018. BMJ Ment Health. 2024. PMID: 38876492 Free PMC article.
Cited by
-
Prevalence of depressive symptoms in U.S. adults during the COVID-19 pandemic: A systematic review.SSM Popul Health. 2023 Mar;21:101348. doi: 10.1016/j.ssmph.2023.101348. Epub 2023 Jan 28. SSM Popul Health. 2023. PMID: 36741588 Free PMC article. Review.
-
US Primary Care Workforce Growth: A Decade of Limited Progress, and Projected Needs Through 2040.J Gen Intern Med. 2025 Feb;40(2):339-346. doi: 10.1007/s11606-024-09121-x. Epub 2024 Oct 23. J Gen Intern Med. 2025. PMID: 39443342 Free PMC article.
-
Mental Health Shortfalls: Perceptions of Unmet Needs and Barriers and Facilitators to Receiving Care.Adm Policy Ment Health. 2025 May;52(3):594-602. doi: 10.1007/s10488-025-01438-x. Epub 2025 Mar 28. Adm Policy Ment Health. 2025. PMID: 40153172
-
Depression and associated factors among Brazilian adults: the 2019 national healthcare population-based study.BMC Psychiatry. 2023 Sep 28;23(1):704. doi: 10.1186/s12888-023-05133-9. BMC Psychiatry. 2023. PMID: 37770824 Free PMC article.
-
Impact of the COVID-19 pandemic on incidence of psychiatric disorders using nationwide cohort data and ARIMA models.Sci Rep. 2025 Jul 28;15(1):27478. doi: 10.1038/s41598-025-12479-5. Sci Rep. 2025. PMID: 40721455 Free PMC article.
References
-
- Center for Disease Control and Prevention COVID data tracker. https://covid.cdc.gov/covid-data-tracker/#datatracker-home Available at: Accessed August 6, 2021.
-
- Falk G., Romero P.D., Carter J.A., et al. Unemployment rates during the COVID-19 pandemic. https://fas.org/sgp/crs/misc/R46554.pdf Available at: Accessed August 7, 2021.
-
- Amadeo K. What is long-term unemployment? https://www.thebalance.com/long-term-unemployment-what-it-is-causes-and-... Available at: Accessed August 11, 2021.
-
- U.S. Bureau of Labor Statistics Unemployed 27 weeks or longer as a percent of total unemployed. https://www.bls.gov/charts/employment-situation/unemployed-27-weeks-or-l... Available at: Accessed August 7, 2021.
Publication types
MeSH terms
Grants and funding
LinkOut - more resources
Full Text Sources
Medical
