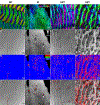
Loss of biological control of enamel mineralization in amelogenin-phosphorylation-deficient mice
- PMID: 35219810
- PMCID: PMC9149128
- DOI: 10.1016/j.jsb.2022.107844
Loss of biological control of enamel mineralization in amelogenin-phosphorylation-deficient mice
Abstract
Amelogenin, the most abundant enamel matrix protein, plays several critical roles in enamel formation. Importantly, we previously found that the singular phosphorylation site at Ser16 in amelogenin plays an essential role in amelogenesis. Studies of genetically knock-in (KI) modified mice in which Ser16 in amelogenin is substituted with Ala that prevents amelogenin phosphorylation, and in vitro mineralization experiments, have shown that phosphorylated amelogenin transiently stabilizes amorphous calcium phosphate (ACP), the initial mineral phase in forming enamel. Furthermore, KI mice exhibit dramatic differences in the enamel structure compared with wild type (WT) mice, including thinner enamel lacking enamel rods and ectopic surface calcifications. Here, we now demonstrate that amelogenin phosphorylation also affects the organization and composition of mature enamel mineral. We compared WT, KI, and heterozygous (HET) enamel and found that in the WT elongated crystals are co-oriented within each rod, however, their c-axes are not aligned with the rods' axes. In contrast, in rod-less KI enamel, crystalline c-axes are less co-oriented, with misorientation progressively increasing toward the enamel surface, which contains spherulites, with a morphology consistent with abiotic formation. Furthermore, we found significant differences in enamel hardness and carbonate content between the genotypes. ACP was also observed in the interrod of WT and HET enamel, and throughout aprismatic KI enamel. In conclusion, amelogenin phosphorylation plays crucial roles in controlling structural, crystallographic, mechanical, and compositional characteristics of dental enamel. Thus, loss of amelogenin phosphorylation leads to a reduction in the biological control over the enamel mineralization process.
Keywords: Amelogenin; Biomineralization; Dental enamel; Phosphorylation.
Copyright © 2022 Elsevier Inc. All rights reserved.
Conflict of interest statement
Declaration of interests
The authors declare that they have no known competing financial interests or personal relationships that could have appeared to influence the work reported in this paper.
Figures


Similar articles
-
Role of amelogenin phosphorylation in regulating dental enamel formation.Matrix Biol. 2024 Aug;131:17-29. doi: 10.1016/j.matbio.2024.05.004. Epub 2024 May 16. Matrix Biol. 2024. PMID: 38759902 Free PMC article.
-
Amelogenin phosphorylation regulates tooth enamel formation by stabilizing a transient amorphous mineral precursor.J Biol Chem. 2020 Feb 14;295(7):1943-1959. doi: 10.1074/jbc.RA119.010506. Epub 2020 Jan 9. J Biol Chem. 2020. PMID: 31919099 Free PMC article.
-
Proteolysis by MMP20 Prevents Aberrant Mineralization in Secretory Enamel.J Dent Res. 2019 Apr;98(4):468-475. doi: 10.1177/0022034518823537. Epub 2019 Feb 11. J Dent Res. 2019. PMID: 30744480 Free PMC article.
-
Mechanisms of Enamel Mineralization Guided by Amelogenin Nanoribbons.J Dent Res. 2021 Dec;100(13):1434-1443. doi: 10.1177/00220345211012925. Epub 2021 May 19. J Dent Res. 2021. PMID: 34009057 Free PMC article. Review.
-
Recent observations on enamel crystal formation during mammalian amelogenesis.Anat Rec. 1996 Jun;245(2):208-18. doi: 10.1002/(SICI)1097-0185(199606)245:2<208::AID-AR8>3.0.CO;2-S. Anat Rec. 1996. PMID: 8769664 Review.
Cited by
-
Role of amelogenin phosphorylation in regulating dental enamel formation.Matrix Biol. 2024 Aug;131:17-29. doi: 10.1016/j.matbio.2024.05.004. Epub 2024 May 16. Matrix Biol. 2024. PMID: 38759902 Free PMC article.
-
Calcium interactions in amelogenin-derived peptide assembly.Front Physiol. 2022 Dec 14;13:1063970. doi: 10.3389/fphys.2022.1063970. eCollection 2022. Front Physiol. 2022. PMID: 36589425 Free PMC article.
-
Recombinant amelogenin peptide TRAP promoting remineralization of early enamel caries: An in vitro study.Front Physiol. 2023 Jan 23;14:1076265. doi: 10.3389/fphys.2023.1076265. eCollection 2023. Front Physiol. 2023. PMID: 36755789 Free PMC article.
-
Ameloblastin and its multifunctionality in amelogenesis: A review.Matrix Biol. 2024 Aug;131:62-76. doi: 10.1016/j.matbio.2024.05.007. Epub 2024 May 28. Matrix Biol. 2024. PMID: 38815936 Free PMC article. Review.
-
The intricacies of tooth enamel: Embryonic origin, development and human genetics.J Struct Biol. 2024 Dec;216(4):108135. doi: 10.1016/j.jsb.2024.108135. Epub 2024 Oct 9. J Struct Biol. 2024. PMID: 39384002 Review.
References
-
- Al-Atar U, Bokov AA, Marshall D, Teichman JM, Gates BD, Ye Z-G, Branda NR, 2010. Mechanism of calcium oxalate monohydrate kidney stones formation: layered spherulitic growth. Chem. Mater 22, 1318–1329.
-
- Awonusi A, Morris MD, Tecklenburg MM, 2007. Carbonate assignment and calibration in the Raman spectrum of apatite. Calcif Tissue Int 81, 46–52. - PubMed
-
- Beniash E, Simmer JP, Margolis HC, 2005. The effect of recombinant mouse amelogenins on the formation and organization of hydroxyapatite crystals in vitro. J Struct Biol 149, 182–190. - PubMed
Publication types
MeSH terms
Substances
Grants and funding
LinkOut - more resources
Full Text Sources
Molecular Biology Databases

