. 2022 Jun 1:167:105672.
doi: 10.1016/j.nbd.2022.105672. Epub 2022 Feb 24.

NaV1.1 haploinsufficiency impairs glutamatergic and GABAergic neuron function in the thalamus

Affiliations

NaV1.1 haploinsufficiency impairs glutamatergic and GABAergic neuron function in the thalamus

Carleigh Studtmann et al. Neurobiol Dis. .

Abstract

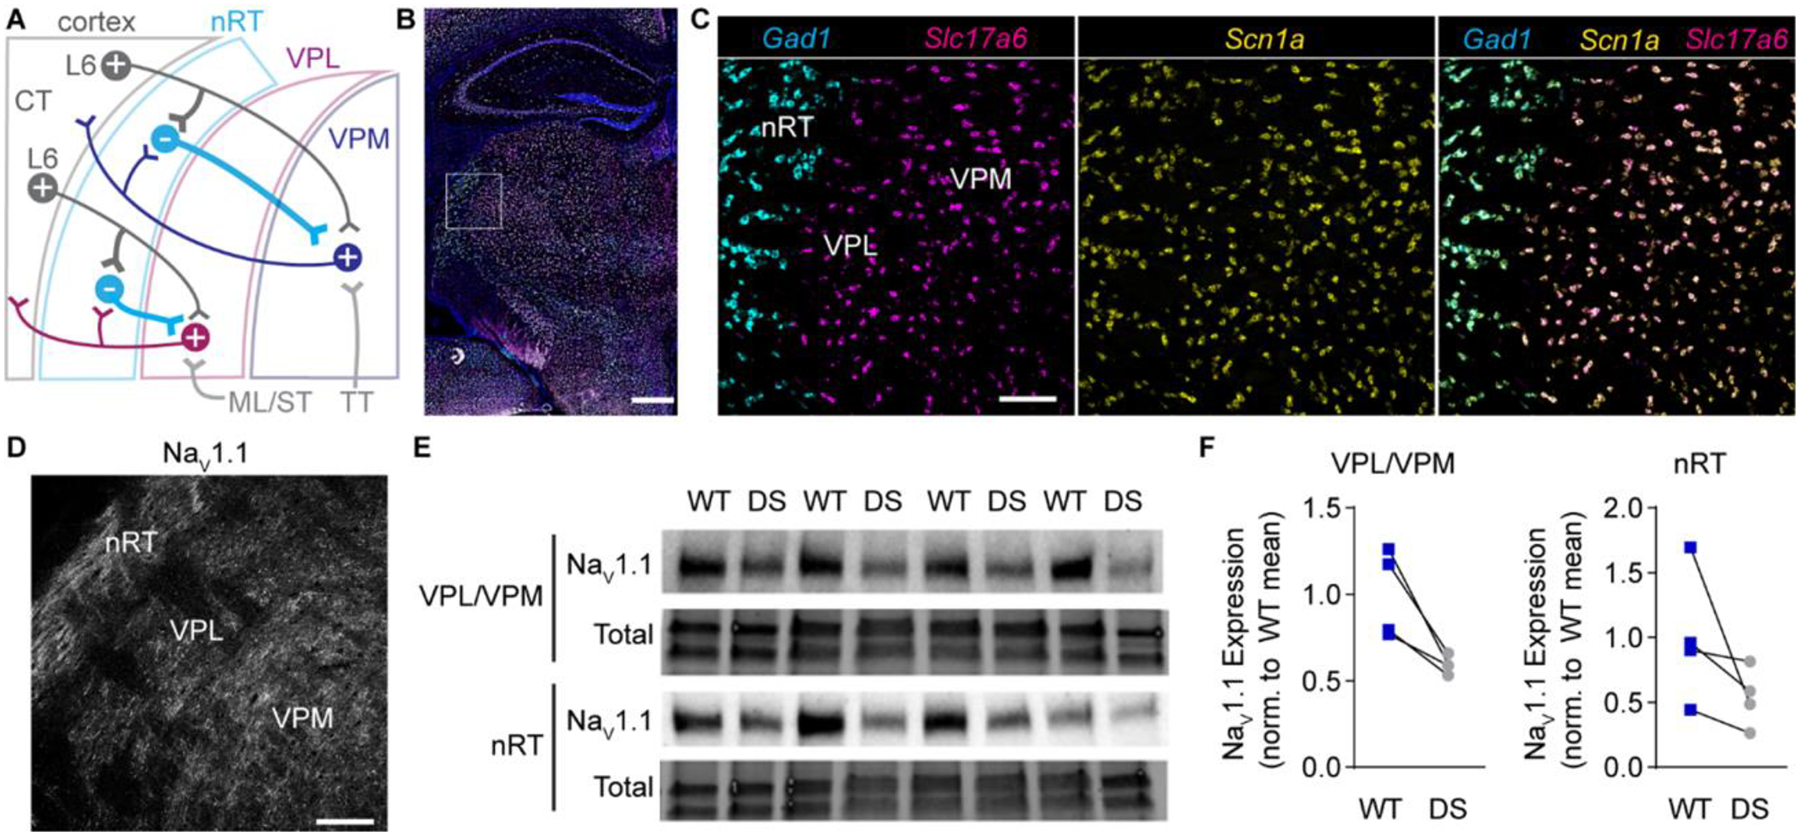
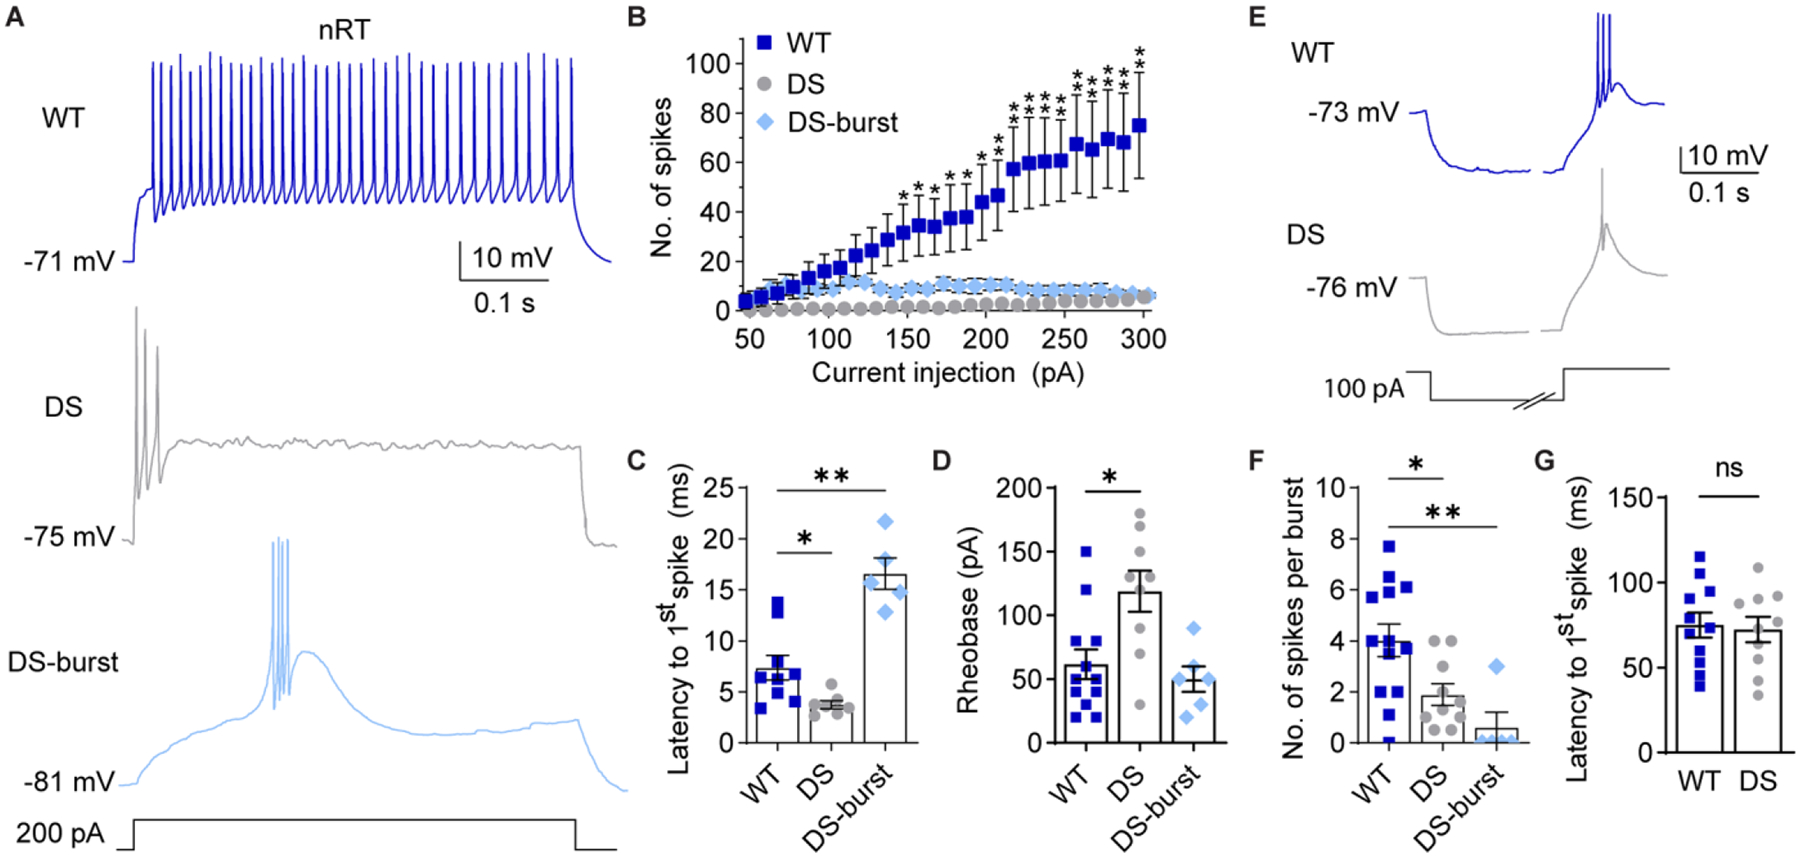
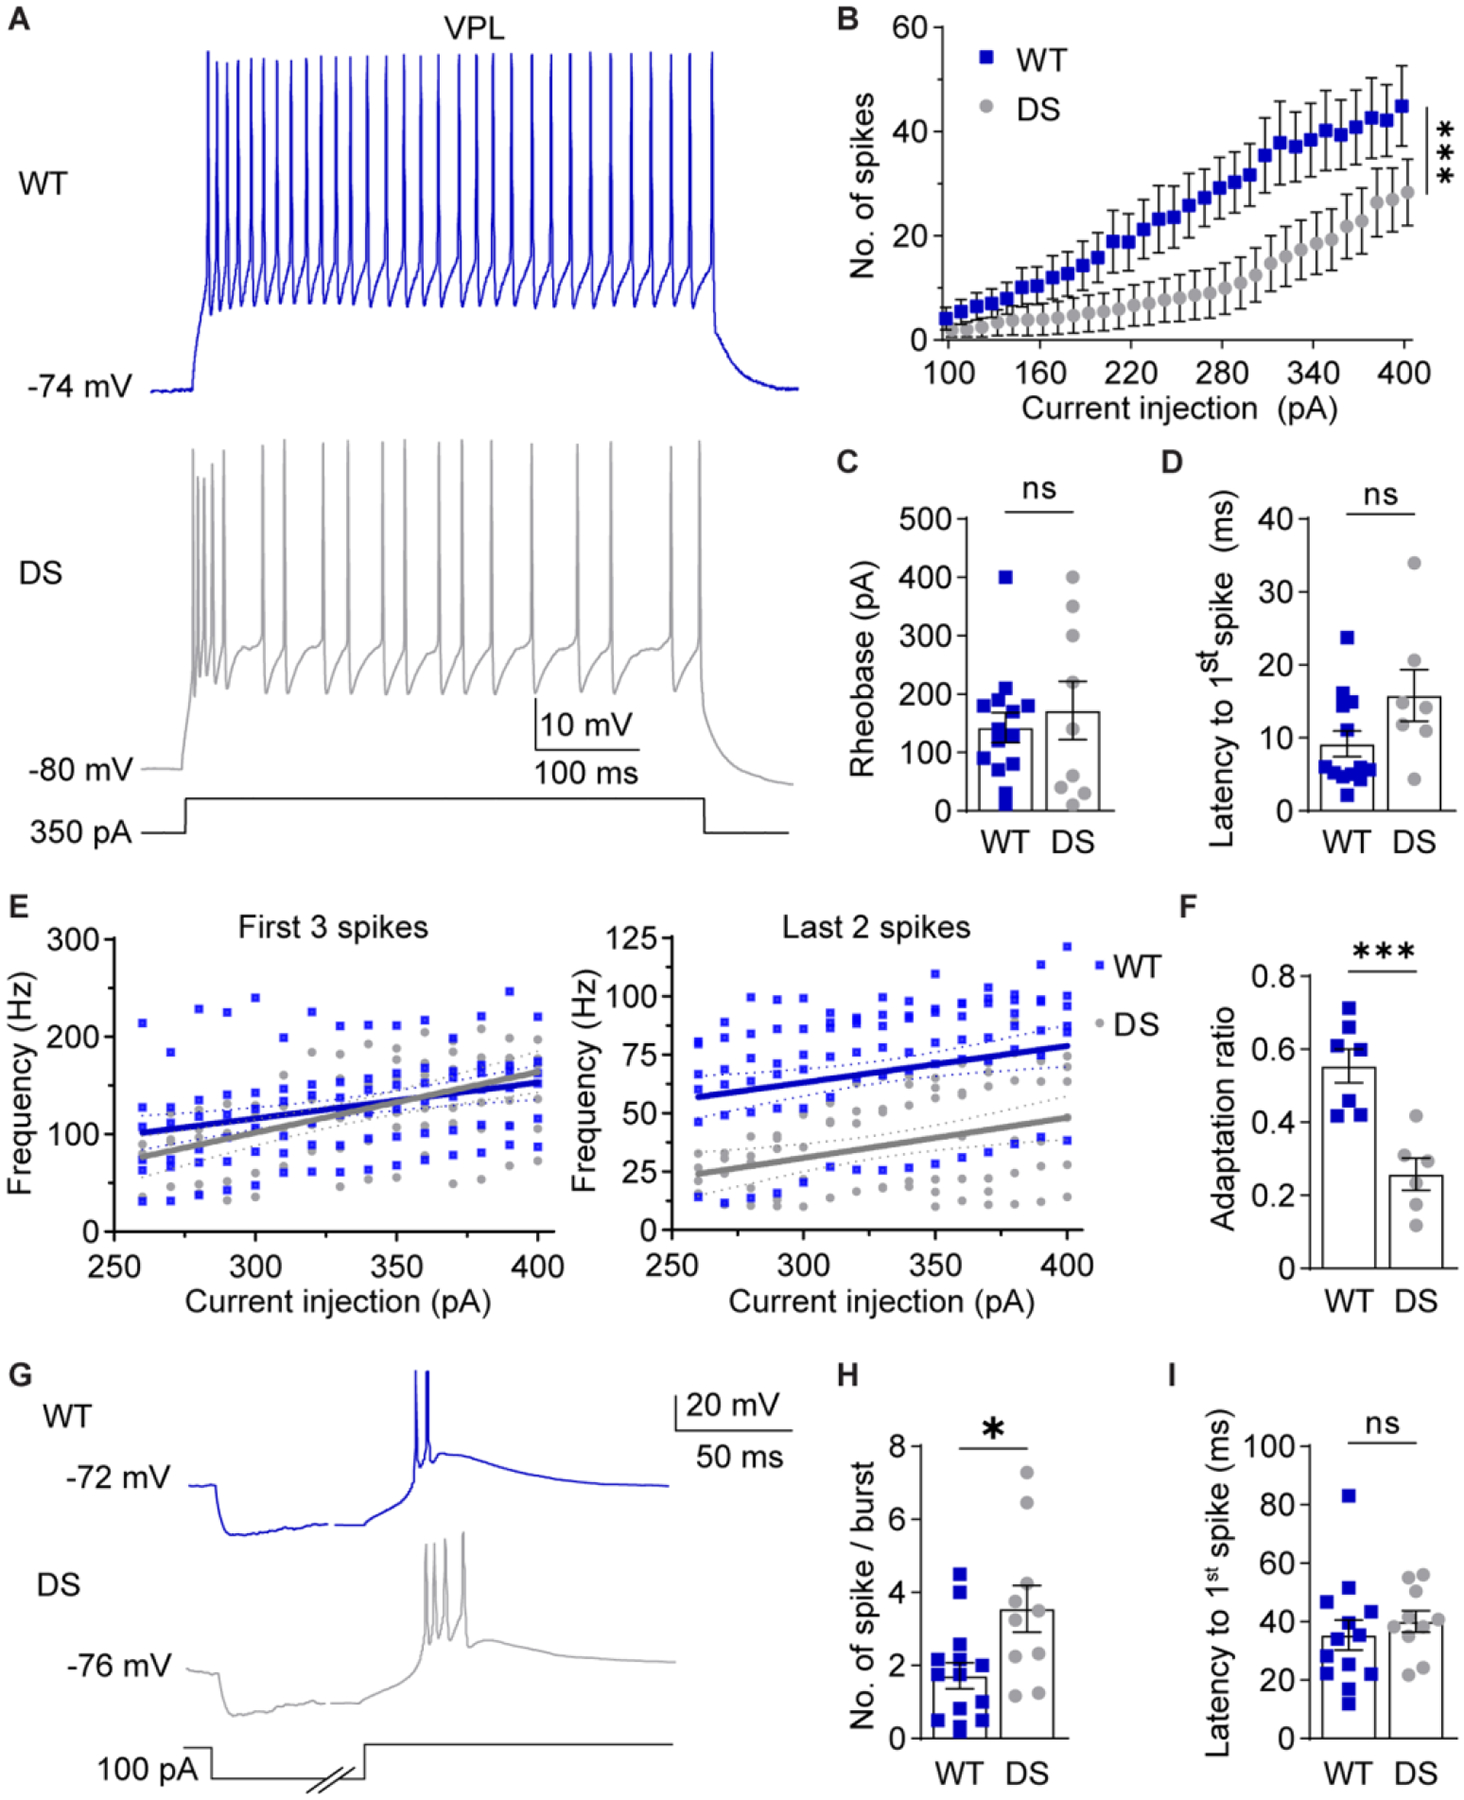
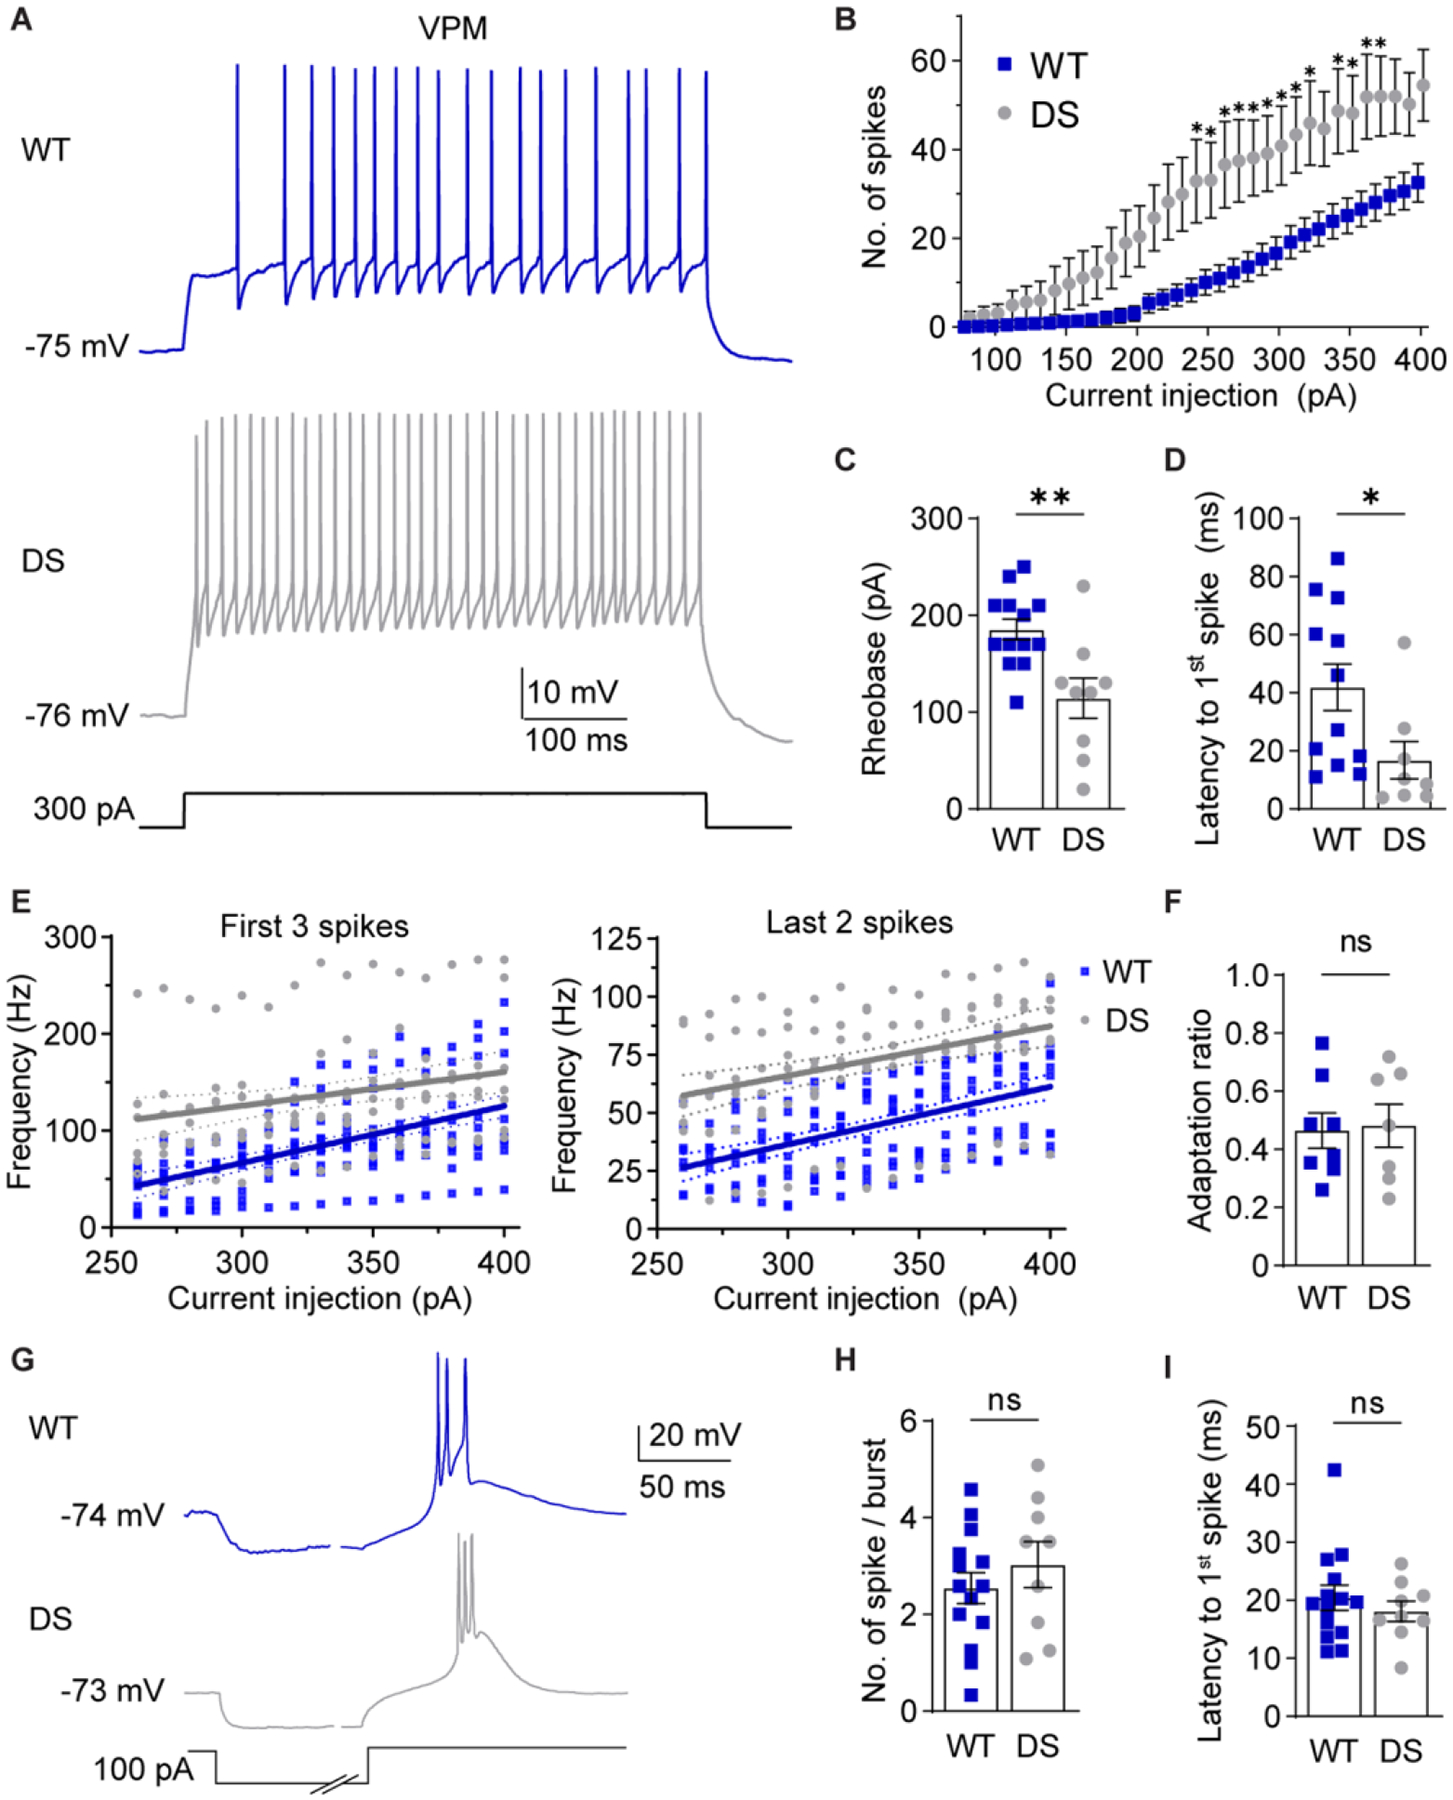
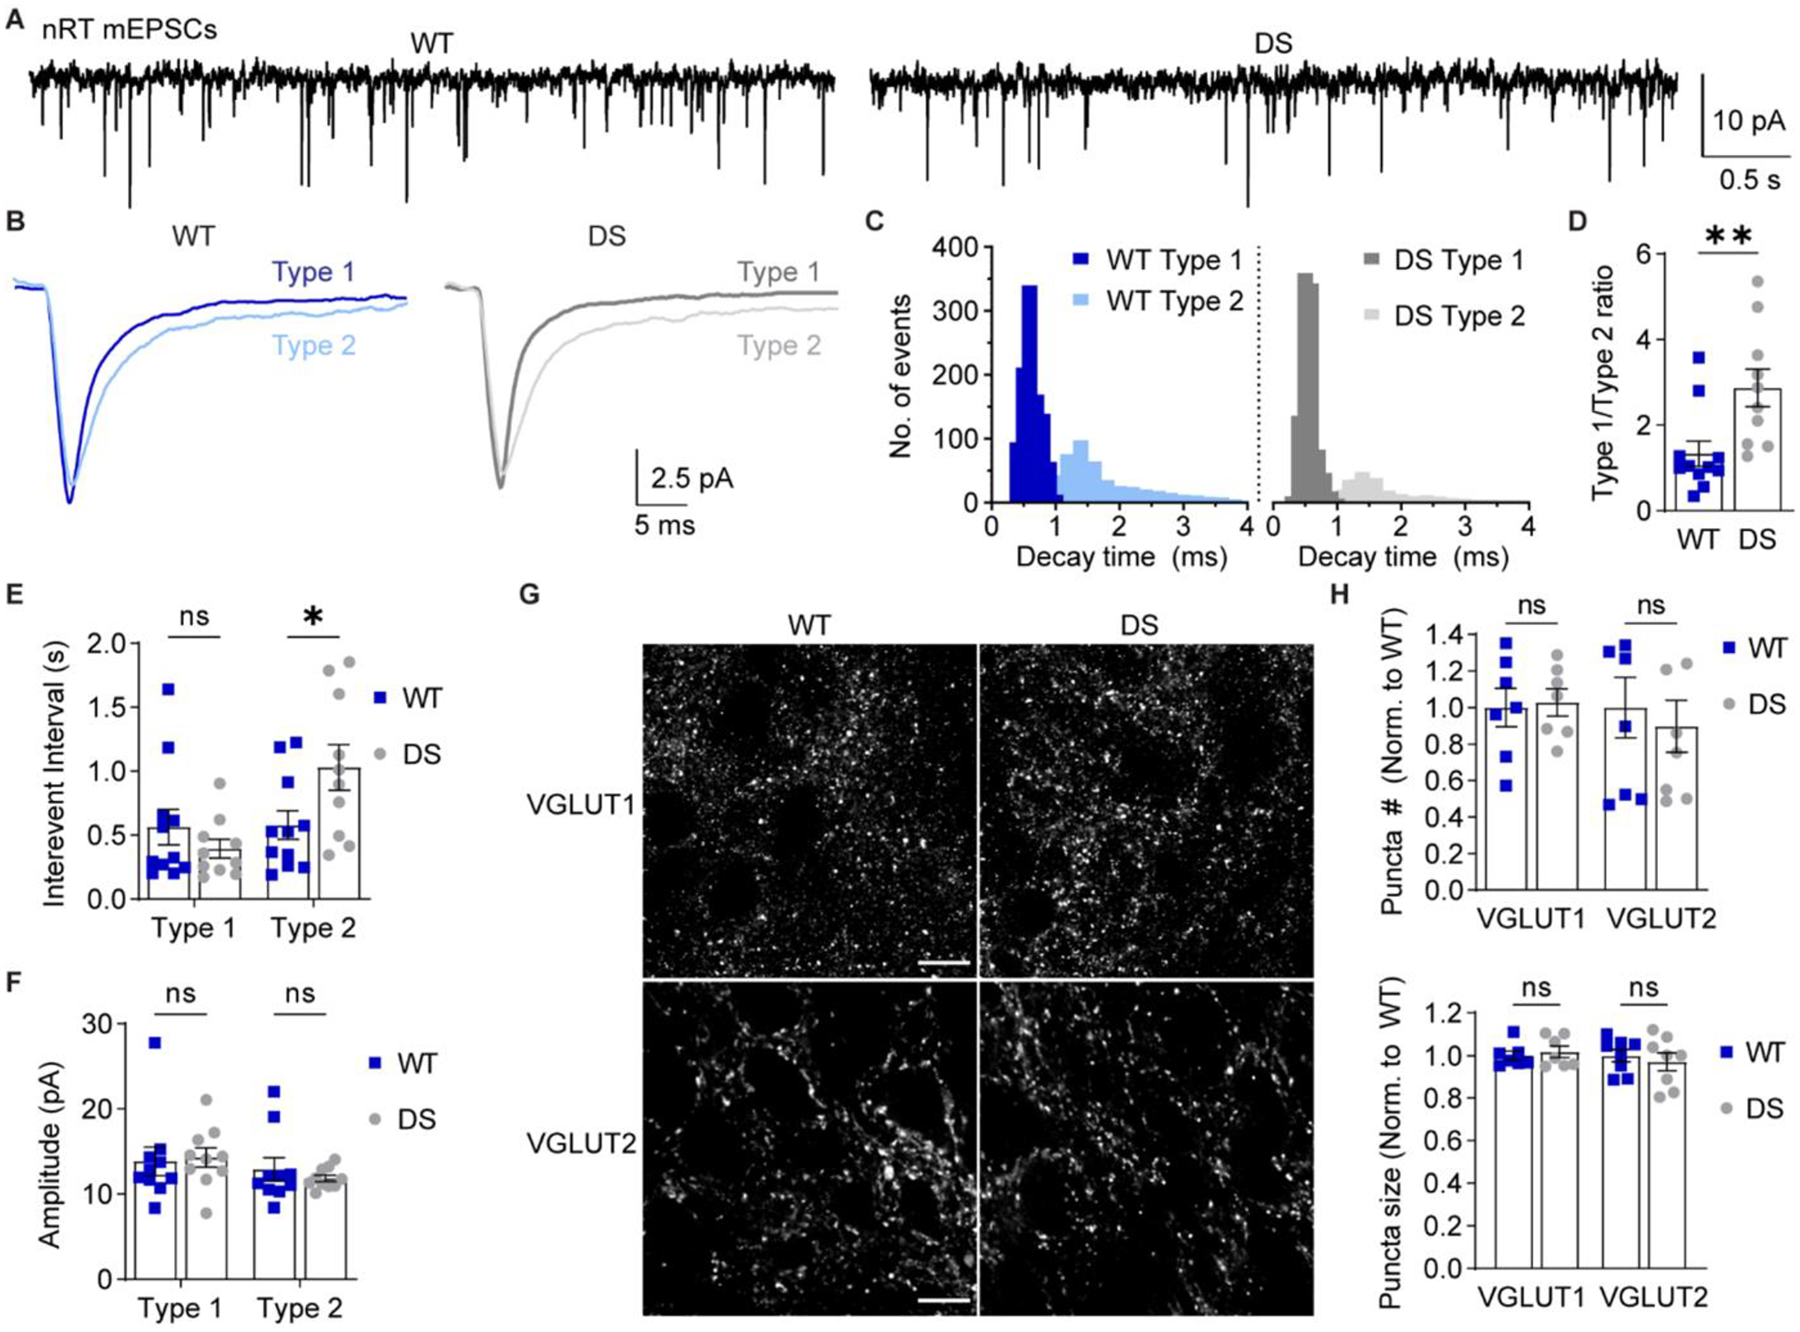
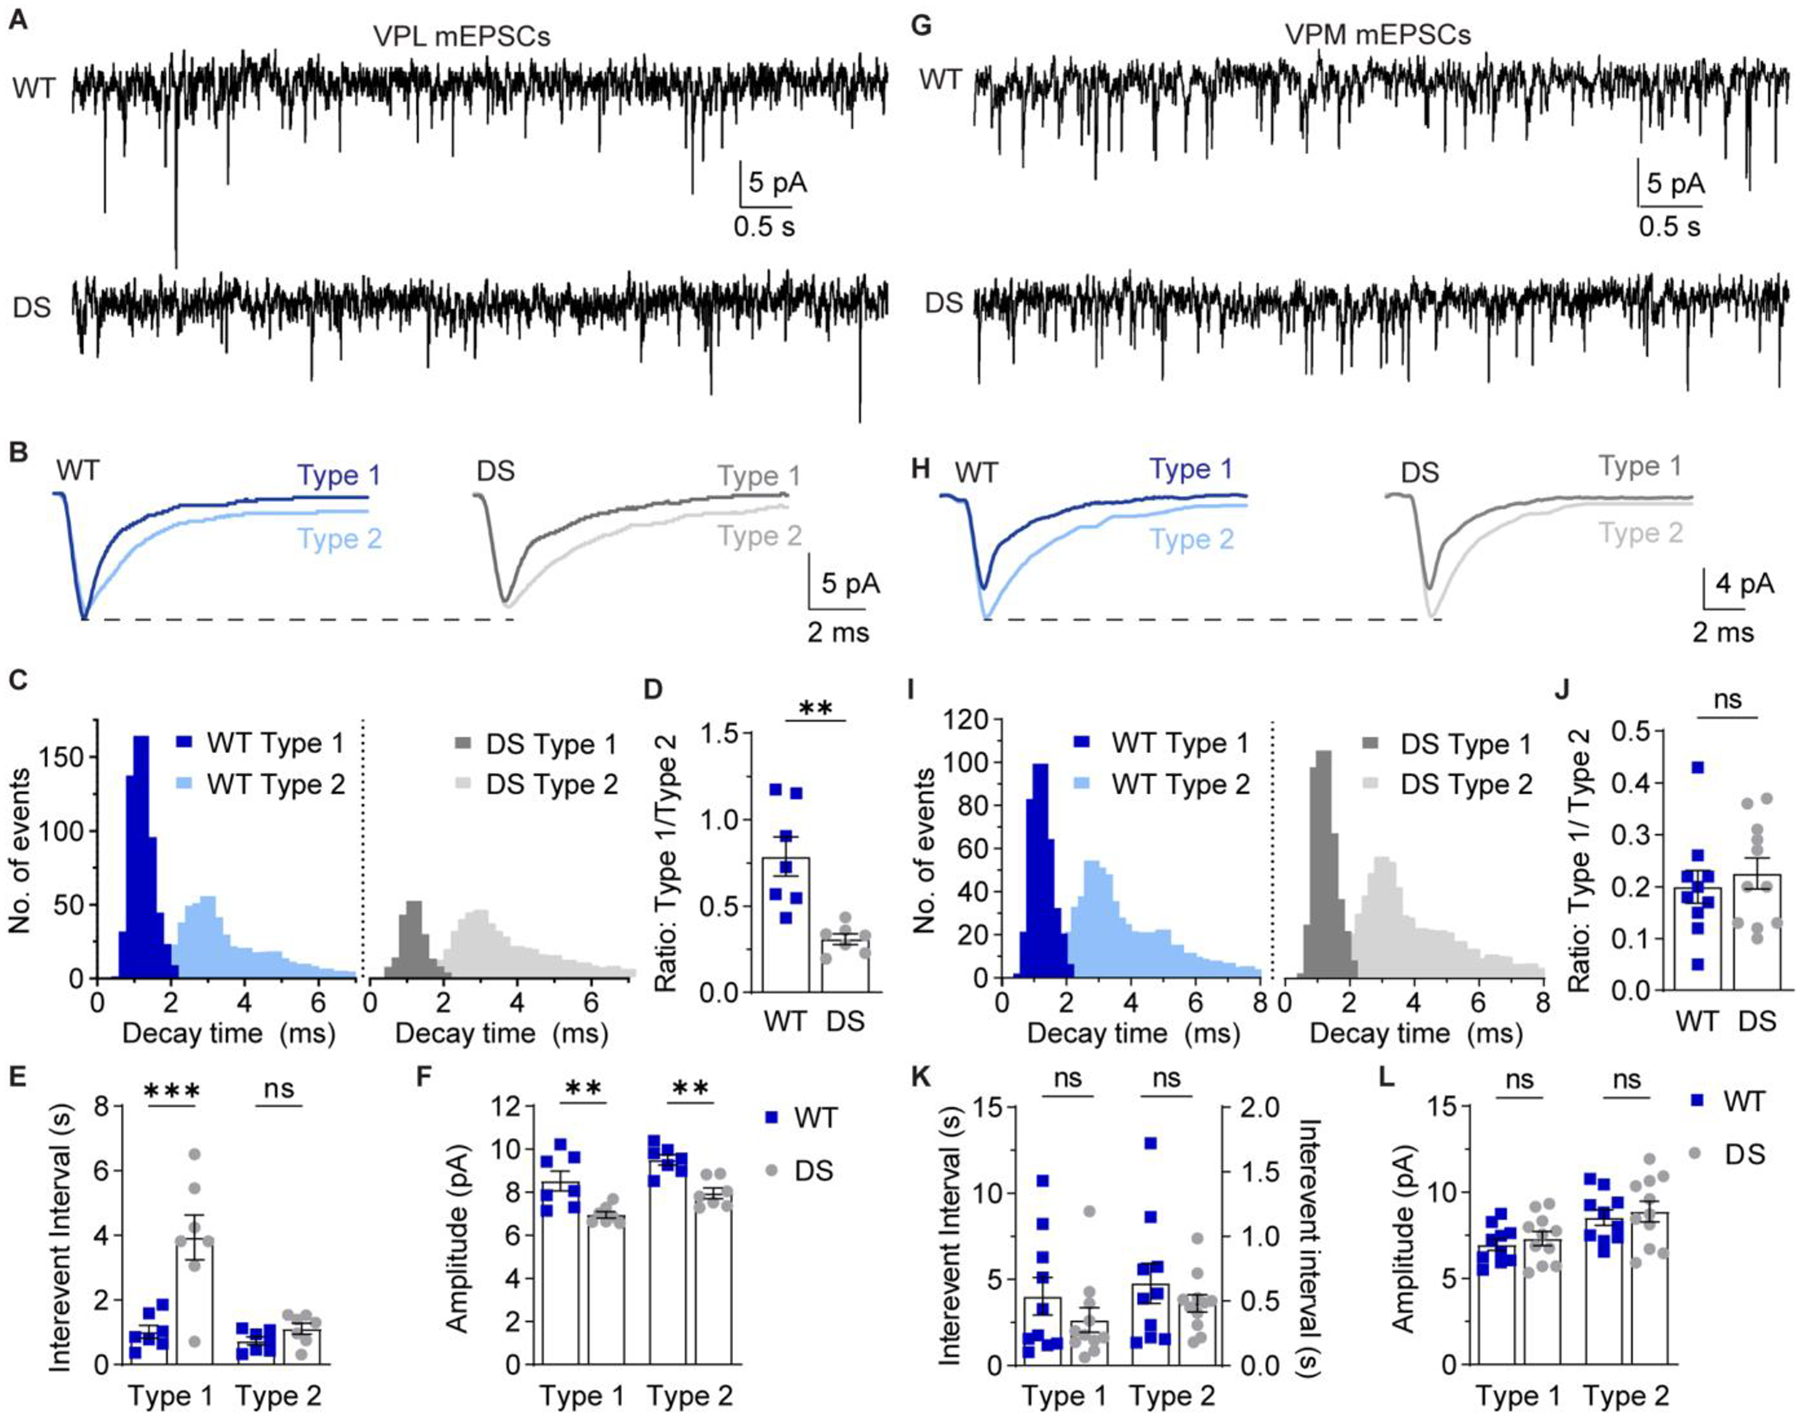
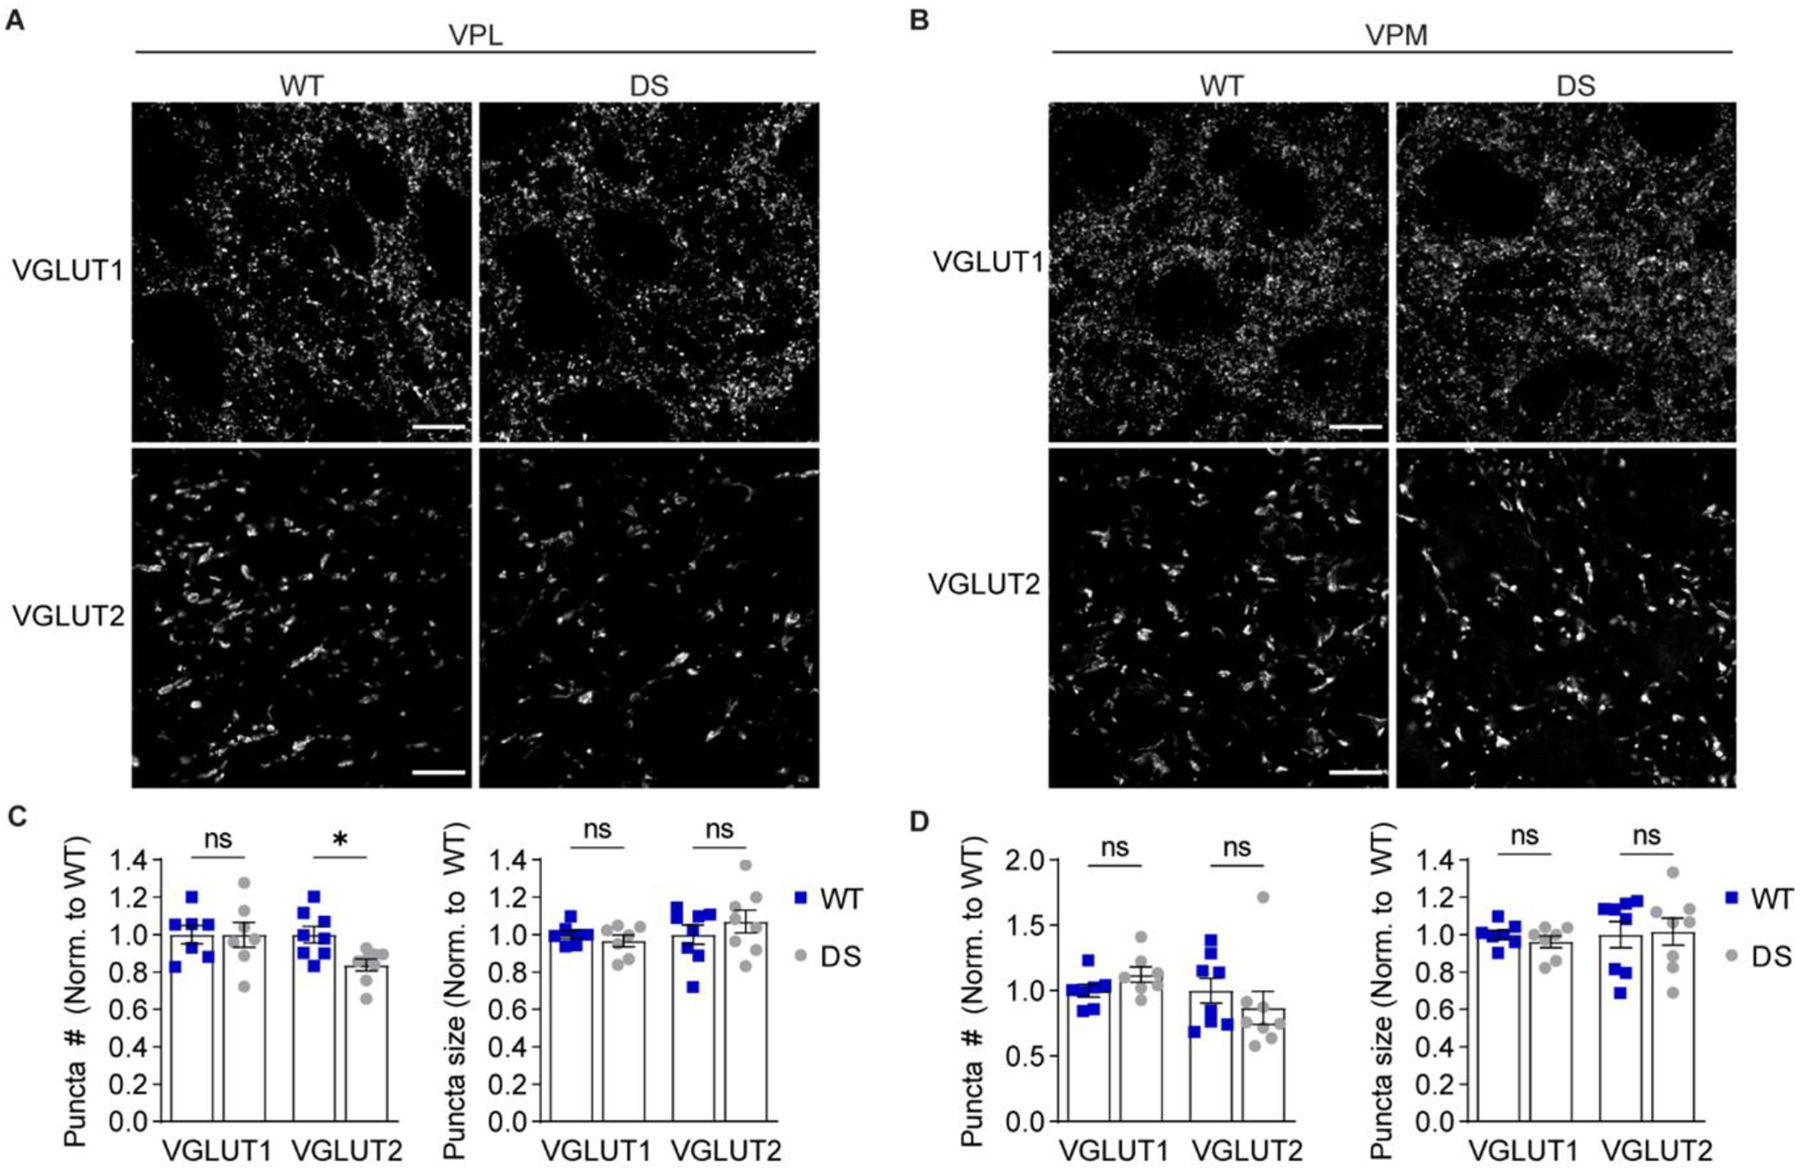
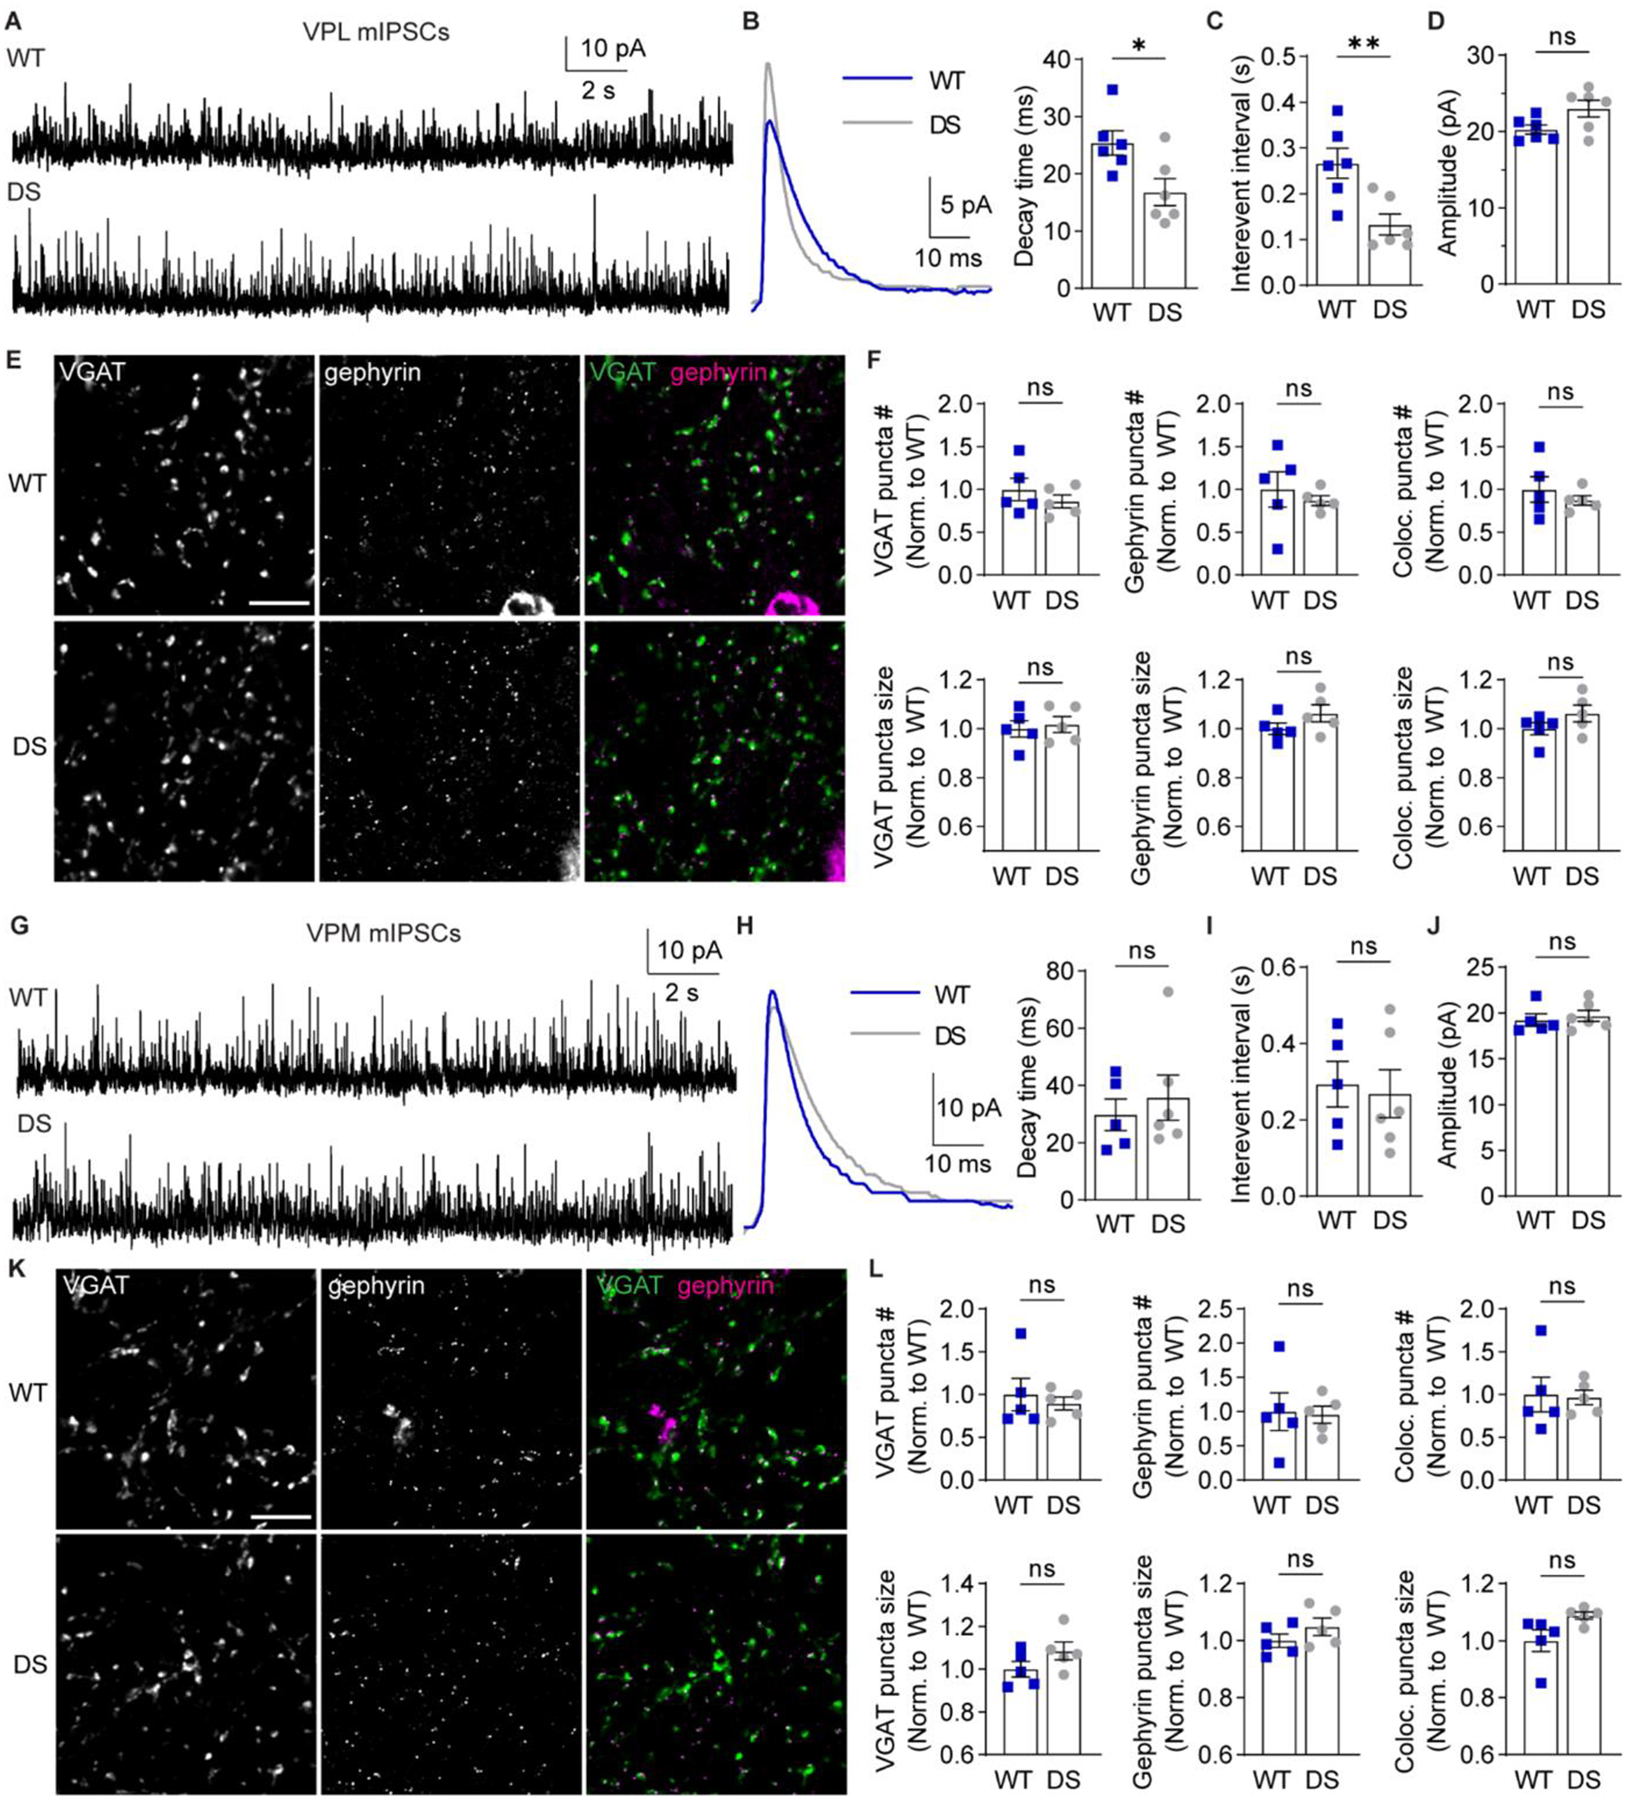
Thalamocortical network dysfunction contributes to seizures and sleep deficits in Dravet syndrome (DS), an infantile epileptic encephalopathy, but the underlying molecular and cellular mechanisms remain elusive. DS is primarily caused by mutations in the SCN1A gene encoding the voltage-gated sodium channel NaV1.1, which is highly expressed in GABAergic reticular thalamus (nRT) neurons as well as glutamatergic thalamocortical neurons. We hypothesized that NaV1.1 haploinsufficiency alters somatosensory corticothalamic circuit function through both intrinsic and synaptic mechanisms in nRT and thalamocortical neurons. Using Scn1a heterozygous mice of both sexes aged P25-P30, we discovered reduced excitability of nRT neurons and thalamocortical neurons in the ventral posterolateral (VPL) thalamus, while thalamocortical ventral posteromedial (VPM) neurons exhibited enhanced excitability. NaV1.1 haploinsufficiency enhanced GABAergic synaptic input and reduced glutamatergic input to VPL neurons, but not VPM neurons. In addition, glutamatergic input to nRT neurons was reduced in Scn1a heterozygous mice. These findings introduce alterations in glutamatergic synapse function and aberrant glutamatergic neuron excitability in the thalamus as disease mechanisms in DS, which has been widely considered a disease of GABAergic neurons. This work reveals additional complexity that expands current models of thalamic dysfunction in DS and identifies new components of corticothalamic circuitry as potential therapeutic targets.

Keywords: Dravet syndrome; Excitability; GABAergic; Glutamatergic; Na(V)1.1; Reticular thalamus; SCN1A; Somatosensory thalamus; Synaptic transmission; Thalamocortical neuron.


Conflict of interest statement

Declaration of interests

None

Figures

Figure 1.
Figure 1.. Scn1a mRNA and NaV1.1 protein expression in the somatosensory thalamus.
A. A circuit diagram illustrates somatosensory corticothalamic (CT) circuit connectivity. Layer 6 (L6) glutamatergic CT neurons innervate nRT, VPL, and VPM neurons. GABAergic nRT neurons innervate VPL and VPM neurons, which send glutamatergic projections to the cortex and collaterals to the nRT. Ascending glutamatergic sensory afferents from the medial lemniscus and spinothalamic tract (ML/ST) innervate VPL neurons and the trigeminothalamic tract (TT) innervates VPM neurons. B. A representative 20X tiled image of a coronal mouse brain section shows Scn1a (yellow), Gad1 (cyan), and Slc17a6 (magenta) mRNA labeled by FISH with DAPI counterstain (blue). Scale bar: 500 μm. C. 20X images of the boxed region in panel B show that Gad1+ and Slc17a6+ neurons express Scn1a mRNA. D. A representative 20X image shows NaV1.1 immunolabeling in the nRT, VPL, and VPM. Scale bar: 100 μm (C, D). E. A western blot shows NaV1.1 and total protein expression in nRT and VPL/VPM tissue punches from WT and DS mice (n = 4 littermate pairs). F. NaV1.1 protein levels were quantified by densitometry and normalized
Figure 2.
Figure 2.. nRT neuron excitability is altered in DS mice.
A. Representative traces show nRT neuron spike firing in response to depolarizing current injections from RMP. B. The number of spikes at each current injection for WT (n = 9 cells from 6 mice), DS non-burst firing cells (labeled DS, n = 8 cells from 6 mice), and DS burst firing neurons (DS-burst, n = 5 cells from 4 mice) were analyzed by mixed-effects analysis for repeated measures (Genotype: F(2,18) = 6.431, p = 0.008, Current x genotype: F(50,440) = 6.051, p < 0.001) with posthoc Dunnett’s tests at each current injection. *p<0.05 for WT vs. DS, **p< 0.05 for both WT vs. DS and WT vs. DS-burst. C. Latency to the first spike was quantified and analyzed by one-way ANOVA: F(2,17) = 20.38, p = 0.001; posthoc Dunnett’s tests, *p = 0.034, **p = 0.015. D. Rheobase was quantified for WT (n = 12 cells from 8 mice), DS (n = 9 cells from 7 mice), and DS-burst (n = 6 cells from 5 mice), and analyzed by one-way ANOVA: F(2,24) = 7.016, p = 0.004; posthoc Dunnett’s tests, *p = 0.007, WT vs. DS-burst: p = 0.800. E. Representative traces show rebound burst firing upon recovery from 500 ms hyperpolarizing current injections. The time axis was broken to facilitate displaying both the hyperpolarization and spike periods. F. The number of spikes per burst were compared by the Kruskal-Wallis test (H = 13.94, p = 0.001), due to non-normal distribution of the data (Shapiro-Wilk test, p < 0.001), and posthoc Dunn’s tests: *p = 0.041, **p = 0.001 (WT: n = 13 cells from 8 mice, DS: n = 10 from 8 mice, DS-burst: n = 5 from 5 mice). G. Latency to the first spike for WT and DS groups were compared by an unpaired t-test (p = 0.803). The symbols in all bar graphs represent individual neurons.
Figure 3.
Figure 3.. NaV1.1 haploinsufficiency alters VPL neuron excitability.
A. Representative traces show WT and DS VPL neuron spike firing in response to depolarizing current injections at RMP. B. The number of spikes fired by VPL neurons across current injections were analyzed by two-way repeated measures ANOVA (WT: n = 13 cells from 7 mice; DS: n = 8 cells from 6 mice; Genotype: F(1,19) = 3.605; p = 0.07, Interaction: F(30,570) = 2.200; ***p < 0.001) and posthoc Sidak’s tests at each current injection (p > 0.05 at each current amplitude). C. Rheobase was analyzed by unpaired t-test for WT (n = 14 cells from 7 mice) and DS (n = 9 cells from 6 mice) neurons (p = 0.571). D. Latency was analyzed by Mann-Whitney test (p = 0.183) due to failed normality (Shapiro-Wilk test, p = 0.026). E. The frequency of the first 3 spikes and last 2 spikes were plotted for each cell across current injections. Linear regression of WT and DS data yielded the plotted lines with 95% confidence interval (CI) bands, and fits were compared by sum of squares F tests. First 3 spikes: F (2,176) = 1.600, p = 0.205. Last 2 spikes: F (2,161) = 42.89, p < 0.001. F. Spike frequency adaptation ratios (last 2 spikes/first 3 spikes) were averaged across all current injections for each cell and compared by an unpaired t-test (***p < 0.001). G. Representative traces show rebound burst firing at RMP upon recovery from hyperpolarization. The time axis was broken to facilitate displaying the hyperpolarization and spike periods. H. Spikes per burst (*p = 0.01) and (I) burst latency (p = 0.49) were compared by unpaired t-tests (WT: n = 13 cells from 7 mice; DS: n = 10 cells from 6 mice). The symbols in all bar graphs
Figure 4.
Figure 4.. NaV1.1 haploinsufficiency alters VPM neuron excitability.
A. Representative traces show VPM spike firing in response to depolarizing current injections from RMP. B. The number of spikes at each current injection was analyzed by a two-way repeated measures ANOVA (WT: n = 12 cells from 8 mice; DS: n = 9 from 5 mice; Genotype: F(1,19) = 7.992, p = 0.011, Interaction: F(32,608) = 4.677, p < 0.001) with posthoc Sidak’s tests at each current injection (*p < 0.05). C. Rheobase for WT (n = 13 cells from 8 mice) and DS (n = 9 cells from 5 mice) neurons were analyzed by unpaired t-test (**p = 0.004). D. Spike latency for WT (n = 12 cells from 8 mice) and DS (n = 8 cells from 5 mice) neurons were compared by an unpaired t-test (*p = 0.037). E. The frequency of the first 3 spikes and last 2 spikes were plotted for each cell across current injections. Linear regression of WT and DS data yielded the plotted lines with 95% CI bands, and fits were compared by sum of squares F tests. First 3 spikes: F (2,244) = 36.50, p < 0.001. Last 2 spikes: F (2,244) = 59.13, p < 0.001. F. Spike frequency adaptation ratios (last 2 spikes/first 3 spikes) were averaged across all current injections for each cell and compared by an unpaired t-test (p =0.860). G. Representative traces show rebound burst firing upon recovery from hyperpolarization. H. Spikes per burst (p = 0.39) and (I) burst latency (p = 0.46, WT: n = 14 cells from 8 mice, DS: n = 9 cells from 5 mice) were analyzed by unpaired t-tests. The symbols in all bar graphs represent individual neurons.
Figure 5.
Figure 5.. Selective reduction in Type 2 nRT mEPSC frequency in DS mice.
A. mEPSCs were recorded from nRT neurons in acute brain slices in the presence of TTX. B. Representative traces show ensemble averages of WT and DS Type 1 and Type 2 mEPSCs as determined by decay time. C. The decay time distributions from each cell were averaged for WT and DS groups to generate the depicted histogram of the mean number of events per cell (bin size = 0.1 ms). D. The ratio of Type 1/Type 2 events for WT (n = 11 cells from 6 mice) and DS (n = 10 cells from 6 mice) neurons were compared by unpaired t-test (*p = 0.008). E. Mean inter-event interval and (F) amplitude values for Type 1 and Type 2 mEPSCs were analyzed by two-way ANOVA with posthoc Sidak’s tests. Inter-event interval: Genotype F(1,38) = 1.169, p = 0.286; Interaction F(1,38) = 5.619, p = 0.023; Type 1 WT vs. DS: p = 0.600; Type 2 WT vs. DS: *p = 0.039. Amplitude: Genotype F(1,38) = 0.0699, p = 0.795; Interaction F(1,38) = 0.388, p = 0.538. See Supplementary Figure S3 for cumulative distributions of inter-event interval and amplitude data. G. Representative 100X images depict VGLUT1 and VGLUT2 staining in WT and DS nRT. Scale bar: 10 μm. H. The number and size of VGLUT1 and VGLUT2 puncta (n = 7 mice) were analyzed by two-way ANOVA. Puncta number: Genotype: F(1,26) = 0.081, p = 0.78; Interaction: F(1,26) = 0.250, p = 0.620. Puncta size: Genotype: F(1,26) = 0.031, p = 0.86; Interaction: F(1,26) = 0.545, p = 0.47. Data points in the bar graphs represent individual neurons (D-F) or mice (H).
Figure 6.
Figure 6.. VPL neurons in DS mice exhibit reduced glutamatergic synaptic transmission.
A. mEPSCs were recorded from VPL neurons in acute brain slices in the presence of 1 μM TTX. B. Representative traces show ensemble averages of WT and DS Type 1 and Type 2 VPL mEPSCs as determined by decay times. C. The decay time distributions from each cell were averaged for WT and DS groups to generate histograms of the mean number of events per cell (bin size = 0.2 ms). D. The ratio of Type 1 to Type 2 events was quantified for each WT (n = 7 cells from 6 mice) and DS neuron (n = 7 cells from 7 mice) and analyzed by unpaired t-test (**p = 0.002). E. Inter-event interval and (F) amplitude values for Type 1 and Type 2 mEPSCs in VPL neurons were analyzed by two-way ANOVA with posthoc Sidak’s tests. Inter-event interval: Genotype F(1,24) = 19.28, p < 0.001; Interaction F(1,24) = 11.42, p = 0.002; Type 1 WT vs. DS: ***p < 0.001; Type 2 WT vs. DS: p = 0.73. Amplitude: Genotype F(1, 24) = 27.15, p < 0.001; Interaction F(1,24) = 0.002, p = 0.969. Type 1 WT vs. DS: **p = 0.002; Type 2 WT vs. DS: **p = 0.003. G. mEPSCs were recorded from VPM neurons and (H) representative traces show ensemble averages of WT and DS Type 1 and Type 2 mEPSCs. I. The decay time distributions from each cell were averaged for WT and DS groups to generate histograms of the mean number of events per cell (bin size = 0.2 ms). J. Type 1/Type 2 event ratios for WT (n = 10 cells from 8 mice) and DS (n = 11 cells from 9 mice) VPM neurons were analyzed by unpaired t-test (p = 0.57). K. Inter-event interval and (L) amplitude values for Type 1 and Type 2 mEPSCs in VPM neurons were analyzed by two-way ANOVA with posthoc Sidak’s tests. Inter-event interval: Genotype F(1,38) = 1.407, p = 0.243; Interaction F(1,38) = 0.893, p = 0.351; Type 1 WT vs. DS: p = 0.261; Type 2 WT vs. DS: p = 0.982. Amplitude: Genotype F(1, 38) = 0.573, p = 0.454; Interaction F(1,38) < 0.001, p = 0.993. Type 1 WT vs. DS: p = 0.840; Type 2 WT vs. DS: p = 0.833. See Supplementary Figure S5 for cumulative distribution inter-event interval and amplitude
Figure 7.
Figure 7.. DS mice exhibit reduced ascending sensory input to the VPL.
Representative 100X images show VGLUT1 (scale bar: 10 μm) and VGLUT2 (scale bar: 20 μm) immunostaining in the (A) VPL and (B) VPM. The number and size of VGLUT1 and VGLUT2 puncta were quantified for the (C) VPL and (D) VPM (n = 7) and analyzed by two-way ANOVA. VPL puncta number: Genotype F(1,26) = 2.914, p = 0.10; Interaction F(1,26) = 2.829, p = 0.10; posthoc Sidak’s tests: VGLUT1, p = 0.99; VGLUT2, *p = 0.04. VPL puncta size: Genotype: F(1,26) = 0.161, p = 0.69; Interaction: F(1,26) = 1.262, p = 0.27; posthoc Sidak’s tests: VGLUT1, p = 0.86; VGLUT2, p = 0.47. VPM puncta number: Genotype: F(1,26) = 0.002, p = 0.96; Interaction: F(1,26) = 1.9, p = 0.18; posthoc Sidak’s tests: VGLUT1, p = 0.60; VGLUT2, p = 0.52. VPM puncta size: Genotype: F(1,26) = 0.040, p = 0.84; Interaction: F(1,26) = 0.221, p = 0.64; posthoc Sidak’s tests: VGLUT1, p = 0.88; VGLUT2, p = 0.98. Data points in all bar graphs represent individual mice.
Figure 8.
Figure 8.. VPL neurons in DS mice exhibit reduced GABAergic synaptic transmission.
A. mIPSCs were recorded from VPL neurons in acute brain slices in the presence of 1 μM TTX. B. Representative traces show ensemble averages of WT and DS mIPSCs. mIPSC ensemble averages were fitted to determine decay time for WT and DS neurons (n = 6 cells from 5 mice) and compared by unpaired t-test (*p = 0.02). WT and DS mIPSC (C) inter-event interval (**p = 0.008) and (D) amplitude (p = 0.054) were quantified for each neuron and compared by unpaired t-tests. E. Representative 100X images show VGAT and gephyrin immunolabeling in the VPL (scale bar: 10 μm). F. The number and size of VGAT, gephyrin, and VGAT-gephryin colocalized puncta in the VPL (n = 5 mice) were compared by unpaired t-tests. VGAT puncta number: p = 0.39, size: p = 0.72; gephyrin puncta number: p = 0.56, size p = 0.17; colocalized puncta number: p = 0.44, size: p = 0.18. G. mIPSCs were recorded from VPM neurons, and (H) representative traces show ensemble averages of WT and DS mIPSCs. mIPSC ensemble averages were fitted to determine decay time for WT (n = 5 cells from 5 mice) and DS (n = 6 cells from 6 mice) neurons and compared by an unpaired t-test (p = 0.57). I. WT and DS inter-event interval (p = 0.785) and (J) amplitude (p = 0.635) were compared by unpaired t-tests. K. Representative 100X images show VGAT (scale bar: 10 μm) and gephyrin immunolabeling in the VPM. L. The number and size of VGAT, gephyrin, and VGAT-gephryin colocalized puncta were quantified in the VPM (n = 5 mice) and compared by unpaired t-tests. VGAT puncta number: p = 0.62, size: p = 0.16; gephyrin puncta number: p = 0.89, size p = 0.24; colocalized puncta number: p = 0.88, size: p = 0.06. The data points in the bar graphs represent individual neurons (B-D, H-J) or mice (F, L).

References

    1. Ab Aziz CB, and Ahmad AH (2006). The role of the thalamus in modulating pain. Malays J Med Sci 13, 11–18. - PMC - PubMed
    1. Acker TM, Yuan H, Hansen KB, Vance KM, Ogden KK, Jensen HS, Burger PB, Mullasseril P, Snyder JP, Liotta DC, and Traynelis SF (2011). Mechanism for noncompetitive inhibition by novel GluN2C/D N-methyl-D-aspartate receptor subunit-selective modulators. Mol Pharmacol 80, 782–795. 10.1124/mol.111.073239. - DOI - PMC - PubMed
    1. Almog Y, Fadila S, Brusel M, Mavashov A, Anderson K, and Rubinstein M (2021). Developmental alterations in firing properties of hippocampal CA1 inhibitory and excitatory neurons in a mouse model of Dravet syndrome. Neurobiol Dis 148, 105209. 10.1016/j.nbd.2020.105209. - DOI - PubMed
    1. Alshammari MA, Alshammari TK, and Laezza F (2016). Improved Methods for Fluorescence Microscopy Detection of Macromolecules at the Axon Initial Segment. Front Cell Neurosci 10, 5. 10.3389/fncel.2016.00005. - DOI - PMC - PubMed
    1. Azumaya CM, Days EL, Vinson PN, Stauffer S, Sulikowski G, Weaver CD, and Nakagawa T (2017). Screening for AMPA receptor auxiliary subunit specific modulators. PLoS One 12, e0174742. 10.1371/journal.pone.0174742. - DOI - PMC - PubMed

Publication types

Substances