

Real-Time Search-Assisted Acquisition on a Tribrid Mass Spectrometer Improves Coverage in Multiplexed Single-Cell Proteomics
- PMID: 35219906
- PMCID: PMC8961214
- DOI: 10.1016/j.mcpro.2022.100219
Real-Time Search-Assisted Acquisition on a Tribrid Mass Spectrometer Improves Coverage in Multiplexed Single-Cell Proteomics
Abstract
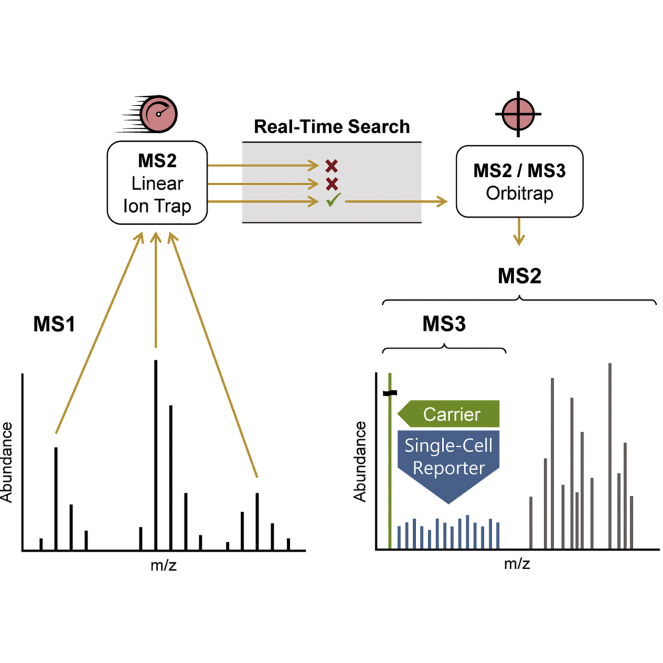
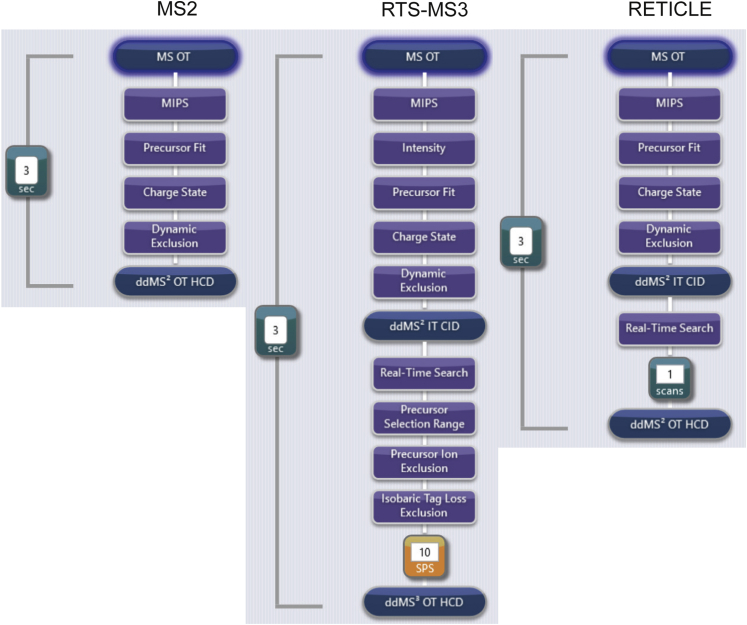
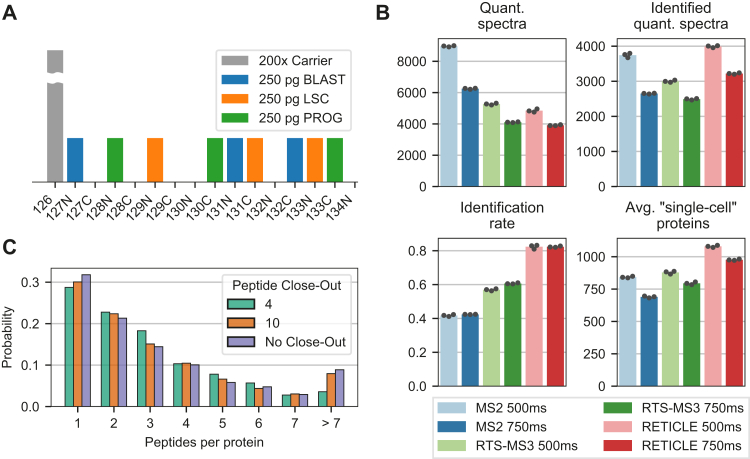
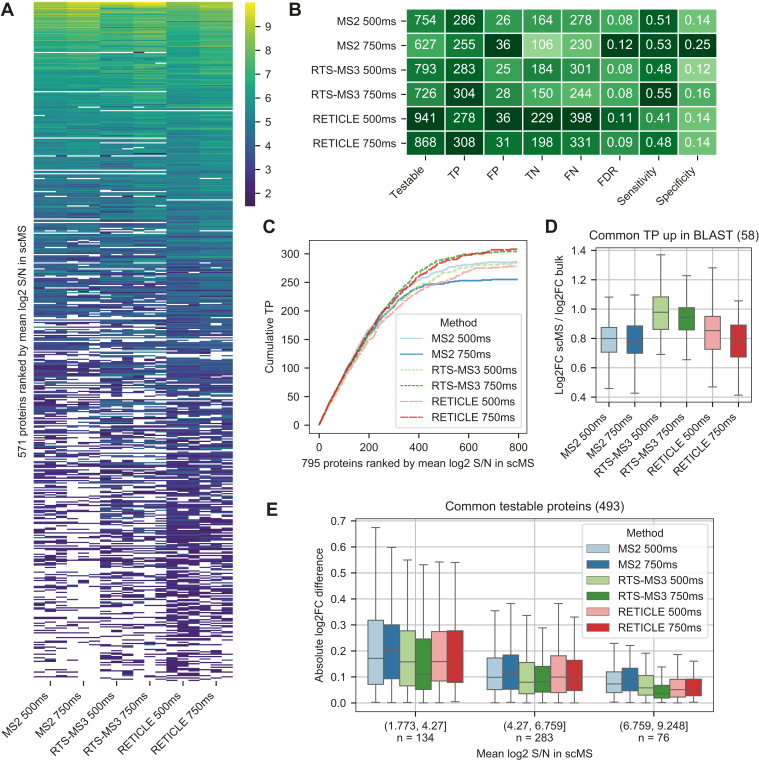
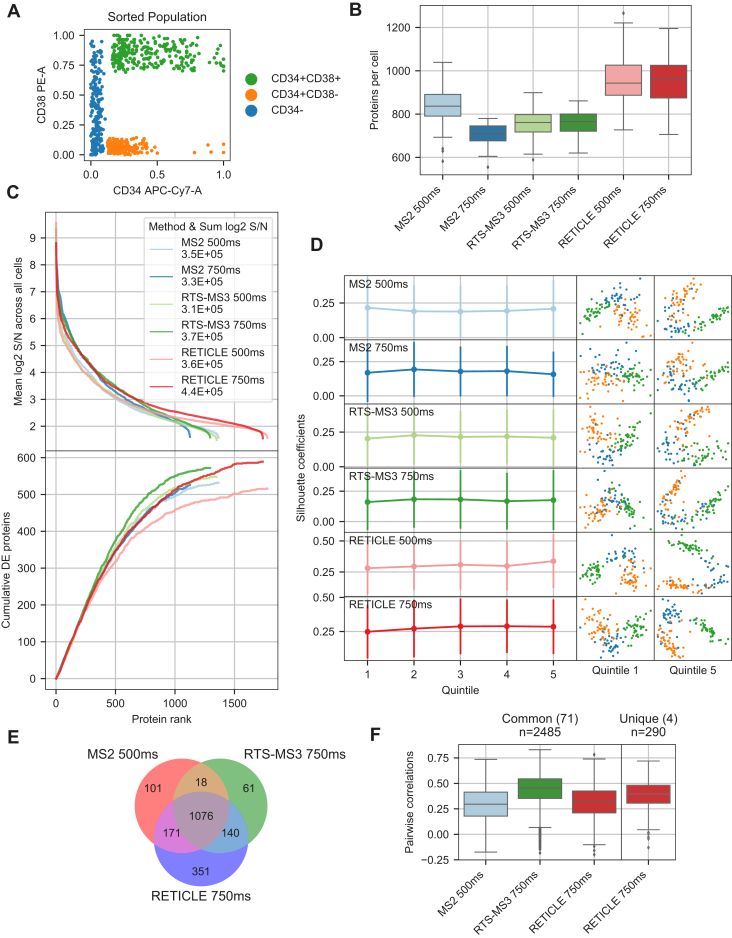
In the young field of single-cell proteomics (scMS), there is a great need for improved global proteome characterization, both in terms of proteins quantified per cell and quantitative performance thereof. The recently introduced real-time search (RTS) on the Orbitrap Eclipse Tribrid mass spectrometer in combination with SPS-MS3 acquisition has been shown to be beneficial for the measurement of samples that are multiplexed using isobaric tags. Multiplexed scMS requires high ion injection times and high-resolution spectra to quantify the single-cell signal; however, the carrier channel facilitates peptide identification and thus offers the opportunity for fast on-the-fly precursor filtering before committing to the time-intensive quantification scan. Here, we compared classical MS2 acquisition against RTS-SPS-MS3, both using the Orbitrap Eclipse Tribrid MS with the FAIMS Pro ion mobility interface and present a new acquisition strategy termed RETICLE (RTS enhanced quant of single cell spectra) that makes use of fast real-time searched linear ion trap scans to preselect MS1 peptide precursors for quantitative MS2 Orbitrap acquisition. We show that classical MS2 acquisition is outperformed by both RTS-SPS-MS3 through increased quantitative accuracy at similar proteome coverage, and RETICLE through higher proteome coverage, with the latter enabling the quantification of over 1000 proteins per cell at an MS2 injection time of 750 ms using a 2 h gradient.
Keywords: SPS-MS3; TMT; isobaric tag quantification; multiplexing; real-time search; single-cell proteomics.
Copyright © 2022 The Authors. Published by Elsevier Inc. All rights reserved.
Conflict of interest statement
Conflict of interest K. M., R. H., D. L. F., and V. Z. are or were employees at Thermo Fisher Scientific. All other authors declare no competing interests.
Figures
Similar articles
-
Comparison of MS2, synchronous precursor selection MS3, and real-time search MS3 methodologies for lung proteomes of hydrogen sulfide treated swine.Anal Bioanal Chem. 2021 Jan;413(2):419-429. doi: 10.1007/s00216-020-03009-5. Epub 2020 Oct 25. Anal Bioanal Chem. 2021. PMID: 33099676
-
TMT-Based Multiplexed (Chemo)Proteomics on the Orbitrap Astral Mass Spectrometer.Mol Cell Proteomics. 2025 May;24(5):100968. doi: 10.1016/j.mcpro.2025.100968. Epub 2025 Apr 8. Mol Cell Proteomics. 2025. PMID: 40210101 Free PMC article.
-
Full-Featured, Real-Time Database Searching Platform Enables Fast and Accurate Multiplexed Quantitative Proteomics.J Proteome Res. 2020 May 1;19(5):2026-2034. doi: 10.1021/acs.jproteome.9b00860. Epub 2020 Apr 6. J Proteome Res. 2020. PMID: 32126768 Free PMC article.
-
Understanding the effect of carrier proteomes in single cell proteomic studies - key lessons.Expert Rev Proteomics. 2022 Jan;19(1):5-15. doi: 10.1080/14789450.2022.2036126. Epub 2022 Feb 9. Expert Rev Proteomics. 2022. PMID: 35089822 Review.
-
Multiplexed and data-independent tandem mass spectrometry for global proteome profiling.Mass Spectrom Rev. 2014 Nov-Dec;33(6):452-70. doi: 10.1002/mas.21400. Epub 2013 Nov 26. Mass Spectrom Rev. 2014. PMID: 24281846 Review.
Cited by
-
Pick-up single-cell proteomic analysis for quantifying up to 3000 proteins in a Mammalian cell.Nat Commun. 2024 Feb 10;15(1):1279. doi: 10.1038/s41467-024-45659-4. Nat Commun. 2024. PMID: 38341466 Free PMC article.
-
scPROTEIN: a versatile deep graph contrastive learning framework for single-cell proteomics embedding.Nat Methods. 2024 Apr;21(4):623-634. doi: 10.1038/s41592-024-02214-9. Epub 2024 Mar 19. Nat Methods. 2024. PMID: 38504113
-
Real-Time Search-Assisted Multiplexed Quantitative Proteomics Reveals System-Wide Translational Regulation of Non-Canonical Short Open Reading Frames.Biomolecules. 2023 Jun 12;13(6):979. doi: 10.3390/biom13060979. Biomolecules. 2023. PMID: 37371559 Free PMC article.
-
Dynamics of Single-Cell Protein Covariation during Epithelial-Mesenchymal Transition.J Proteome Res. 2025 Apr 4;24(4):1519-1527. doi: 10.1021/acs.jproteome.4c00277. Epub 2024 Apr 25. J Proteome Res. 2025. PMID: 38663020 Free PMC article.
-
The GlycoPaSER Prototype as a Real-Time N-Glycopeptide Identification Tool Based on the PaSER Parallel Computing Platform.Int J Mol Sci. 2023 Apr 26;24(9):7869. doi: 10.3390/ijms24097869. Int J Mol Sci. 2023. PMID: 37175577 Free PMC article.
References
-
- Zhu Y., Piehowski P.D., Zhao R., Chen J., Shen Y., Moore R.J., Shukla A.K., Petyuk V.A., Campbell-Thompson M., Mathews C.E., Smith R.D., Qian W.J., Kelly R.T. Nanodroplet processing platform for deep and quantitative proteome profiling of 10-100 mammalian cells. Nat. Commun. 2018;9:882. - PMC - PubMed
-
- Tsai C.F., Zhao R., Williams S.M., Moore R.J., Schultz K., Chrisler W.B., Pasa-Tolic L., Rodland K.D., Smith R.D., Shi T., Zhu Y., Liu T. An improved boosting to amplify signal with isobaric labeling (iBASIL) strategy for precise quantitative single-cell proteomics. Mol. Cell Proteomics. 2020;19:828–838. - PMC - PubMed
Publication types
MeSH terms
Substances
LinkOut - more resources
Full Text Sources
