

Quantitative estimation of pulmonary artery wedge pressure from chest radiographs by a regression convolutional neural network
- PMID: 35220466
- PMCID: PMC9239946
- DOI: 10.1007/s00380-022-02043-w
Quantitative estimation of pulmonary artery wedge pressure from chest radiographs by a regression convolutional neural network
Abstract
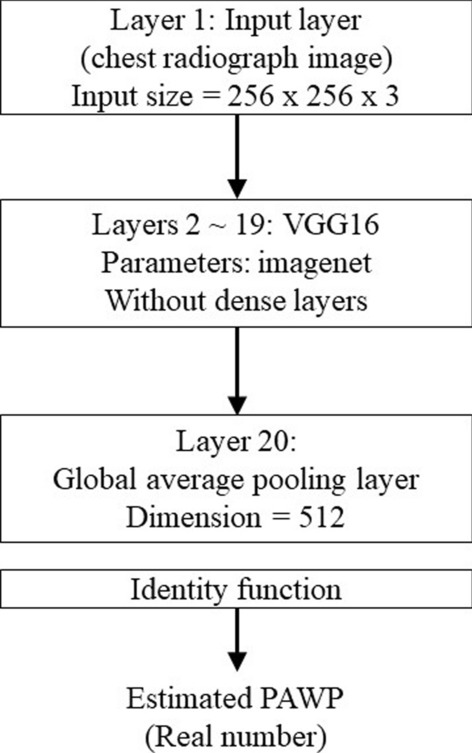
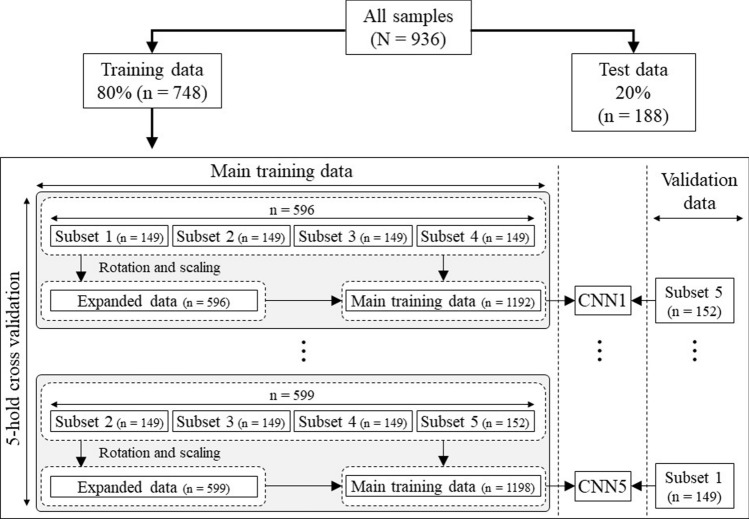
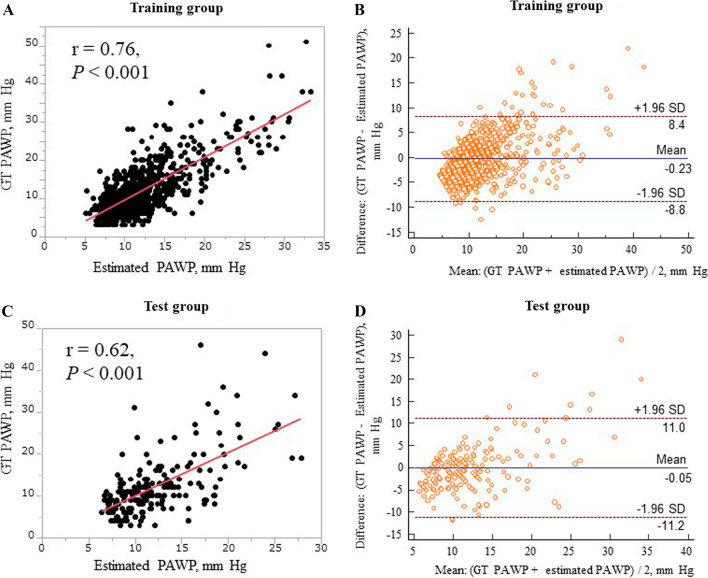
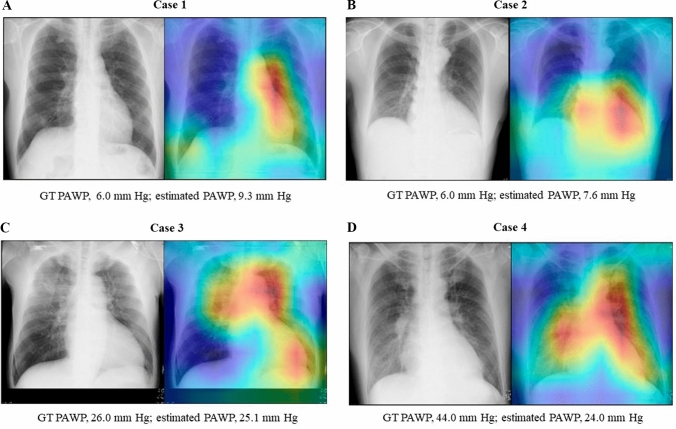
Recent studies reported that a convolutional neural network (CNN; a deep learning model) can detect elevated pulmonary artery wedge pressure (PAWP) from chest radiographs, the diagnostic images most commonly used for assessing pulmonary congestion in heart failure. However, no method has been published for quantitatively estimating PAWP from such radiographs. We hypothesized that a regression CNN, an alternative type of deep learning, could be a useful tool for quantitatively estimating PAWP in cardiovascular diseases. We retrospectively enrolled 936 patients with cardiovascular diseases who had undergone right heart catheterization (RHC) and chest radiography and estimated PAWP by constructing a regression CNN based on the VGG16 model. We randomly categorized 80% of the data as training data (training group, n = 748) and 20% as test data (test group, n = 188). Moreover, we tuned the learning rate-one of the model parameters-by 5-hold cross-validation of the training group. Correlations between PAWP measured by RHC [ground truth (GT) PAWP] and PAWP derived from the regression CNN (estimated PAWP) were tested. To visualize how the regression CNN assessed the images, we created a regression activation map (RAM), a visualization technique for regression CNN. Estimated PAWP correlated significantly with GT PAWP in both the training (r = 0.76, P < 0.001) and test group (r = 0.62, P < 0.001). Bland-Altman plots found a mean (SEM) difference between GT and estimated PAWP of - 0.23 (0.16) mm Hg in the training and - 0.05 (0.41) mm Hg in the test group. The RAM showed that our regression CNN model estimated high PAWP by focusing on the cardiomegaly and pulmonary congestion. In the test group, the area under the curve (AUC) for detecting elevated PAWP (≥ 18 mm Hg) produced by the regression CNN model was similar to the AUC of an experienced cardiologist (0.86 vs 0.83, respectively; P = 0.24). This proof-of-concept study shows that regression CNN can quantitatively estimate PAWP from standard chest radiographs in cardiovascular diseases.
Keywords: Artificial intelligence; Deep learning; Diagnostic method; Heart failure.
© 2022. The Author(s).
Conflict of interest statement
None.
Figures
References
-
- Ambrosy AP, Fonarow GC, Butler J, Chioncel O, Greene SJ, Vaduganathan M, Nodari S, Lam CSP, Sato N, Shah AN, Gheorghiade M. The global health and economic burden of hospitalizations for heart failure: lessons learned from hospitalized heart failure registries. J Am Coll Cardiol. 2014;63:1123–1133. doi: 10.1016/j.jacc.2013.11.053. - DOI - PubMed
-
- Stevenson WG, Stevenson LW, Middlekauff HR, Fonarow GC, Hamilton MA, Woo MA, Saxon LA, Natterson PD, Steimle A, Walden JA, Jan HT. Improving survival for patients with advanced heart failure: a study of 737 consecutive patients. J Am Coll Cardiol. 1995;26:1417–1423. doi: 10.1016/0735-1097(95)00341-X. - DOI - PubMed
MeSH terms
LinkOut - more resources
Full Text Sources
Miscellaneous
