. 2022 Apr;44(2):785-803.
doi: 10.1007/s11357-022-00530-6. Epub 2022 Feb 26.

Examination of pituitary adenylate cyclase-activating polypeptide in Parkinson's disease focusing on correlations with motor symptoms

Affiliations

Examination of pituitary adenylate cyclase-activating polypeptide in Parkinson's disease focusing on correlations with motor symptoms

Daniel Pham et al. Geroscience. 2022 Apr.

Abstract

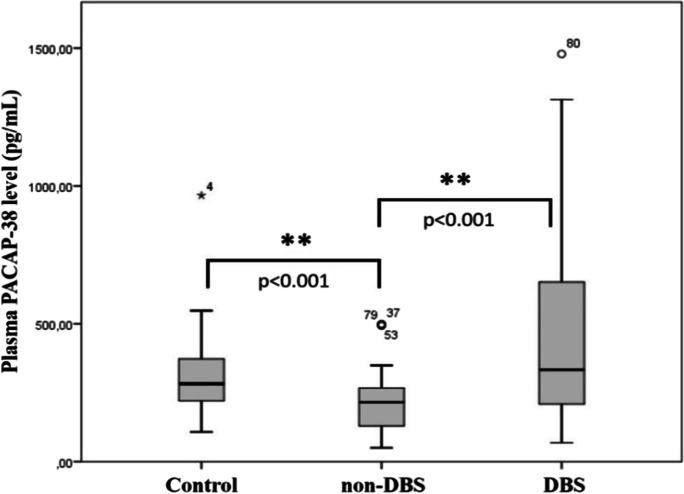
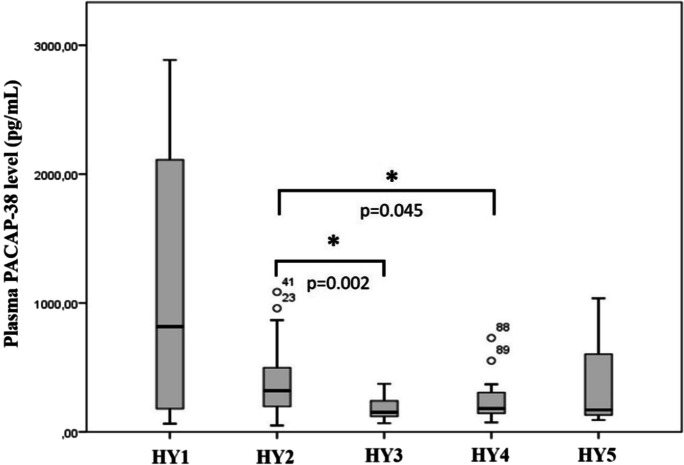
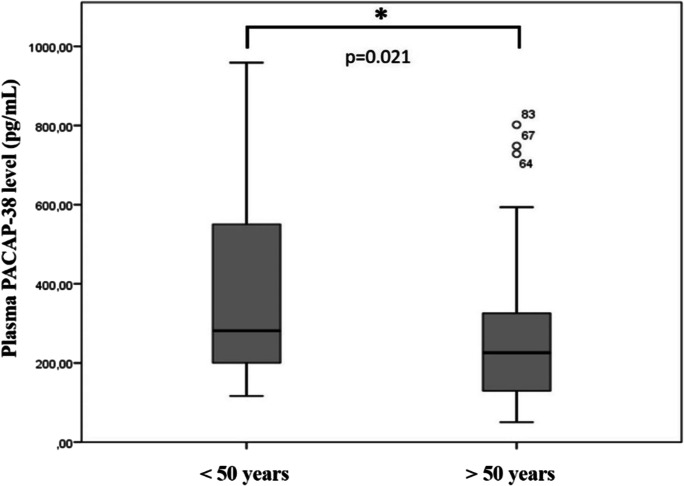
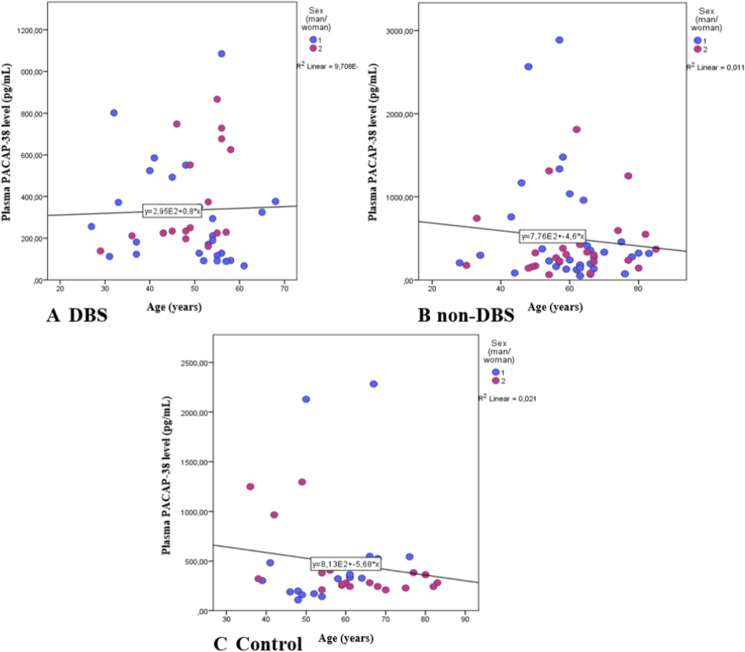
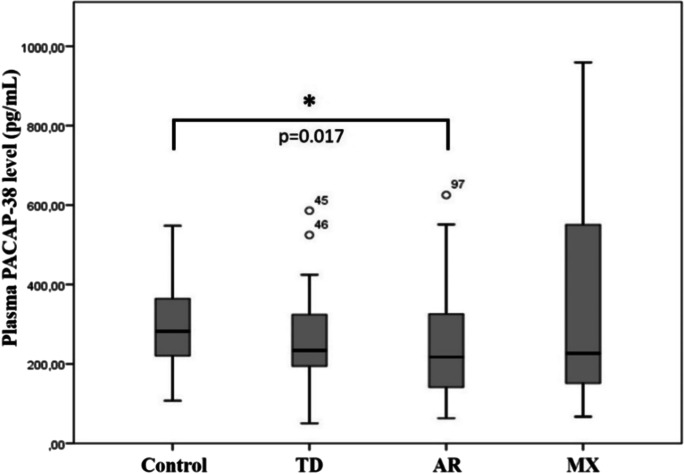
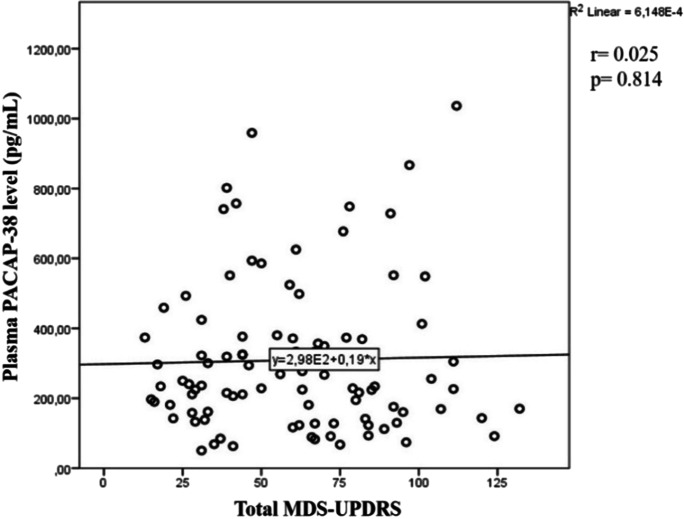
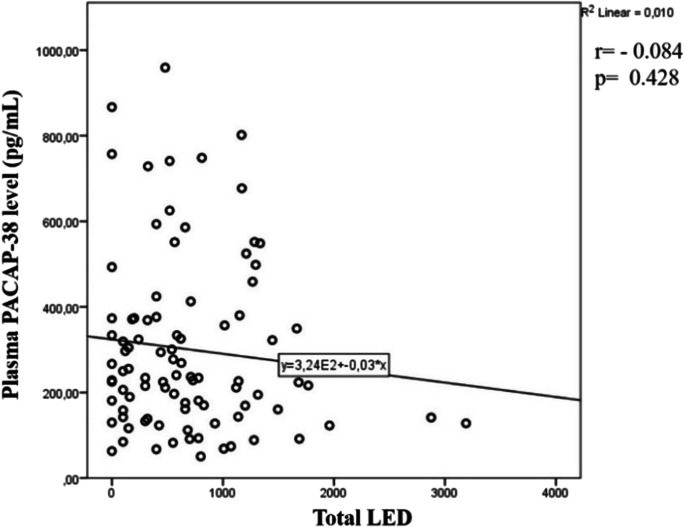
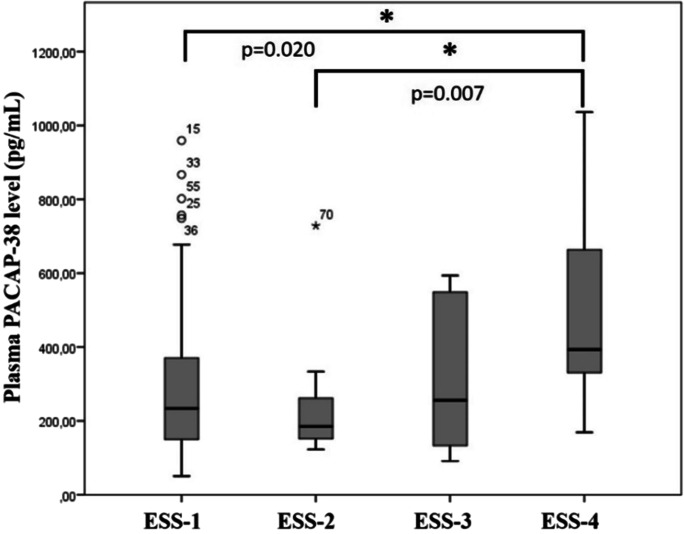
The neuroprotective effects of pituitary adenylate cyclase-activating polypeptide (PACAP) have been shown in numerous in vitro and in vivo models of Parkinson's disease (PD) supporting the theory that PACAP could have an important role in the pathomechanism of the disorder affecting mostly older patients. Earlier studies found changes in PACAP levels in neurological disorders; therefore, the aim of our study was to examine PACAP in plasma samples of PD patients. Peptide levels were measured with ELISA and correlated with clinical parameters, age, stage of the disorder based on the Hoehn and Yahr (HY) scale, subtype of the disease, treatment, and specific scores measuring motor and non-motor symptoms, such as movement disorder society-unified Parkinson's disease rating scale (MDS-UPDRS), Epworth sleepiness scale (ESS), Parkinson's disease sleep scale (PDSS-2), and Beck depression inventory (BDI). Our results showed significantly decreased PACAP levels in PD patients without deep brain stimulation (DBS) therapy and in akinetic-rigid subtype; additionally we also observed a further decrease in the HY stage 3 and 4. Elevated PACAP levels were found in patients with DBS. There were no significant correlations between PACAP level with MDS-UPDRS, type of pharmacological treatment, PDSS-2 sleepiness, or depression (BDI) scales, but we found increased PACAP level in patients with more severe sleepiness problems based on the ESS scale. Based on these results, we suggest that following the alterations of PACAP with other frequently used clinical biomarkers in PD patients might improve strategic planning of further therapeutic interventions and help to provide a clearer prognosis regarding the future perspective of the disease.

Keywords: Biomarker; DBS; PACAP plasma level; Parkinson’s disease.


Conflict of interest statement

The authors declare no competing interests.

Figures

Fig. 1
Fig. 1
Examination of PACAP-38 levels in healthy controls (control) (n = 37) and patients with Parkinson’s disease (PD). PD patients were divided into two groups, those who received deep brain stimulation (DBS) (n = 46) and those who were not treated with DBS (non-DBS) (n = 60). Significantly reduced PACAP-38 levels were measured in the non-DBS group compared to the control group. On the other hand, significantly elevated levels were detected in the DBS group compared to the non-DBS group. The boxes show the interquartile ranges, and the whiskers indicate the 25% and 75% percentile; outliers are also plotted with numbered data points labeled with circles and asterisk. The middle line within the boxes represents the median values. One-way ANOVA with Tukey’s post-hoc test, ** p < 0.001 vs. non-DBS group
Fig. 2
Fig. 2
Examination of PACAP-38 levels in the different stages of the Hoehn and Yahr (HY) scale. HY1, unilateral symptoms (n = 4); HY2, bilateral symptoms (n = 64); HY3, mild to moderate disease (n = 17); HY4, severe disability (n = 17); HY5, wheelchair bounded or bedridden (n = 3). PACAP-38 levels were significantly lower in the HY3 and HY4 group compared to the HY2 group. The boxes show the interquartile ranges, and the whiskers indicate the 25% and 75% percentile; outliers are also plotted with numbered data points labeled with circles. The middle line within the boxes represents the median values. One-way ANOVA with Tukey’s post-hoc test, * p < 0.05, p = 0.002 HY2 vs. HY3, p = 0.045 HY2 vs. HY4
Fig. 3
Fig. 3
Examination of age-dependent changes of PACAP-38 levels in patients with Parkinson’s disease. Patients were divided into two age groups: younger (< 50 year) (n = 33) and older than 50 years of age (n = 73). In the older group, significantly reduced levels can be found compared to the younger group. The boxes show the interquartile ranges, and the whiskers indicate the 25% and 75% percentile; outliers are also plotted with numbered data points labeled with circles. The middle line within the boxes represents the median values. Mann–Whitney U test, * p < 0.05, p = 0.021 vs. < 50 years
Fig. 4
Fig. 4
Correlation between age and plasma PACAP levels in the different sex groups of the PD patient with DBS (A), without DBS (non-DBS), (B) and healthy controls (C). There were no significant age-dependent changes in the DBS-treated group, in the non-DBS group, and neither in the healthy controls. Spearman’s correlation analysis
Fig. 5
Fig. 5
PACAP-38 levels in healthy individuals (control) and the groups of Parkinson’s disease subtypes; tremor dominant (TD) (n = 26), akinetic-rigid (AR) (n = 56), and mixed (MX) (n = 20). In the akinetic-rigid group significantly reduced levels were observed compared to the control group. The boxes show the interquartile ranges, and the whiskers indicate the 25% and 75% percentile; outliers are also plotted with numbered data points labeled with circles. The middle line within the boxes represents the median values. One-way ANOVA with Tukey’s post-hoc test, * p < 0.05, p = 0.017 vs. control
Fig. 6
Fig. 6
Examination of PACAP-38 levels of patients with Parkinson’s disease in correlation with the MDS-UPDRS values. There was no significant correlation between PACAP-38 levels and MDS-UPDRS scores. Spearman’s correlation analysis
Fig. 7
Fig. 7
PACAP-38 levels and their correlation with the total levodopa dose equivalency (total LED). LED values did not show significant correlation with PACAP-38 levels. Total LED can be calculated from the addition of different drug types LED, which can be counted as the actual total dosage multiplied with a certain conversion factor. Spearman’s correlation analysis
Fig. 8
Fig. 8
Differences between PACAP-38 levels in different ESS stages of PD patients. PACAP-38 levels were significantly increased in the ESS-4 group compared to those in the ESS-1 and ESS-2 group. The boxes show the interquartile ranges, and the whiskers indicate the 25% and 75% percentile; outliers are also plotted with numbered data points labeled with circles and asterisk. The middle line within the boxes represents the median values. One-way ANOVA with Tukey’s post-hoc test, * p < 0.05, p = 0.020 ESS-1 vs. ESS-4, p = 0.007 vs. ESS-4. ESS-1, normal range of sleepiness (n = 75); ESS-2, mild sleepiness (n = 15); ESS-3, moderate sleepiness (n = 10); ESS-4, severe sleepiness (n = 8)

Similar articles

Cited by

References

    1. Lebouvier T, Chaumette T, Paillusson S, Duyckaerts C, Bruley Des Varannes S, Neunlist M, et al. The second brain and Parkinsons disease. Eur J Neurosci. 2009;30:735–41. doi: 10.1111/j.1460-9568.2009.06873.x. - DOI - PubMed
    1. Baumann CR. Epidemiology, diagnosis and differential diagnosis in Parkinson’s disease tremor. Park Relat Disord. 2012;18:S90–S92. doi: 10.1016/s1353-8020(11)70029-3. - DOI - PubMed
    1. Schapira AHV. Science, medicine, and the future: Parkinson’s disease. BMJ. 1999;318:311–314. doi: 10.1136/bmj.318.7179.311. - DOI - PMC - PubMed
    1. Schrempf W, Brandt MD, Storch A, Reichmann H. Sleep disorders in Parkinson’s disease. J Parkinsons Dis. 2014;4:211–221. doi: 10.3233/JPD-130301. - DOI - PubMed
    1. Parkinson’s disease in adults: diagnosis and management. NICE Guideline, No. 71. 2017.

Publication types

Substances