. 2022 Jun;1512(1):98-113.
doi: 10.1111/nyas.14766. Epub 2022 Feb 27.

Hematopoietic stem cell transplantation ameliorates maternal diabetes-mediated gastrointestinal symptoms and autism-like behavior in mouse offspring

Affiliations

Hematopoietic stem cell transplantation ameliorates maternal diabetes-mediated gastrointestinal symptoms and autism-like behavior in mouse offspring

Jiaying Zeng et al. Ann N Y Acad Sci. 2022 Jun.

Abstract

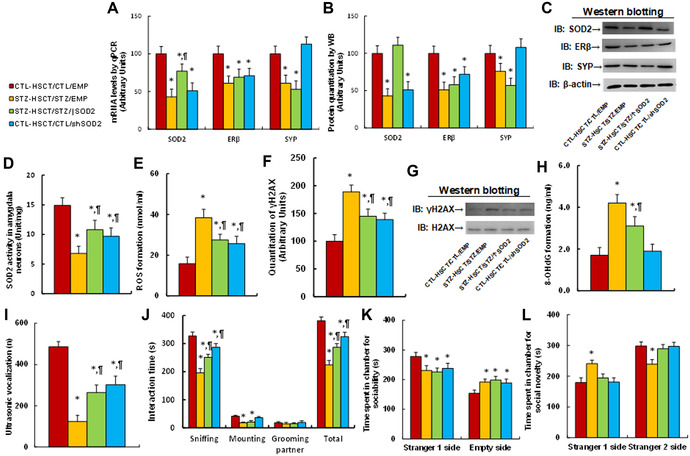
Epidemiological studies have shown that maternal diabetes is associated with autism spectrum disorder development, although the detailed mechanism remains unclear. We have previously found that maternal diabetes induces persistent epigenetic changes and gene suppression in neurons, subsequently triggering autism-like behavior (ALB). In this study, we investigated the potential role and effect of hematopoietic stem cells (HSCs) on maternal diabetes-mediated gastrointestinal (GI) dysfunction and ALB in a mouse model. We show in vitro that transient hyperglycemia induced persistent epigenetic changes and gene suppression of tight junction proteins. In vivo, maternal diabetes-mediated oxidative stress induced gene suppression and inflammation in both peripheral blood mononuclear cells and intestine epithelial cells, subsequently triggering GI dysfunction with increased intestinal permeability and altered microbiota compositions, as well as suppressed gene expression in neurons and subsequent ALB in offspring; HSC transplantation (HSCT) ameliorates this effect by systematically reversing maternal diabetes-mediated oxidative stress. We conclude that HSCT can ameliorate maternal diabetes-mediated GI symptoms and autism-like behavior in mouse offspring.

Keywords: autism; autism spectrum disorder; gastrointestinal symptoms; hematopoietic stem cells; intestinal epithelial cells; maternal diabetes.


Figures

Figure 1
Figure 1
Transient hyperglycemia triggers persistent gene suppression during subsequent normoglycemia through consistent oxidative stress. Human colon stem cells were treated with either 5 mM low glucose (LG) or 25 mM high glucose (HG) for 4 days. The cells were then infected by control (CTL), SOD2 overexpression (↑SOD2), or SOD2 mRNA knockdown (shSOD2) lentivirus for 1 day before they were treated by LG for another 4 days in the presence of 1% serum; the cells were then harvested for further analysis. (A) mRNA levels, n = 4. (B) Quantitation of protein levels, n = 5. (C) Representative immunoblots for B. (D) DNA methylation on the CLDN1 promoter, n = 4. (E) ChIP analysis on the CLDN1 promoter, n = 4. (F) DNA methylation on the ZO1 promoter, n = 4. (G) ChIP analysis on the ZO1 promoter, n = 4. * P < 0.05 versus LG(4d) + LG(4d)/CTL group; P < 0.05 versus HG(4d) + LG(4d)/CTL group. Data are expressed as mean ± SD.
Figure 2
Figure 2
Transplantation of Sod2‐expressing HSCs ameliorates, while transplantation of shSod2‐expressing HSCs mimics, maternal diabetes–mediated oxidative stress in PBMCs. Male offspring from either CTL or STZ dams received HSCT with HSCs infected by either Sod2‐ or shSod2‐expressing lentivirus for biomedical analysis. GFP lentivirus–infected HSCs were transplanted; the PBMCs from recipient mice were collected and the GFP+ cells were counted: (A) representative GFP pictures for two different treatments, including HSCs before HSCT and PBMCs after HSCT; (B) quantitation of GFP+ cells for A, n = 5. * P < 0.05 versus HSCs before HSCT group. PBMCs were collected from recipient mice after HSCT for biomedical analysis: (C) SOD2 mRNA levels, n = 4; (D) quantitation of SOD2 protein levels, n = 5; (E) representative immunoblots for D; and (F) SOD2 activity, n = 5. (G) ROS formation, n = 5. (H) 3‐nitrotyrosine formation, n = 5. (I) Quantitation of γH2AX formation, n = 5. (J) Representative immunoblots for I. (K) 8‐OHdG formation, n = 5. Serum was collected from recipient mice after HSCT for biomedical analysis: (L) GSH/GSSG ratio, n = 55; (M) Zenulin levels, n = 5; and (N) DAO activity, n = 5. * P < 0.05 versus CTL‐HSCT/CTL/EMP group; P < 0.05 versus STZ‐HSCT/STZ/EMP group. Data are expressed as mean ± SD.
Figure 3
Figure 3
Transplantation of Sod2‐expressed HSCs ameliorates, while transplantation of shSod2‐expressing HSCs mimics, maternal diabetes–mediated inflammation in PBMC. Male offspring from either CTL or STZ dams received HSCT with HSCs that were infected by either Sod2‐ or shSod2‐expressing lentivirus, and the PBMCs were isolated for analysis of proinflammatory cytokine release. (A) mRNA levels of preinflammatory cytokines, n = 4. (B) IL‐1β secretion, n = 9. (C) IL‐6 secretion, n = 9. (d) MCP1 secretion, n = 9. (E) IL17A secretion, n = 9. * P < 0.05 versus CTL‐HSCT/CTL/EMP group; P < 0.05 versus STZ‐HSCT/STZ/EMP group. Data are expressed as mean ± SD.
Figure 4
Figure 4
Potential effect of HSCT with increased Sod2 expression on maternal diabetes–mediated gene regulation in IECs. Male offspring from either CTL or STZ dams received HSCT with HSCs infected with either Sod2‐ or shSod2‐expressing lentivirus, and the IECs were isolated for biomedical analysis. (A) mRNA levels by qPCR, n = 4. (B) Quantitation of protein levels, n = 5. (C) Representative immunoblots for B. (D) SOD2 activity, n = 5. (E) Quantitation of CLDN1 protein, n = 5. (F) Representative immunoblots for E. * P < 0.05, CTL‐HSCT/CTL/EMP group. Data are expressed as mean ± SD.
Figure 5
Figure 5
Transplantation of Sod2‐expressed HSCs ameliorates, while transplantation of shSod2‐expressing HSCs mimics, maternal diabetes–mediated oxidative stress in IECs. Male offspring from either CTL or STZ dams received HSCT with HSCs infected by either Sod2‐ or shSod2‐expressing lentivirus and then IECs were isolated for biomedical analysis. (A) ROS formation, n = 5. (B) 3‐nitrotyrosine formation, n = 5. (C) Quantitation of 8‐oxo‐dG formation, n = 5. (D) Representative pictures of C for 8‐oxo‐dG staining (green) and DAPI staining for nuclei (blue). * P < 0.05 versus CTL‐HSCT/CTL/EMP group; P < 0.05 versus STZ‐HSCT/STZ/EMP group. Data are expressed as mean ± SD.
Figure 6
Figure 6
Transplantation of Sod2‐expressed HSCs ameliorates, while transplantation of shSod2‐expressing HSCs mimics, maternal diabetes–mediated GI symptoms. Male offspring from either CTL or STZ dams received HSCT with HSCs infected by either Sod2‐ or shSod2‐expressing lentivirus, and then the subsequent recipient offspring were used for analysis of GI symptoms. (A) Intestinal permeability assay by FITC‐dextran, n = 5. Gut microbiota analysis, n = 9: (B) species richness; (C) species diversity; (D) overview of the identified relative frequencies of different phyla found in treated mice; (E) relative abundance of Mucispirillumn; and (F) relative abundance of different bacteria at the phylum level. * P < 0.05 versus CTL‐HSCT/CTL/EMP group; P < 0.05 versus STZ‐HSCT/STZ/EMP group. Data are expressed as mean ± SD.
Figure 7
Figure 7
Transplantation of Sod2‐expressing HSCs ameliorates, while transplantation of shSod2‐expressing HSCs mimics, maternal diabetes–mediated ALB. Male offspring from either CTL or STZ dams received HSCT operation with HSC cells that were infected by either Sod2‐ or shSod2‐expressing lentivirus, and the subsequent recipient offspring were used for further analysis. The amygdala tissues from recipient offspring were isolated for biomedical analysis: (A) mRNA levels by qPCR, n = 4. (B) Quantitation of protein levels, n = 5. (C) Representative immunoblots for B. (D) SOD2 activity, n = 5. (E) ROS formation, n = 5. (F) Quantitation of γH2AX formation, n = 5. (G) Representative immunoblots for F. (H) 8‐OHdG formation, n = 5. The recipient offspring were used for analysis of ALB: (I) ultrasonic vocalization, n = 9. (J) Social interaction (SI) test, with total interaction time and amount of time spent following, mounting, grooming, and sniffing any body parts of the other mouse were calculated, n = 9. Three‐chambered social tests, n = 9: (K) time spent in chamber for sociability. (L) Time spent in chamber for social novelty. * P < 0.05 versus CTL‐HSCT/CTL/EMP group; P < 0.05 versus STZ‐HSCT/STZ/EMP group. Data are expressed as mean ± SD.
Figure 8
Figure 8
Schematic model for the potential effect of HSCT on maternal diabetes–mediated GI symptoms and ALB. ASD, autism spectrum disorder; GI, gastrointestinal; GSH, reduced glutathione; GSSG, oxidized glutathione; HSCs, hematopoietic stem cells; IEC, intestine epithelial cell; PBMCs, peripheral blood mononuclear cells; SOD2, superoxide dismutase 2.

Similar articles

Cited by

References

    1. Courchesne, E. , Gazestani V.H. & N.E. Lewis. 2020. Prenatal origins of ASD: the when, what, and how of ASD development. Trends Neurosci. 43: 326–342. - PMC - PubMed
    1. Maenner, M.J. , Shaw K.A., Baio J., et al. 2020. Prevalence of autism spectrum disorder among children aged 8 years — autism and developmental disabilities monitoring network, 11 sites, United States, 2016. MMWR Surveill. Summ. 69: 1–12. - PMC - PubMed
    1. Baron‐Cohen, S. , Lombardo M.V., Auyeung B., et al. 2011. Why are autism spectrum conditions more prevalent in males? PLoS Biol. 9: e1001081. - PMC - PubMed
    1. Liu, J. , Liang Y., Jiang X., et al. 2021. Maternal diabetes‐induced suppression of oxytocin receptor contributes to social deficits in offspring. Front. Neurosci. 15: 634781. - PMC - PubMed
    1. Wang, X. , Lu J., Xie W., et al. 2019. Maternal diabetes induces autism‐like behavior by hyperglycemia‐mediated persistent oxidative stress and suppression of superoxide dismutase 2. Proc. Natl. Acad. Sci. USA 116: 23743–23752. - PMC - PubMed

Publication types